ERCnet: Phylogenomic Prediction of Interaction Networks in the Presence of Gene Duplication
- PMID: 40247660
- PMCID: PMC12062884
- DOI: 10.1093/molbev/msaf089
ERCnet: Phylogenomic Prediction of Interaction Networks in the Presence of Gene Duplication
Abstract
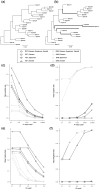
Assigning gene function from genome sequences is a rate-limiting step in molecular biology research. A protein's position within an interaction network can potentially provide insights into its molecular mechanisms. Phylogenetic analysis of evolutionary rate covariation (ERC) in protein sequence has been shown to be effective for large-scale prediction of functional relationships and interactions. However, gene duplication, gene loss, and other sources of phylogenetic incongruence are barriers for analyzing ERC on a genome-wide basis. Here, we developed ERCnet, a bioinformatic program designed to overcome these challenges, facilitating efficient all-versus-all ERC analyses for large protein sequence datasets. We simulated proteome datasets and found that ERCnet achieves combined false positive and negative error rates well below 10% and that our novel "branch-by-branch" length measurements outperforms "root-to-tip" approaches in most cases, offering a valuable new strategy for performing ERC. We also compiled a sample set of 35 angiosperm genomes to test the performance of ERCnet on empirical data, including its sensitivity to user-defined analysis parameters such as input dataset size and branch-length measurement strategy. We investigated the overlap between ERCnet runs with different species samples to understand how species number and composition affect predicted interactions and to identify the protein sets that consistently exhibit ERC across angiosperms. Our systematic exploration of the performance of ERCnet provides a roadmap for design of future ERC analyses to predict functional interactions in a wide array of genomic datasets. ERCnet code is freely available at https://github.com/EvanForsythe/ERCnet.
Keywords: coevolution; evolutionary rate covariation; interaction networks; interactome; protein interactions.
© The Author(s) 2025. Published by Oxford University Press on behalf of Society for Molecular Biology and Evolution.
Figures


Similar articles
-
PhyInformR: phylogenetic experimental design and phylogenomic data exploration in R.BMC Evol Biol. 2016 Dec 1;16(1):262. doi: 10.1186/s12862-016-0837-3. BMC Evol Biol. 2016. PMID: 27905871 Free PMC article.
-
Network-based microsynteny analysis identifies major differences and genomic outliers in mammalian and angiosperm genomes.Proc Natl Acad Sci U S A. 2019 Feb 5;116(6):2165-2174. doi: 10.1073/pnas.1801757116. Epub 2019 Jan 23. Proc Natl Acad Sci U S A. 2019. PMID: 30674676 Free PMC article.
-
Analysis of phylogenomic datasets reveals conflict, concordance, and gene duplications with examples from animals and plants.BMC Evol Biol. 2015 Aug 5;15:150. doi: 10.1186/s12862-015-0423-0. BMC Evol Biol. 2015. PMID: 26239519 Free PMC article.
-
Nuclear phylogenomics of angiosperms and insights into their relationships and evolution.J Integr Plant Biol. 2024 Mar;66(3):546-578. doi: 10.1111/jipb.13609. Epub 2024 Jan 30. J Integr Plant Biol. 2024. PMID: 38289011 Review.
-
Insights from the comparison of plant genome sequences.Annu Rev Plant Biol. 2010;61:349-72. doi: 10.1146/annurev-arplant-042809-112235. Annu Rev Plant Biol. 2010. PMID: 20441528 Review.
Cited by
-
From Trees to Traits: A Review of Advances in PhyloG2P Methods and Future Directions.Genome Biol Evol. 2025 Sep 2;17(9):evaf150. doi: 10.1093/gbe/evaf150. Genome Biol Evol. 2025. PMID: 40907979 Free PMC article. Review.
References
-
- Benjamini Y, Hochberg Y. Controlling the false discovery rate : a practical and powerful approach to multiple testing. R Stat Soc. 1995:57(1):289–300. 10.1111/j.2517-6161.1995.tb02031.x. - DOI
MeSH terms
LinkOut - more resources
Full Text Sources

