Parallel Selection in Domesticated Atlantic Salmon from Divergent Founders Including on Whole-Genome Duplication-derived Homeologous Regions
- PMID: 40247730
- PMCID: PMC12006720
- DOI: 10.1093/gbe/evaf063
Parallel Selection in Domesticated Atlantic Salmon from Divergent Founders Including on Whole-Genome Duplication-derived Homeologous Regions
Abstract
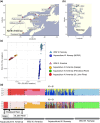
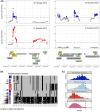
Domestication and artificial selection for desirable traits have driven significant phenotypic changes and left detectable genomic footprints in farmed animals. Since the 1960s, intensive breeding has led to the rapid domestication of Atlantic salmon (Salmo salar), with multiple independent events that make it a valuable model for studying early domestication stages and the parallel evolution of populations of different origins subjected to similar selection pressures. Some aquatic species, including Atlantic salmon, have undergone whole-genome duplication (WGD), raising the possibility that genetic redundancy resulting from WGD has contributed to adaptation in captive environments, as seen in plants. Here, we examined the genomic responses to domestication in Atlantic salmon, focusing on potential signatures of parallel selection, including those associated with WGD. Candidate genomic regions under selection were identified by comparing whole-genome sequences from aquaculture and wild populations across 2 independently domesticated lineages (Western Norway and North America) using a genome-wide scan that combined 3 statistical methods: allele frequencies (FST), site frequency (Tajima's D), and haplotype differentiation (XP-EHH). These analyses revealed shared selective sweeps on identical SNPs in major histocompatibility complex (MHC) genes across aquaculture populations. This suggests that a combination of long-term balancing selection and recent human-induced selection has shaped MHC gene evolution in domesticated salmon. Additionally, we observed selective sweeps on a small number of gene pairs in homeologous regions originating from WGD, offering insights into how historical genome duplication events may intersect with recent selection pressures in aquaculture species.
Keywords: MHC; aquaculture; artificial selection; domestication; ohnolog.
© The Author(s) 2025. Published by Oxford University Press on behalf of Society for Molecular Biology and Evolution.
Figures


Similar articles
-
Comparing genomic signatures of domestication in two Atlantic salmon (Salmo salar L.) populations with different geographical origins.Evol Appl. 2018 Dec 7;12(1):137-156. doi: 10.1111/eva.12689. eCollection 2019 Jan. Evol Appl. 2018. PMID: 30622641 Free PMC article.
-
Evidence of recent signatures of selection during domestication in an Atlantic salmon population.Mar Genomics. 2016 Apr;26:41-50. doi: 10.1016/j.margen.2015.12.007. Epub 2015 Dec 23. Mar Genomics. 2016. PMID: 26723557
-
Atlantic salmon populations reveal adaptive divergence of immune related genes - a duplicated genome under selection.BMC Genomics. 2016 Aug 11;17(1):610. doi: 10.1186/s12864-016-2867-z. BMC Genomics. 2016. PMID: 27515098 Free PMC article.
-
Atlantic salmon (Salmo salar L.) genetics in the 21st century: taking leaps forward in aquaculture and biological understanding.Anim Genet. 2019 Feb;50(1):3-14. doi: 10.1111/age.12748. Epub 2018 Nov 14. Anim Genet. 2019. PMID: 30426521 Free PMC article. Review.
-
A critical review of adaptive genetic variation in Atlantic salmon: implications for conservation.Biol Rev Camb Philos Soc. 2007 May;82(2):173-211. doi: 10.1111/j.1469-185X.2006.00004.x. Biol Rev Camb Philos Soc. 2007. PMID: 17437557 Review.
References
-
- Arima K, Kinoshita A, Mishima H, Kanazawa N, Kaneko T, Mizushima T, Ichinose K, Nakamura H, Tsujino A, Kawakami A, et al. Proteasome assembly defect due to a proteasome subunit beta type 8 (PSMB8) mutation causes the autoinflammatory disorder, Nakajo-Nishimura syndrome. Proc Natl Acad Sci U S A. 2011:108(36):14914–14919. 10.1073/pnas.1106015108. - DOI - PMC - PubMed
MeSH terms
Grants and funding
LinkOut - more resources
Full Text Sources
Research Materials
Miscellaneous

