. 2025 Apr 17:8:0675.
doi: 10.34133/research.0675. eCollection 2025.

Perilla frutescens Leaf-Derived Extracellular Vesicle-Like Particles Carry Pab-miR-396a-5p to Alleviate Psoriasis by Modulating IL-17 Signaling

Affiliations

Perilla frutescens Leaf-Derived Extracellular Vesicle-Like Particles Carry Pab-miR-396a-5p to Alleviate Psoriasis by Modulating IL-17 Signaling

Yali Liu et al. Research (Wash D C). .

Abstract

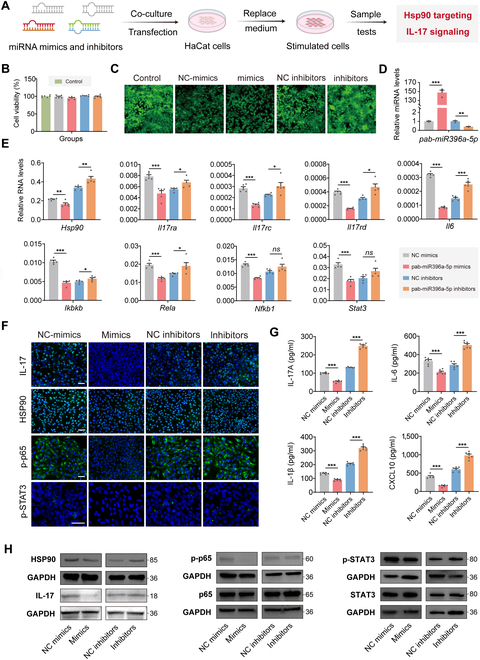
Psoriasis, a chronic inflammatory skin disorder, remains challenging to treat due to poor skin barrier penetration, limited efficacy, and adverse effects of current therapies. Natural plant-derived extracellular vesicle-like particles (EVPs) have emerged as biocompatible carriers for bioactive molecules. Among various medicinal plants screened, Perilla frutescens leaf-derived EVPs (PLEVPs) exhibited strong anti-inflammatory and antioxidant effects. By incorporating PLEVPs into a hydrogel formulation, we enhanced their stability, retention at psoriatic lesions, and transdermal delivery efficiency. In vivo studies demonstrated that the PLEVPs markedly alleviated psoriasis symptoms in both preventive and therapeutic mouse models, outperforming conventional treatments. This effect was attributed to reduced oxidative stress, modulation of Treg cells, and promotion of keratinocyte apoptosis. Transcriptomic analysis revealed enrichment of the interleukin-17 (IL-17) signaling pathway, a major driver of psoriasis, while small RNA sequencing identified pab-miR396a-5p, an endogenous microRNA (miRNA) within PLEVPs, as a key regulator. Mechanistic studies showed that pab-miR396a-5p targets the 3'-untranslated region of plant heat shock protein 83a, a homolog of mammalian heat shock protein 90, leading to the suppression of nuclear factor-kappa B and Janus kinase/signal transducers and activators of transcription signaling, inhibiting the IL-17 signaling pathway. Validation using lipid nanoparticles encapsulating pab-miR396a-5p mimics confirmed comparable therapeutic effects. This study highlights the potential of plant-derived EVPs as carriers of endogenous miRNAs, enabling interkingdom communication and offering a scalable platform for psoriasis therapy.


Conflict of interest statement

Competing interests: The authors declare that they have no competing interests.

Figures

Fig. 1.
Fig. 1.
PLEVPs hydrogel alleviates psoriasis by modulating the IL-17 signaling pathway. PLEVPs are secreted or self-assembled from multivesicular bodies (MVBs) within P. frutescens leaf cells (①), delivering bioactive molecules including nucleic acids and proteins, with pab-miR396a-5p specially identified (②) and can be internalized by keratinocytes after topical application (③). Psoriasis progression is characterized by increased Th17 cell activation and IL-17 secretion, leading to keratinocyte hyperproliferation, inflammation, and apoptosis. The application of PLEVPs hydrogel leads to therapeutic effects of reducing reactive oxygen species (ROS), promoting apoptosis via caspase-3 activation, and increasing Treg (Foxp3+) cell activity. The pab-miR396a-5p delivered by PLEVPs targets HSP90, down-regulating the IL-17 signaling pathway and subsequently reducing pro-inflammatory cytokines (IL-17, TNF-α, and IL-6), inhibiting keratinocyte hyperproliferation and alleviating psoriasis symptoms.
Fig. 2.
Fig. 2.
Extracellular vesicle-like particles (EVPs) from 10 different medicinal plants are successfully prepared and PLEVPs excel in reducing ROS and inflammatory cytokine levels in HaCaT cells. (A) Schematic of the preparation process, including grinding, centrifugation, ultracentrifugation, and sucrose gradient separation to obtain EVPs from different plants. (B) Particle size distribution and morphological images of 10 different plant-derived EVPs analyzed by NTA and TEM, respectively. (C) Effects of plant-derived EVPs on HaCaT cell viability, ROS production, and inflammatory cytokine secretion (IL-6 and IL-1β). Flow cytometry analysis was used to assess intracellular ROS levels. The corresponding plant sources are as follows: (I) P. frutescens Britt, (II) Panax ginseng C. A. Mey, (III) Zingiber officinale Roscoe, (IV) Coptis chinensis Franch., (V) Panax notoginseng F. H. Chen, (VI) Angelica sinensis Diels, (VII) Agastache rugosa Kuntze, (VIII) Mentha haplocalyx Briq, (IX) Astragalus membranaceus Bunge, and (X) Curcuma longa L. Data are presented as mean ± SD. Statistical analysis was performed using one-way ANOVA, with ***P < 0.001 indicating statistical significance. ns, no significance.
Fig. 3.
Fig. 3.
PLEVPs exhibit distinct profiles compared to Perilla leaf juice and inhibit oxidative stress and reduce pro-inflammatory cytokine secretion in HaCaT cells. (A) PLEVPs isolated from Perilla leaf juice using ultracentrifugation with a sucrose density gradient (8%, 15%, 30%, 45%, and 60%) and collected from the 45% interface. (B) Lipidomic analysis of major lipid categories comparing Perilla leaf juice and PLEVPs. (C) Detailed lipid subclass distribution in Perilla leaf juice and PLEVPs. (D) Protein patterns of Perilla leaf juice and PLEVPs analyzed by SDS-PAGE. (E) RNA profile of Perilla leaf juice and PLEVPs analyzed by agarose gel electrophoresis. (F) Cell viability of HaCaT cells treated with various concentrations of PLEVPs (2, 5, 10, 25, and 50 μg/ml) for 48 h (n = 5). (G) Schematic of PLEVPs treatment in IL-6-stimulated HaCaT cells followed by DCF-DA staining to assess intracellular ROS levels using flow cytometry and confocal microscopy. (H) Mean fluorescent intensity (MFI) of ROS levels in IL-6-stimulated HaCaT cells after PLEVPs treatment (2 to 50 μg/ml) (n = 3). (I) Representative DCF-DA fluorescence images for ROS levels in HaCaT cells. (J) ELISA quantification of IL-6 and IL-1β levels in the supernatants of IL-6-stimulated HaCaT cells following PLEVPs treatment (n = 5). (K) Schematic procedures of cellular uptake studies using DIR- and DIO-stained PLEVPs in both HaCaT cells and IL-6-stimulated HaCaT cells. (L) Representative confocal images of the uptakes of PLEVPs labeled with DIR (red) and DIO (green) by HaCaT cells and IL-6-stimulated HaCaT cells at different time points (2, 6, 12, and 24 h). Data are presented as mean ± SD. Statistical analysis was performed using one-way ANOVA, with *P < 0.05, **P < 0.01, ***P < 0.001 indicating statistical significance.
Fig. 4.
Fig. 4.
Stability characterization, retention, and release properties of PLEVPs incorporated into hydrogel formulations. (A) Schematic representation of the stability assay, with PLEVPs hydrogel stored at 4 °C under dark conditions and analyzed on days 0, 7, 30, and 60. (B) Representative images of Carbopol hydrogels containing PLEVPs at different concentrations 1, 0.5, and 0.2 mg/ml on day 0 and day 60. (C) Time-dependent changes in PLEVPs particle size in the hydrogel system, as determined by nanoparticle tracking analysis (NTA). (D) Zeta potential analysis comparing the surface charge stability of PLEVPs in solution versus hydrogel formulations (n = 6). (E and F) Particle size distribution and morphology of PLEVPs in solution and hydrogel formulations characterized by NTA and transmission electron microscopy (TEM). (G) In vivo fluorescence imaging of mouse skin showing enhanced retention of PLEVPs delivered via hydrogel compared to solution at 1 h and 6 h postapplication. (H) Cryosection images comparing PLEVPs release from solution and hydrogel in mouse skin. (I) Two-photon microscopy images showing transdermal penetration and distribution of PLEVPs hydrogel versus FITC hydrogel in both healthy and psoriatic mouse skin.
Fig. 5.
Fig. 5.
Topical administration of PLEVPs hydrogel demonstrate prevention efficacy in a psoriasis-like mouse model. (A) Experimental timeline covering the induction of psoriasis-like symptoms and the therapeutic administration of PLEVPs hydrogel. (B) Representative images of dorsal skin condition and spleen size in different treatment groups. (C) Spleen index comparison across different groups. (D) Skin thickness, (E) PASI scores, and (F) body weight profiles over course of treatments. The labels for the different treatment groups are shown in the gray box at the top of the figures. (G) H&E staining of sections with observation of epidermal thickness and inflammatory conditions. Scale bar, 100 μm. (H) Immunohistochemistry (IHC) analysis of IL-17 and Ki67 to assess inflammatory response and cell proliferation in the skin. Scale bar, 100 μm. (I) Immunofluorescence (IF) staining for Caspase-3, CD45, and CD4 in skin sections to assess apoptosis and immune cell infiltration. Scale bar, 100 μm. (J and K) Flow cytometry analysis of spleen single-cell suspensions, quantifying the proportions of CD8+ T cells, CD4+ T cells, and CD4+ Foxp3+ Treg cells. (L) ELISA quantification of inflammatory cytokines including IL-1β, TNF-α, IL-17a, IL-23p19, IL-12p70, and IL-12/23p40. Data are presented as mean ± SD (n = 6). Statistical analysis was performed using one-way ANOVA, with *P < 0.05, **P < 0.01, ***P < 0.001 indicating statistical significance.
Fig. 6.
Fig. 6.
Transcriptomic analysis reveals significant down-regulation of IL-17 signaling pathway after topical treatment of PLEVPs hydrogel in psoriatic skin inflammation model. (A) Schematic workflow for RNA sequencing from lesional skin, including RNA extraction, cDNA synthesis, and bioinformatics analysis. (B) Volcano plot of differentially expressed genes between PLEVPs-treated and model groups (cutoff: |log2FC| > 1, q < 0.05). (C) Heatmap of significantly altered gene expression profiles between PLEVPs-treated and control groups (n = 5). (D) Gene Ontology (GO) enrichment analysis of biological processes related to cytokine activity, chemotaxis, and inflammatory response. (E) KEGG pathway enrichment analysis of key pathways modulated by PLEVPs treatment, including IL-17, NF-κB, and JAK-STAT signaling pathways. (F) Gene Set Enrichment Analysis (GSEA) plot of significantly enriched IL-17 signaling pathway comparing PLEVPs-treated and model groups. (G) qPCR validation of genes related to IL-17 signaling (Il17a, Il17f, Il23a, Il22, Cxcl1, Cxcl2, Il6, and Cxcl5) after PLEVPs treatment (n = 4). Data are presented as mean ± SD. Statistical analysis was performed using one-way ANOVA, with *P < 0.05, **P < 0.01, ***P < 0.001 indicating statistical significance.
Fig. 7.
Fig. 7.
Small RNA sequencing reveals differential miRNA expression in IL-6-stimulated HaCaT cells treated with PLEVPs. (A) Schematic of the experimental workflow, including co-culture of PLEVPs with IL-6-stimulated HaCaT cells, followed by RNA extraction, library preparation, and small RNA sequencing using Perilla leaf-specific database. (B) PCA of small RNA expression profiles in PLEVPs-treated and control groups. (C) Heatmap of differentially expressed small RNAs between these 2 groups. (D) Volcano plot of significantly up-regulated small RNAs in PLEVPs -treated cells with emphasis on pab-miR396a-5p. (E) GO enrichment analysis of biological processes and molecular functions associated with gene expression regulation. (F) KEGG pathway enrichment analysis highlighting the IL-17 signaling pathway. (G) qPCR validation of pab-miR396a-5p expression in PLEVPs-treated and control groups. (H) Identification of HSP83a as a target mRNA of pab-miR396a-5p, followed by schematic of the dual-luciferase reporter assay constructs, showing wild-type (WT) and mutant (MT) sequences. (I) The interaction between pab-miR396a-5p and HSP83a validated by dual-luciferase assay. Data were presented as mean ± SD. Statistical analysis was performed using one-way ANOVA, with ***P < 0.001 indicating statistical significance.
Fig. 8.
Fig. 8.
Overexpression and inhibition of pab-miR396a-5p regulate HSP90 and IL-17 signaling pathway activity in HaCaT cells. (A) Schematic diagram of the transfection and experimental workflow: pab-miR396a-5p mimics and inhibitors were transfected into IL-6-stimulated HaCaT cells, followed by the extraction of RNA and protein for downstream analyses. (B) Cell viability assay (CCK-8) after transfection with NC mimics, pab-miR396a-5p mimics, NC inhibitors, or pab-miR396a-5p inhibitors compared to the control group. (C) Live/dead cell staining images of HaCaT cells after transfection of miRNAs, where green fluorescence represents live cells. (D) qPCR analysis of pab-miR396a-5p expression levels in HaCaT cells transfected with miRNAs. (E) qPCR results for key genes in the IL-17 signaling pathway (Hsp90, Il17ra, Il17rc, Il17rd, and Il6) and genes involved in the NF-κB and JAK-STAT pathways (Ikbkb, Rela, Nfkb1, and Stat3) across different transfection conditions. (F) Immunofluorescence staining of IL-17, HSP90, p-p65, and p-STAT3 in HaCaT cells after transfection with different miRNA samples. Scale bar, 100 μm. (G) ELISA results of IL-17a, IL-6, IL-1β, and CXCL10 concentrations in the cell culture supernatants of transfected HaCaT cells. (H) Western blot analysis of HSP90, IL-17, p-p65, and p-STAT3 protein levels in HaCaT cells after different miRNA transfections. Data are presented as mean ± SD, n = 5. Statistical analysis was performed using one-way ANOVA, with *P < 0.05, **P < 0.01, ***P < 0.001 indicating statistical significance.
Fig. 9.
Fig. 9.
LNPs encapsulated pab-miR396a-5p mimics mitigate IMQ-induced psoriasis on mice. (A) Schematic of the process to encapsulate miRNA mimics and negative control (NC) mimics into lipid nanoparticles (LNPs) using microfluidic mixing, followed by administration to the IMQ-induced psoriasis-like mouse model. (B) Representative images of mouse dorsal skin lesions on day 8. (C) Body weight, (D) PASI scores, and (E) full skin thickness profile comparisons across all treatment groups over 8 days. The labels for the different treatment groups are shown in the gray box at the top of the figures. (F) Spleen index among different treatment groups. (G) ELISA analysis of serum inflammatory cytokines (IL-6, IL-17a, and CCL2) from different treatment groups. (H) Comparison of spleen size among different groups. (I) H&E staining of skin tissues from each group, highlighting histological differences and epidermal thickness. Scale bar, 100 μm. (J) IF staining of p-p65 and p-STAT3, and IHC analysis of IL-17 and HSP90 in skin tissue from each group. Scale bar, 100 μm. (K) Quantification of IF and IHC results, showing integrated optical density (IOD) measurements for p-p65, p-STAT3, IL-17, and HSP90. Data are presented as mean ± SD, n = 5. Statistical analysis was performed using one-way ANOVA, with *P < 0.05, **P < 0.01, ***P < 0.001 indicating statistical significance.
Fig. 10.
Fig. 10.
PLEVPs deliver pab-miR396a-5p to mediate down-regulation of the IL-17 signaling pathway. Upon PLEVPs treatment, pab-miR396a-5p is delivered into keratinocytes, where it targets and down-regulates HSP90 mRNA. This down-regulation inhibits both the JAK2/STAT3 and NF-κB (p65) signaling pathways. Inhibition of the JAK2/STAT3 pathway can reduce the production of CXCL10, IL-6, and IL-23, while suppression of the NF-κB pathway decreases TNF-α, IL-6, and IL-1β levels. Together, these effects lead to the down-regulation of IL-17 signaling, reducing the expression of IL-17a, IL-22, and CXCL5, ultimately resulting in decreased inflammation and keratinocyte proliferation.
Fig. 11.
Fig. 11.
PLEVPs hydrogel show no significant toxicity in mice after repeated administration with recovery periods. (A) Experimental timeline of PLEVPs hydrogel administration and sample collection. Mice were depilated on day 0, followed by treatment with PLEVPs or PBS. After the initial treatment and skin recovery period, a second round of treatments was administered with sacrifices for safety assessments. (B) Representative images of dorsal skin during treatment and recovery periods at different time points (days 0, 6, and 15). (C) Measurements of body weight, full skin thickness at days 6 and 15 (n = 6). (D) Blood routine and biochemical examinations, including blood parameters (WBC, lymphocytes, RBC, and PLT) and serum biochemical markers for liver (ALT, AST, and γ-GT) and kidney (CREA, BUN, and UA) function (n = 3). (E) H&E examination of skin and major organs (heart, liver, spleen, lung, and kidney) at day 0, day 6, and day 15 to assess histopathological changes after PLEVPs treatment. Scale bar, 100 μm. Data were presented as mean ± SD.

References

    1. Sewerin P, Brinks R, Schneider M, Haase I, Vordenbäumen S. Prevalence and incidence of psoriasis and psoriatic arthritis. Ann Rheum Dis. 2019;78(2):286–287. - PubMed
    1. Armstrong AW, Read C. Pathophysiology, clinical presentation, and treatment of psoriasis. JAMA. 2020;323(19):1945. - PubMed
    1. Gregoire ARF, DeRuyter BK, Stratman EJ. Psoriasis flares following systemic glucocorticoid exposure in patients with a history of psoriasis. JAMA Dermatol. 2021;157(2):198–201. - PMC - PubMed
    1. Dai A, Kim SJ. Systemic calcineurin inhibitors tacrolimus and voclosporin: A review of off-label dermatologic uses. J Am Acad Dermatol. 2024;90(2):358–367. - PubMed
    1. Evans M, Dahdaleh S, Karunaratne K, Pritchard J, Rinaldi S, Viegas S. 192 tacrolimus-induced chronic inflammatory demyelinating polyradiculoneuropathy (CIDP): A case series. J Neurol Neurosurg Psychiatry. 2022;93:e2.

LinkOut - more resources