. 2025;29(5):28.
doi: 10.1007/s10404-025-02802-x. Epub 2025 Apr 15.

Modelling, simulation, and experimental characterization of particle sedimentation inside a horizontal syringe

Affiliations

Modelling, simulation, and experimental characterization of particle sedimentation inside a horizontal syringe

Maryamsadat Ghoreishi et al. Microfluid Nanofluidics. 2025.

Abstract

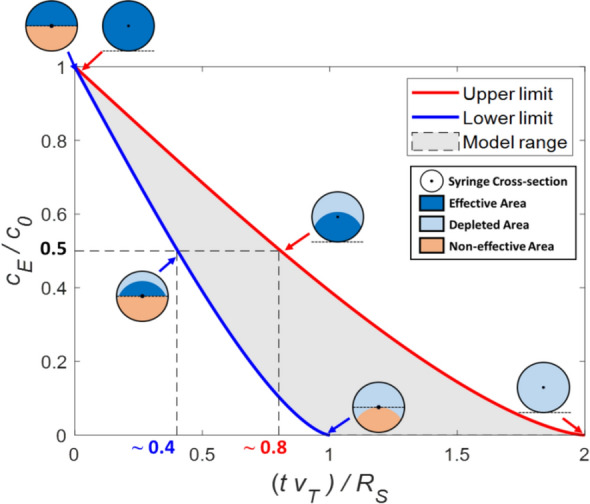
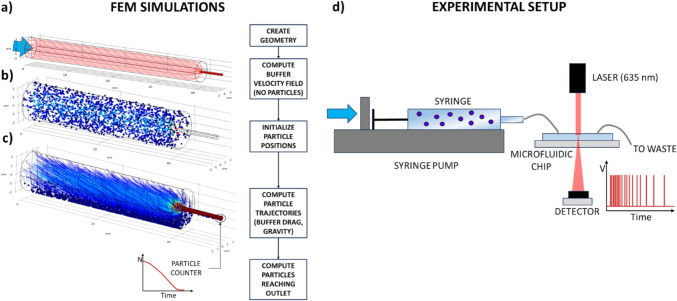
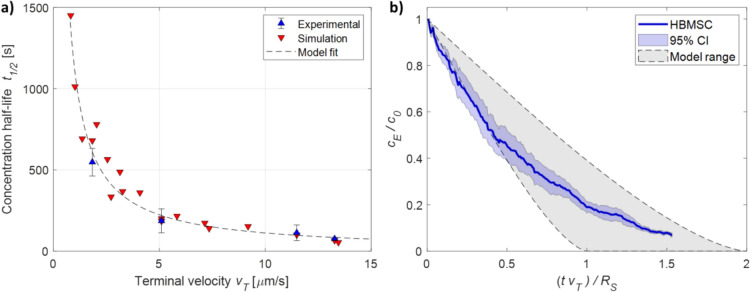
Sedimentation is the settling of solid particles in a liquid medium driven by gravity. This phenomenon poses significant challenges in experimental lab-on-chip (LOC) applications, as they often involve a biological sample to be loaded inside a syringe for prolonged periods (e.g. 3D bioprinting, microfluidic cytometers). Mitigating solutions such as mechanical agitators or buffer adjustments exist, but increase the complexity and cost of the setup. In this work, we developed a model of particle sedimentation inside a horizontal syringe, which highlights the importance of several parameters: syringe radius, particle terminal velocity in the buffer, syringe outlet position, and flow-rate. The model provides a simple way to estimate the concentration half-life ( t 1 / 2 ), i.e. the time required for the concentration to halve, which is useful during the experiment design process. The model was initially tested numerically and then validated experimentally. Additionally, the applicability of the model to predict sedimentation of biological particles was experimentally demonstrated. Lastly, the model was used to develop guidelines for the design of setups with minimized sedimentation.

Supplementary information: The online version contains supplementary material available at 10.1007/s10404-025-02802-x.

Keywords: 3D bioprinting; Bioengineering; Concentration half-life; Lab-on-a-chip; Sedimentation; Syringe.


Conflict of interest statement

Conflict of interestThe authors declare no competing interests.

Figures

Fig. 1
Fig. 1
Sedimentation inside a horizontal syringe. a, b System model: the forces acting on particles are on particles are gravity, Fgnet, and the fluid drag (both horizontally along the z-axis, DZ, and vertically along the y-axis, Dy). c In the syringe cross-section, sedimentation causes a downward translation of particles over time. If all particles move at the same velocity, they maintain their relative positions to each other, and the local concentration remains constant. d As particle undergo sedimentation, they leave behind a region depleted of particles which results in a decreased effective concentration. e If the vertical component of the buffer velocity field is lower than particle terminal velocity everywhere in the syringe, particles below the nozzle will never be able to leave the syringe, creating a non-effective region, which is a region filled with particles that do not count towards the effective concentration
Fig. 2
Fig. 2
Sedimentation dynamics according to the proposed model. The model describes the decrease in effective concentration CE/C0 as a function of the time t, the terminal velocity vT, and the syringe radius RS. The red line represents the upper boundary described by Eq. 8, whereas the the blue line represents the lower boundary described by Eq. 12. The intersection between the line CE/C0=0.5 and the two boundaries yield the values for KS given in Eq. 15. The shaded gray area between the boundaries represents the range allowed by the model. By increasing the flow-rate, the sedimentation dynamics moves from the blue line to the red line. Syringe cross-section schematics show the effective/depleted/non-effective areas for CE/C0=1, 0.5, and 0 for the two conditions
Fig. 3
Fig. 3
Sedimentation model validation. ac FEM simulations were performed using COMSOL Multiphysics®. a After creating the syringe FEM model, the velocity field of the buffer without particles is computed. b 2000 particles are randomly generated inside the syringe. c The velocity field is used to calculate particle trajectories while subject to gravity and fluid drag. Lines represent particle trajectories with their color dependindg on the local velocity. The number of particles reaching the outlet over time is measured with a particle counter and used to quantify sedimentation. d Experimental setup: samples are loaded onto a syringe mounted on a syringe pump and connected to a microfluidic particle counting chip. A laser is focused on the measurement region of the microfluidic chip: when a particle passes through the measurement region it interacts with the laser, causing a peak in the signal measured by the detector. The frequency of particles passing through the counter is used to quantify sedimentation
Fig. 4
Fig. 4
Sedimentation model validation. a Concentration half-life t1/2 versus terminal velocity vT. Red downward triangles represent FEM simulations, blue upward triangles represent experimental data on polymeric particles. Error bars represent standard deviation (n = 3). The dashed line represents the best fit using Eq. 15, yielding KS=0.52 and R2 = 0.94. b Applicability of the sedimentation model to a biological target. The solid blue line represents the experimental sedimentation of mammalian cells (HBSMC), with the blue shaded area representing 95% confidence intervals (n = 3). The gray shaded area represents the range predicted by Eq. 15
Fig. 5
Fig. 5
Effects of flow-rate on concentration half-life t1/2. In both plots, the shaded gray area represents mode predicted range according to Eq. 15. a Simulation and experimental data at increasing flow-rate. Red downward triangles represent FEM simulations, and blue upward triangles represent experimental data on polymeric particles. Errorbars represent standard error of the mean (n = 3). The model is used to compute the sedimentation constant, which is reported on the right y-axis. b Experimental sedimentation of polymeric particles at increasing flow-rate (blue line Q = 10 μl/min, red line Q = 20 μl/min, purple line Q = 50 μl/min)
Fig. 6
Fig. 6
Simulated effects of syringe geometry on concentration half-life t1/2. a Effects of syringe radius on sedimentation dynamics of particles (ρP = 1.07, 1.05, and 1.03 g/cm3, rP = 5 µm). b Effects of syringe outlet position on sedimentation dynamics of particles (ρP=1.07 g/cm3, rP= 5 µm). c Comparison of sedimentation dynamics of particles (rP= 5 µm, ρP=1.07 g/cm3) in syringes with standard geometry (G1, a concentric syringe with RS=1.15 mm corresponding to a 250 µl syringe) and an optimized syringe (G2, an eccentric syringe with RS=3.6 mm corresponding to a 2.5 ml syringe)

References

    1. Aghel M, Fardindoost S, Tasnim N, Hoorfar M (2024) A droplet- based microfluidic impedance flow cytometer for detection of micropollutants in water. Environments. 10.3390/environments11050096
    1. Barabé B, Abakumov S, Gunes DZ, Lettinga MP (2020) Sedimentation of large particles in a suspension of colloidal rods. Phys Fluids, Doi 10(1063/5):0006076
    1. Bhattacharyya A, Janarthanan G, Tran HN, Ham HJ, Yoon J, Noh I (2021) Bioink homogeneity control during 3D bioprinting of multicomponent micro/nanocomposite hydrogel for even tissue regeneration using novel twin screw extrusion system. Chem Eng J. 10.1016/j.cej.2021.128971
    1. Cetoni (2024) Nemix 50 syringe stirrer for homogeneous mixing inside the syringe. https://cetoni.com/nemix-50. Accessed 05 Dec 2024
    1. Cho EC, Zhang Q, Xia Y (2011) The effect of sedimentation and diffusion on cellular uptake of gold nanoparticles. Nat Nanotechnol. 10.1038/nnano.2011.58 - PMC - PubMed

LinkOut - more resources