. 2025 Apr 3:13:1498902.
doi: 10.3389/fcell.2025.1498902. eCollection 2025.

Rab11b is necessary for mitochondrial integrity and function in gut epithelial cells

Affiliations

Rab11b is necessary for mitochondrial integrity and function in gut epithelial cells

Ivor Joseph et al. Front Cell Dev Biol. .

Abstract

Introduction: The RAB11 family of small GTPases are intracellular regulators of membrane and vesicular trafficking. We recently reported that RAB11A and RAB11B redundantly regulate spindle dynamics in dividing gut epithelial cells. However, in contrast to the well-studied RAB11A functions in transporting proteins and lipids through recycling endosomes, the distinct function of RAB11B is less clear.

Methods and results: Our proteomic analysis of RAB11A or RAB11B interactome suggested a potential RAB11B specific involvement in regulating mitochondrial functions. Transcriptomic analysis of Rab11b knockout mouse intestines revealed an enhanced mitochondrial protein targeting program with an altered mitochondrial functional integrity. Flow cytometry assessment of mitochondrial membrane potential and reactive oxygen species production revealed an impaired mitochondrial function in vivo. Electron microscopic analysis demonstrated a particularly severe mitochondrial membrane defect in Paneth cells.

Conclusion: These genetic and functional data link RAB11B to mitochondrial structural and functional maintenance for the first time.

Keywords: Paneth cell; Rab11; intestine; mitochondria; proteomics.


Conflict of interest statement

The authors declare that the research was conducted in the absence of any commercial or financial relationships that could be construed as a potential conflict of interest.

Figures
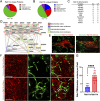
FIGURE 1
FIGURE 1
(A, B) Proteomic analysis of RAB11A and RAB11B unique proteins classified into different cellular compartments: Nucleus, Cytosol, Plasma Membrane, Golgi Apparatus, and Extracellular Matrix. (C) The top 10 RAB11B mitochondrial-related proteins ranked by number of spectrum counts (SC) from high to low. Unique peptide (UP) numbers are also provided for each target. (D) STRING network analysis of Rab11b co-precipitated mitochondrial-related proteins, categorized by their localization within mitochondrial substructures, including the matrix, outer membrane, intermembrane space, and inner membrane. (E, F) Live cell imaging of HEK293T cells transfected with mCherry-tagged wild-type Rab11a and Rab11b. White arrows indicate points of contact between Rab11 and mitochondria. Scale bar: 10 μm in E; 1 μm in F. (G) Quantification of RAB11 and mitochondrial contacts per field in cells expressing mCherry-tagged RAB11A or RAB11B. The data points represent 18 and 24 individual fields from 3 independent experiments.
FIGURE 2
FIGURE 2
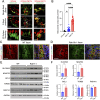
(A) Live cell imaging of Caco2 BBE cells transfected with mCherry, mCherry-tagged wild-type Rab11a or Rab11b. White arrows indicate points of contact between Rab11 and mitochondria. Scale bar: 2 μm. (B) Quantification of mCherry and mitochondrial contacts per field in cells. Data points represent 15 fields each condition from 3 independent experiments. (C–D) Immunofluorescence staining of WT and Rab11b KO ileum tissues, showing Tom20 (red), E-cadherin (green), and DAPI (blue). White and red boxes indicate transit amplifying and crypt regions, respectively. White dotted lines indicate the luminal (apical) surface. Scale bar: 50 μm. (E) Western blot analysis of specific mitochondrial proteins in WT and Rab11b intestinal tissues. (F) Quantification of Western blots.
FIGURE 3
FIGURE 3
(A) Gene Set Enrichment Analysis (GSEA) of bulk RNA sequencing data targeting the glucose metabolic process transcriptome, comparing WT and BKO mice. P‐value <0.001 (n = 3 mice per genotype). (B) Heat map displaying the expression of glucose metabolic process pathway genes in WT and RAB11BKO intestinal transcriptomes. P‐value <0.001 (n = 3 per genotype). (C, D) Relative RNA abundance of glucose metabolic process genes, Ppp1r3e and Pfkfb2. P‐value <0.001 (n = 3 mice per genotype). (E) GSEA of the superoxide metabolic process transcriptome in WT and BKO intestinal samples. P‐value <0.001 (n = 3 per genotype). (F) Heat map showing superoxide metabolic process genes in WT and RAB11BKO intestinal transcriptomes P‐value < 0.001 (n = 3 per genotype). (G–I) Relative RNA abundance of Nox1, CD177, and Nos3 in WT and RAB11BKO intestinal samples P‐value < 0.001 (n = 3 per genotype). (J) GSEA of the “Regulation of Protein Targeting to Mitochondrion” transcriptome comparing WT and RAB11BKO. P‐value <0.001 (n = 3 per genotype) (K) Heat map showing RNA expression levels of key genes involved in protein targeting to mitochondria in WT and RAB11BKO intestinal transcriptomes (n = 3 per genotype) P‐value < 0.001 (n = 3 per genotype). (L) Relative RNA abundance of Rhou in WT and RAB11b KO tissues. P‐value <0.001 (n = 3 per genotype).
FIGURE 4
FIGURE 4
(A) Total epithelial single cells isolated from WT and Rab11b KO mice, gated using EpCam (x-axis) and Live/Dead (y-axis) markers. (B) Flow cytometric analysis of live epithelial cells stained with MitoTracker Green and MitoSOX Red, divided into four quadrants. WT (blue) and Rab11b KO (red) cells are shown. (C) Quantification of the percentage of cells in each quadrant (Q1-Q4) for WT and Rab11b KO samples. (D) Representative electron microscopy images of WT mitochondria showing intact cristae and regular structure. Scale bars: 1 μm. (E) Electron microscopy images of Rab11b KO mitochondria displaying abnormal morphology, including swelling and loss of cristae integrity. Arrowheads point to discontinued outer membrane. Red arrows point to potential autophagic vesicles and mitophagy events. Scale bars: 1 μm. (F) Representative electron microscopy images showing the progression of mitochondrial damage, graded from normal to Grade 3, with increasing disruption. Scale bars: 0.5 μm. (G) Quantitative analysis of mitochondrial grading, comparing the percentage distribution of normal and damaged mitochondria between WT and Rab11b KO cells. Data represent 50–70 microscopic images from 3 independent samples per genotype.
FIGURE 5
FIGURE 5
(A) Gating strategy for identifying Paneth cells, non-Paneth cells, and enteroendocrine cells (EECs) based on side scatter (SSC-A) and CD24 expression. (B) Flow cytometry contour plots showing MitoTracker Orange intensity in Paneth cells from WT (blue) and BKO (red) mice. (C, D) Quantification of MitoTracker Orange and mean fluorescence intensity (MFI) of MitoSOX in non-Paneth cells, Paneth cells, and EECs. (E, F) Mitochondrial morphology grading in Paneth cells and stem cells illustrates normal and damaged mitochondria distribution in WT and BKO samples. (G) Representative electron microscopy images show mitochondria’s morphological differences between WT and BKO Paneth cells. (H) Comparison of mitochondrial structure in non-Paneth cells and enteroendocrine cells (EECs) between WT and BKO mice. Data represent 50–70 microscopic images from 3 independent mouse tissue samples per genotype.

References

    1. Alto N. M., Soderling J., Scott J. D. (2002). Rab32 is an A-kinase anchoring protein and participates in mitochondrial dynamics. J. Cell Biol. 158, 659–668. 10.1083/jcb.200204081 - DOI - PMC - PubMed
    1. Balasubramanian I., Bandyopadhyay S., Flores J., Bianchi-Smak J., Lin X., Liu H., et al. (2023). Infection and inflammation stimulate expansion of a CD74(+) Paneth cell subset to regulate disease progression. EMBO J. 42, e113975. 10.15252/embj.2023113975 - DOI - PMC - PubMed
    1. Berger H. A., Anderson M. P., Gregory R. J., Thompson S., Howard P. W., Maurer R. A., et al. (1991). Identification and regulation of the cystic fibrosis transmembrane conductance regulator-generated chloride channel. J. Clin. Invest 88, 1422–1431. 10.1172/JCI115450 - DOI - PMC - PubMed
    1. Best J. M., Foell J. D., Buss C. R., Delisle B. P., Balijepalli R. C., January C. T., et al. (2011). Small GTPase Rab11b regulates degradation of surface membrane L-type Cav1.2 channels. Am. J. physiology Cell physiology 300, C1023–C1033. 10.1152/ajpcell.00288.2010 - DOI - PMC - PubMed
    1. Bhartur S. G., Calhoun B. C., Woodrum J., Kurkjian J., Iyer S., Lai F., et al. (2000). Genomic structure of murine Rab11 family members. Biochem. Biophys. Res. Commun. 269, 611–617. 10.1006/bbrc.2000.2334 - DOI - PubMed

LinkOut - more resources