. 2025 Apr 1:43:100721.
doi: 10.1016/j.pacs.2025.100721. eCollection 2025 Jun.

Dual-modality ultrasound/photoacoustic tomography for mapping tissue oxygen saturation distribution in intestinal strangulation

Affiliations

Dual-modality ultrasound/photoacoustic tomography for mapping tissue oxygen saturation distribution in intestinal strangulation

Jie Zhou et al. Photoacoustics. .

Abstract

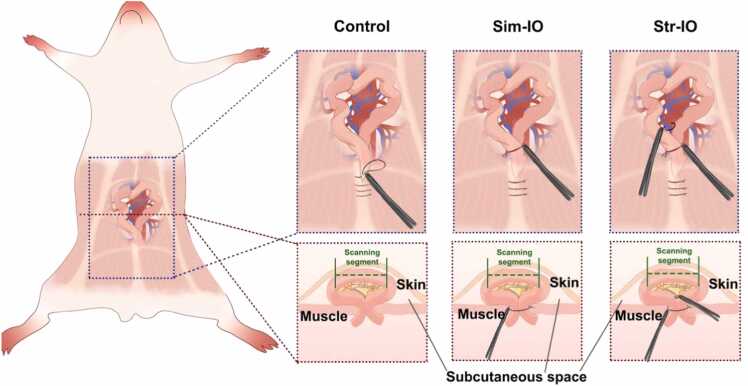
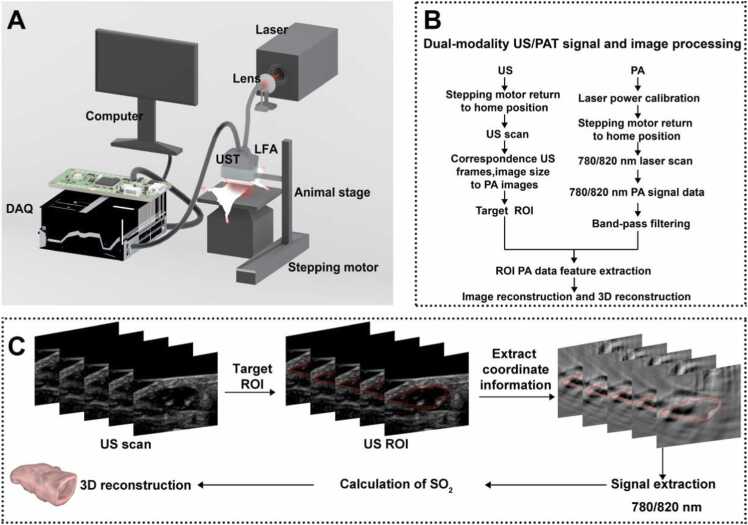
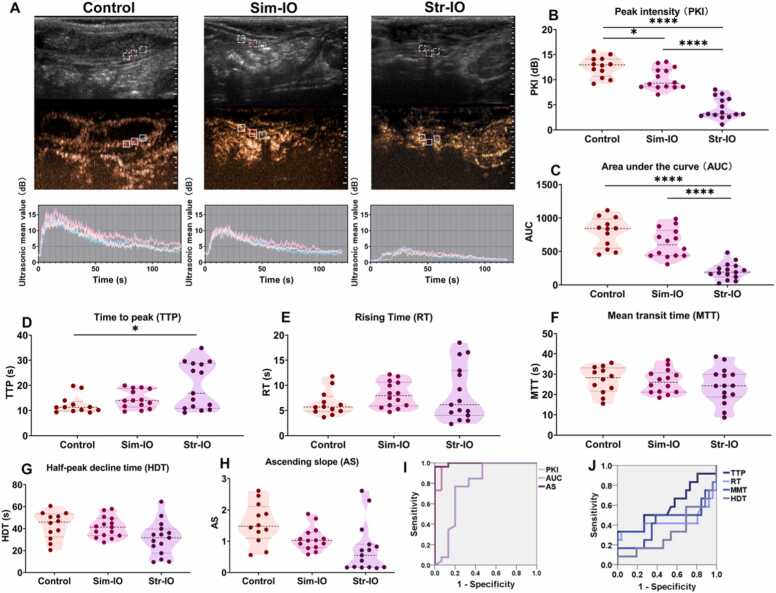
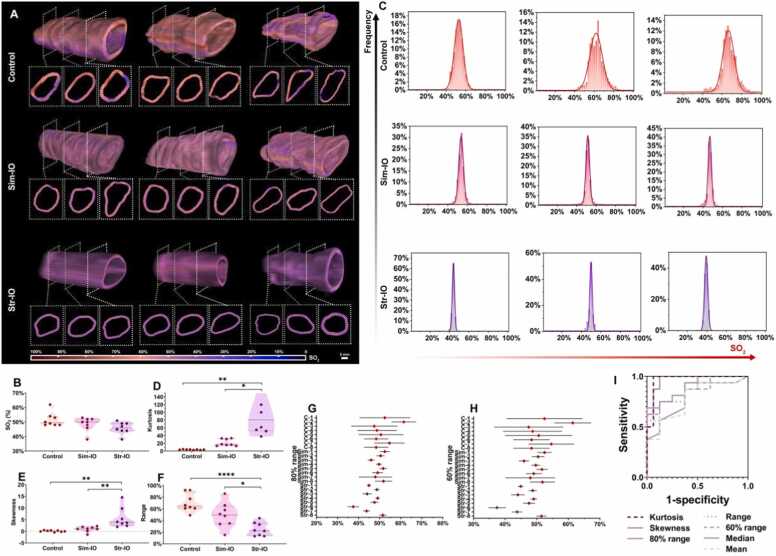
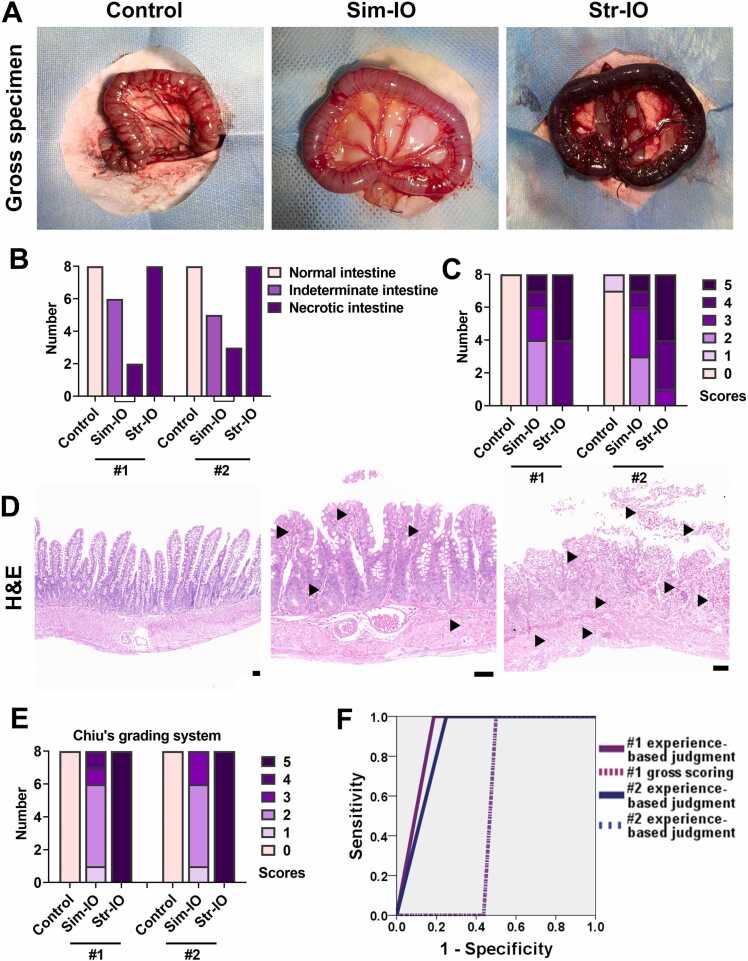
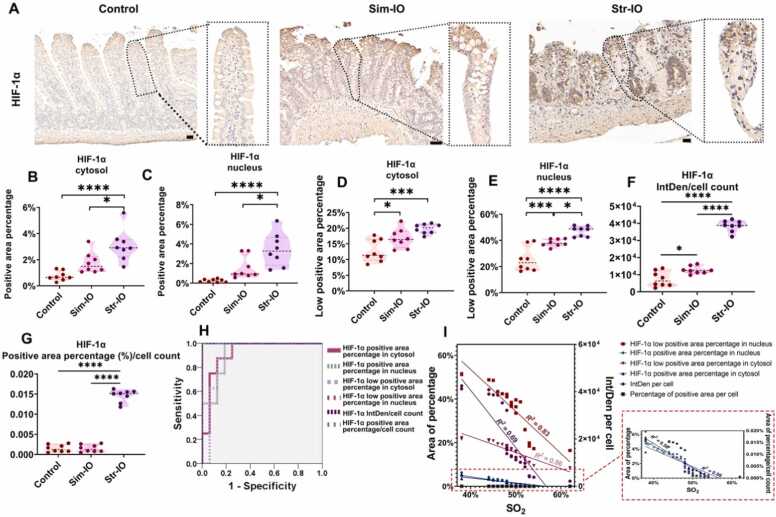
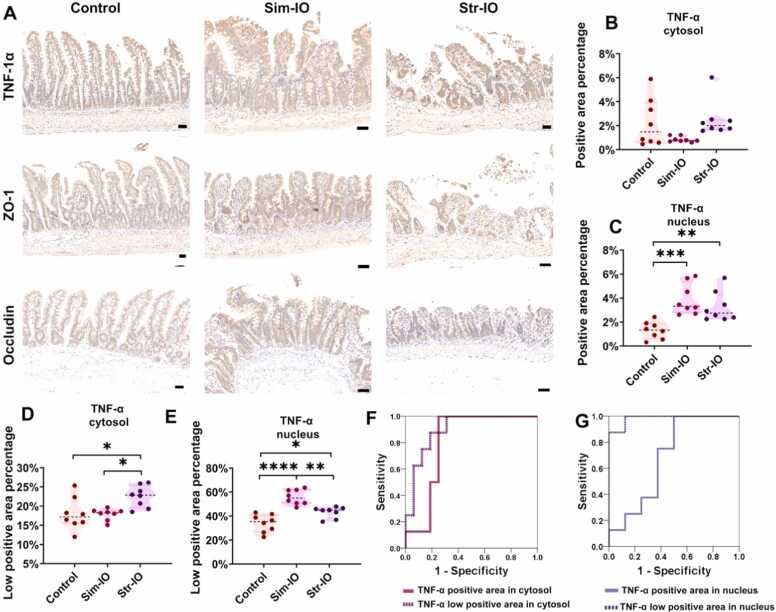
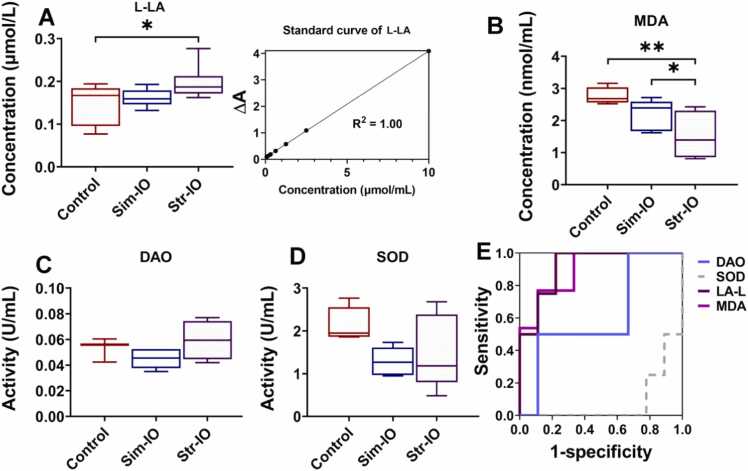
The strangulation of intestinal obstruction (IO) presents challenges in the assessment of disease progression and surgical decision-making. Intraoperatively, an accurate evaluation of the status of the IO is critical for determining the extent of surgical resection. Dual-modality ultrasound/photoacoustic tomography (US/PAT) imaging has the potential to provide spatially resolved tissue oxygen saturation (SO₂), serving as a valuable marker for IO diagnosis. In this study, US/PAT was utilized for imaging rat models of IO, with the data used for reconstruction, statistical analysis, and distribution evaluation. Results showed that SO₂ decreased with increasing strangulation severity. Notably, the kurtosis and skewness of the SO₂ distribution outperformed SO₂ itself in diagnosis, as they more effectively capture the heterogeneity of SO₂ distribution. Kurtosis reflects distribution concentration, while skewness measures asymmetry, both achieving areas under the receiver operating characteristic curve (AUROC) of 0.969. In conclusion, US/PAT offers a rapid and convenient method for assessing strangulation in IO.

Keywords: Dual-modality ultrasound/photoacoustic tomography imaging; Oxygen saturation; Photoacoustic tomography; Simple intestinal obstruction; Strangulated intestinal obstruction.


Conflict of interest statement

The authors declare that they have no known competing financial interests or personal relationships that could have appeared to influence the work reported in this paper

Figures

Fig. 1
Fig. 1
Schematic diagram of the photoacoustic imaging principles.
Fig. 2
Fig. 2
Schematic diagram of rat IO models: control (sham operation group), simple intestinal obstruction (Sim-IO), and strangulated intestinal obstruction (Str-IO) groups. Note: The green dashed line represents the region for scanning and imaging of the dual-modality US/PAT imaging.
Fig. 3
Fig. 3
Illustration and significance of CEUS characteristic parameters. (A) Schematic representation of CEUS characteristic parameters, with corresponding abbreviations listed in the table below. (B) Significance of CEUS characteristic parameters.
Fig. 4
Fig. 4
Schematic diagram of the dual-modality US/PAT system and data processing. (A) Schematic of the dual-modality US/PAT imaging system. (B) Workflow of dual-modality US/PAT signal and image processing. (C) Process for 3D reconstruction. Note: UST, ultrasound transducer; LFA, linear fiber array; DAQ, Data Acquisition.
Fig. 5
Fig. 5
CEUS images and feature parameters for diagnosing strangulation. (A) CEUS images and corresponding time-intensity curves, with the ROI border colors matching the colors of the time-intensity curves below. The dashed lines on the right side of the ultrasound and CEUS images represent the scale, with 1 cm between long lines and 2 mm between short lines. CEUS feature parameters for the Control, Sim-IO, and Str-IO groups: (B) peak intensity (PKI), (C) area under the curve (AUC), (D) time to peak (TTP), (E) rising time (RT), (F) mean transit time (MTT), (G) half-peak decline time (HDT), (H) ascending slope (AS). ROC curves of CEUS feature parameters for diagnosing strangulation, using (I) PKI, AUC, and AS, (J) TTP, RT, MTT, and HDT. Data presented as mean ± SD. Each group consisted of five rats, with each rat assessed in triplicate, yielding a total of 15 data points. One rat in the Control group died during anesthesia, likely due to health issues or stress-related complications, reducing the data point to 12. Comparison among the three groups was conducted using ordinary one-way ANOVA, with post-hoc pairwise comparisons performed using Tukey's multiple comparisons test. *P < 0.05, * ** *P < 0.0001.
Fig. 6
Fig. 6
Dual-modality US/PAT images, distribution characteristics and diagnostic performance. (A) Three-dimensional dual-modality US/PAT images for the Control, Sim-IO, and Str-IO groups, each additionally presenting three cross-sectional views of the reconstructed segment. Each row represents three randomly selected samples. The white short bar represents a 5-mm scale marker. (B) SO2 of the Control, Sim-IO, and Str-IO groups. (C) Examples of the frequency distribution histograms of SO2 for the Control, Sim-IO, and Str-IO groups. (D) Kurtosis, (E) skewness and (F) range of SO2 distribution. (G) 80 % distribution range of SO2. (H) 60 % distribution range of SO2. (I) ROC curves of SO2 mean, median, skewness, kurtosis, range, 80 % range and 60 % range. The statistical analysis utilized the entire dataset, rather than being confined to the exhibited samples. The data present the mean ± SD (n = 8). Comparison among the three groups was performed using one-way ANOVA, with post-hoc pairwise comparisons conducted using Turkey's multiple comparisons test. *P < 0.05, * *P < 0.01, * ** *P < 0.0001. Note: In Fig. 6D, two Str-IO samples with kurtosis exceeding the mean plus two standard deviations were identified as outliers and removed from the analysis.
Fig. 7
Fig. 7
IO gross specimen and Chiu’s score analysis. (A) Gross specimen of Control, Sim-IO and Str-IO examples. (B) Surgeons experience-based judgment of the condition of strangulation of Control, Sim-IO and Str-IO. (C) Gross scoring by Surgeons. For detailed scoring criteria, please refer to Method 2.5. (D) Examples of H&E staining of Control, Sim-IO and Str-IO. The area indicated by the triangle was identified as the region of hemorrhage. (E) Chiu' grading system of Control, Sim-IO and Str-IO. Please refer to Method 2.5. (F) ROC curves of Surgeons experience-based judgment and gross scoring. The black bar representing the length of 50 μm.
Fig. 8
Fig. 8
Expression of HIF-1α by IHC staining and its correlation with strangulation. (A) HIF-1α staining and expression in Control, Sim-IO and Str-IO group. The magnified image of an individual villus is depicted in the dashed portion. (B) HIF-1α positive area percentage in cytosol, (C) HIF-1α positive area percentage in nucleus, (D) HIF-1α low positive area percentage in cytosol, (E) HIF-1α low positive area percentage in nucleus, (F) integrated density (IntDen) per cell of HIF-1α, (G) percentage of positive area per cell of HIF-1α of Control, Sim-IO and Str-IO group. (H) ROC curves of HIF-1α related parameters for diagnosing strangulation. (I) Relationship between HIF-1α expression and SO₂. The date present the mean ± SD (n = 8 per group). Comparison among the three groups was performed using one-way ANOVA, with post-hoc pairwise comparisons conducted using Turkey's multiple comparisons test. The black bar representing the length of 50 μm. *P < 0.05, * **P < 0.001, * ** *P < 0.0001.
Fig. 9
Fig. 9
Correlation analysis of strangulation with inflammation and intestinal barrier function. (A) Expression of TNF-α, ZO-1 and Occludin in Control, Sim-IO and Str-IO group. (B) TNF-α positive area percentage in cytosol, (C) TNF-α positive area percentage in nucleus, (D) TNF-α low positive area percentage in cytosol, (E) TNF-α low positive area percentage in nucleus, (F) ROC curves of TNF-α related parameters in cytosol for diagnosing strangulation. (G) ROC curves of TNF-α related parameters in nucleus for diagnosing strangulation. The date present the mean ± SD (n = 8). Comparison among the three groups was performed using one-way ANOVA, with post-hoc pairwise comparisons conducted using Turkey's multiple comparisons test. The black bar representing the length of 50 μm. *P < 0.05, * *P < 0.01, * **P < 0.001, * ** *P < 0.0001.
Fig. 10
Fig. 10
Molecular markers in Control, Sim-IO, and Str-IO groups and their diagnostic performance in strangulation. (A) Left: concentrations of L-LA in Control, Sim-IO, and Str-IO; Right: standard Curve of L-LA. (B) Concentrations of MDA, (C) DAO and (D) SOD in Control, Sim-IO, and Str-IO. (E) ROC curve of molecular markers in diagnosis strangulation. The date present the mean ± SD (n = 8). Comparison among the three groups was performed using one-way ANOVA, with post-hoc pairwise comparisons conducted using Turkey's multiple comparisons test. *P < 0.05.

Similar articles

References

    1. Proctor D.W., Goodall R., Borsky K., Salciccioli J.D., Marshall D.C., Mohamed A., et al. Trends in the mortality, incidence, and disability-adjusted life-years of intestinal obstruction and paralytic ileus: observational study of the Global Burden of Disease database. Br. J. Surg. 2023;110(12):1650–1654. doi: 10.1093/bjs/znad232. - DOI - PubMed
    1. Bizer L.S., Liebling R.W., Delany H.M., Gliedman M.L. Small bowel obstruction: the role of nonoperative treatment in simple intestinal obstruction and predictive criteria for strangulation obstruction. Surgery. 1981;89(4):407–413. - PubMed
    1. Paulson E.K., Thompson W.M. Review of small-bowel obstruction: the diagnosis and when to worry. Radiology. 2015;275(2):332–342. doi: 10.1148/radiol.15131519. - DOI - PubMed
    1. Girlich C., Jung E.M., Huber E., Ott C., Iesalnieks I., Schreyer A., et al. Comparison between preoperative quantitative assessment of bowel wall vascularization by contrast-enhanced ultrasound and operative macroscopic findings and results of histopathological scoring in Crohn's disease. Ultraschall Med. 2011;32(2):154–159. doi: 10.1055/s-0029-1245398. - DOI - PubMed
    1. Wang S., Zhao Y., Xu Y. Recent advances in applications of multimodal ultrasound-guided photoacoustic imaging technology. Vis. Comput. Ind. Biomed. Art. 2020;3(1):24. doi: 10.1186/s42492-020-00061-x. - DOI - PMC - PubMed

LinkOut - more resources