. 2025 Apr 16;7(1):e001026.
doi: 10.1136/bmjno-2025-001026. eCollection 2025.

Integrating TSPO-PET imaging with metabolomics for enhanced prognostic accuracy in multiple sclerosis

Affiliations

Integrating TSPO-PET imaging with metabolomics for enhanced prognostic accuracy in multiple sclerosis

Daniel E Radford-Smith et al. BMJ Neurol Open. .

Abstract

Background: Predicting disease progression in multiple sclerosis (MS) remains challenging. PET imaging with 18 kDa translocator protein (TSPO) radioligands can detect microglial and astrocyte activation beyond MRI-visible lesions, which has been shown to be highly predictive of disease progression. We previously demonstrated that nuclear magnetic resonance (NMR)-based metabolomics could accurately distinguish between relapsing-remitting (RRMS) and secondary progressive MS (SPMS). This study investigates whether combining TSPO imaging with metabolomics enhances predictive accuracy in a similar setting.

Methods: Blood samples were collected from 87 MS patients undergoing PET imaging with the TSPO-binding radioligand 11C-PK11195 in Finland. Patient disability was assessed using the expanded disability status scale (EDSS) at baseline and 1 year later. Serum metabolomics was performed to identify biomarkers associated with TSPO binding and disease progression.

Results: Greater TSPO availability in the normal-appearing white matter and perilesional regions correlated with higher EDSS. Serum metabolites glutamate (p=0.02), glutamine (p=0.006), and glucose (p=0.008), detected by NMR, effectively distinguished future progressors. These three metabolites alone predicted progression with the same accuracy as TSPO-PET imaging (AUC 0.78; p=0.0001), validated in an independent cohort. Combining serum metabolite data with PET imaging significantly improved predictive power, achieving an AUC of 0.98 (p<0.0001).

Conclusion: Measuring three specific serum metabolites is as effective as TSPO imaging in predicting MS progression. However, integrating TSPO imaging with serum metabolite analysis substantially enhances predictive accuracy. Given the simplicity and affordability of NMR analysis, this approach could lead to more personalised, accessible treatment strategies and serve as a valuable tool for clinical trial stratification.

Keywords: MULTIPLE SCLEROSIS; PET.


Conflict of interest statement

No, there are no competing interests.

Figures
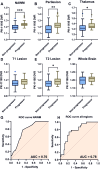
Figure 1
Figure 1. Extralesional 11C-PK11195 DVR is higher in multiple sclerosis patients with increased EDSS scores. DVR values for (A) the NAWM, (B) perilesional tissue, (C) thalamus and (E) T2 lesions were greater in progressors (ΔEDSS within 1 year of sampling, n=23), compared with non-progressors (n=52). No differences were observed in (D) the T1 lesion or (F) whole brain. (G) ROC curve analysis showed that NAWM DVR could distinguish between progressors and non-progressors, similarly to (H) the multi-region model. *p<0.05, **p<0.01 ***p<0.001. DVR, distribution volume ratio; EDSS, expanded disability status scale; NAWM, normal-appearing white matter.
Figure 2
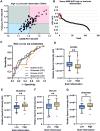
Figure 2. Selected serum metabolites vary with brain inflammation levels classified by 11C-PK11195 DVR. (A) Patients with high (n=39) and low (n=33) brain inflammation were classified by plotting NAWM DVR against perilesional DVR. Serum samples were measured by NMR and analysed using ROC curves and Student’s t-test. (B and C) Acetate, glutamate, glucose and glutamine showed moderate discriminatory capacity between high and low brain inflammation. (D) Acetate levels were lower in high inflammation (p=0.0099), while (E) glutamine (p=0.0064), (F) glucose (p=0.0076), and (G) glutamate (p=0.024) levels were increased. *p<0.05, **p<0.01, ****p<0.0001. DVR, distribution volume ratio; NAWM, normal-appearing white matter; NMR, nuclear magnetic resonance.
Figure 3
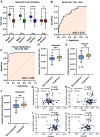
Figure 3. Serum glutamate, glucose and glutamine, but not acetate, independently predict disease progression. (A) Cross-validated accuracy of glutamate, glucose, glutamine and acetate, to predict progression, (B) combined metabolite model ROC AUC, (C) combined metabolite model ROC AUC with 11C-PK11195 DVR data. (D) Serum glutamate, (E) glucose, and (F) glutamine levels in progressors and non-progressors. Pearson correlations between baseline EDSS and serum (G) acetate, (H) glucose, (I) glutamine, and (J) glutamate. **p<0.01, ***p<0.001, ****p<0.0001. DVR, distribution volume ratio; EDSS, expanded disability status scale.
Figure 4
Figure 4. Serum metabolites predict disease progression in an independent cohort (SMSC). Serum (A) glutamine, (B) glutamate, and (C) glucose levels in progressors (n=12) and non-progressors (n=25). (D) ROC AUC of logistic regression for individual metabolites: glutamate, glutamine, and glucose. (E) Combined metabolite model ROC AUC, (F) combined metabolite model ROC AUC including MRI data - T2 lesion number. *p<0.05, **p<0.01.

References

    1. Nylund M, Sucksdorff M, Matilainen M, et al. Phenotyping of multiple sclerosis lesions according to innate immune cell activation using 18 kDa translocator protein-PET. Brain Commun. 2022;4:fcab301. doi: 10.1093/braincomms/fcab301. - DOI - PMC - PubMed
    1. Rissanen E, Tuisku J, Rokka J, et al. In Vivo Detection of Diffuse Inflammation in Secondary Progressive Multiple Sclerosis Using PET Imaging and the Radioligand ¹¹C-PK11195. J Nucl Med. 2014;55:939–44. doi: 10.2967/jnumed.113.131698. - DOI - PubMed
    1. Sucksdorff M, Matilainen M, Tuisku J, et al. Brain TSPO-PET predicts later disease progression independent of relapses in multiple sclerosis. Brain (Bacau) 2020;143:3318–30. doi: 10.1093/brain/awaa275. - DOI - PMC - PubMed
    1. Roodselaar J, Zhou Y, Leppert D, et al. Anti-CD20 Disrupts Meningeal B-Cell Aggregates in a Model of Secondary Progressive Multiple Sclerosis. Neurol Neuroimmunol Neuroinflamm. 2021;8:e975. doi: 10.1212/NXI.0000000000000975. - DOI - PMC - PubMed
    1. Cosenza-Nashat M, Zhao M-L, Suh H-S, et al. Expression of the translocator protein of 18 kDa by microglia, macrophages and astrocytes based on immunohistochemical localization in abnormal human brain. Neuropathol Appl Neurobiol. 2009;35:306–28. doi: 10.1111/j.1365-2990.2008.01006.x. - DOI - PMC - PubMed

LinkOut - more resources