

Variation in subsequent viral load testing and outcomes by visit type patterns in the first year of the COVID-19 pandemic at a large academic medical center in North Carolina
- PMID: 40248755
- PMCID: PMC12004300
- DOI: 10.21037/mhealth-24-69
Variation in subsequent viral load testing and outcomes by visit type patterns in the first year of the COVID-19 pandemic at a large academic medical center in North Carolina
Abstract
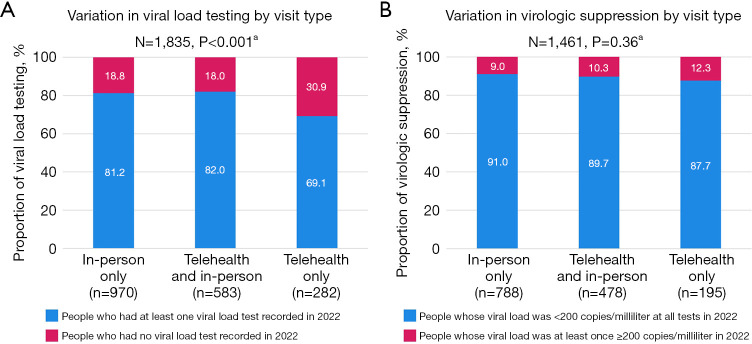
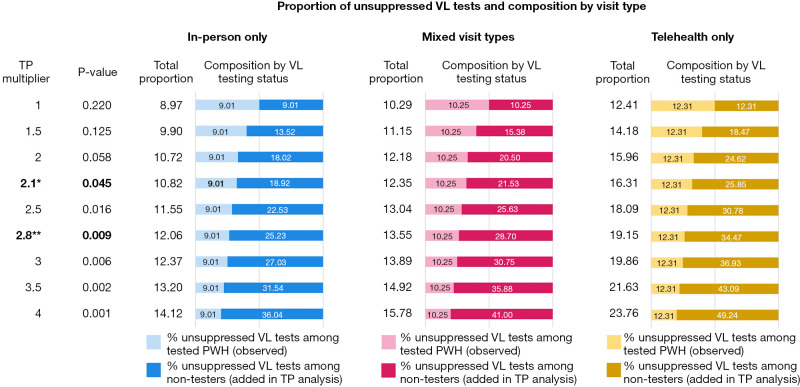
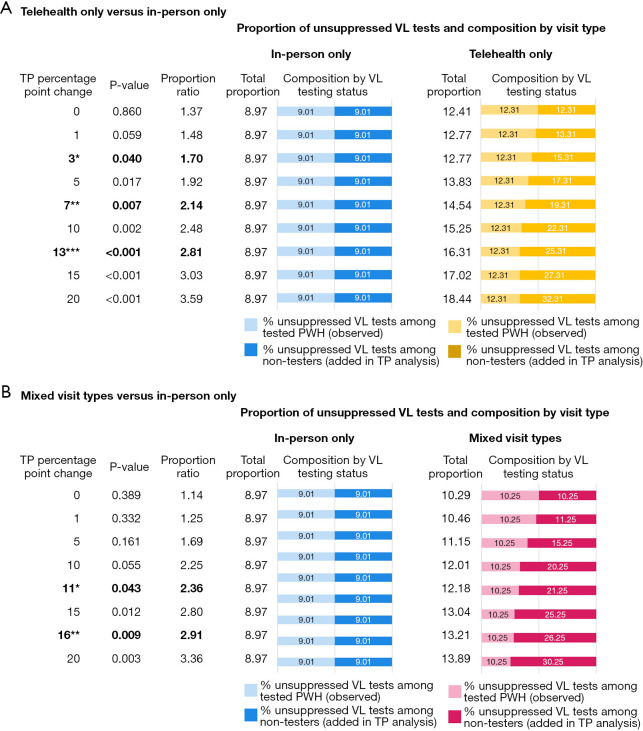
While telehealth was widely used to provide human immunodeficiency virus (HIV) care during the coronavirus disease 2019 (COVID-19) pandemic, research evaluating viral suppression by visit type is conflicting. This study assessed variation in viral load (VL) testing and outcomes by visit type for routine HIV care visits among people living with HIV (PWH) at a large academic health center in central North Carolina (NC). Electronic health records (EHRs) data from the Duke University Infectious Disease (ID) Clinic in NC were extracted in aggregated form. Pearson's Chi-square (χ2) tests were used to examine variation in VL testing and virologic suppression (VS) in 2022 by visit type patterns in the first year of the pandemic. Tipping point (TP) sensitivity analyses were conducted. EHR data from 1,835 PWH were included. Between March 16, 2020 and March 15, 2021, 53% of PWH received in-person HIV care only, 32% received a combination of telehealth and in-person care, and 15% received telehealth care only. About 20% of PWH did not have any VL test recorded in 2022. Among PWH with a VL test, 90% were virologically suppressed at all tests in 2022. Visit type was significantly associated with VL testing (P<0.001). The proportion of people who had no VL test in 2022 was larger among telehealth only users (31%) as compared to in-person only or PWH who received a combination (19% and 18%, respectively). VS in 2022 did not differ by visit type pattern in the first year of the pandemic (P=0.36) among PWH with a VL test in 2022. TP analyses identified that the proportion of unsuppressed VL tests among PWH without any VL test in 2022 would need to be multiplied by 2.1 to result in a statistically significant difference in VS by visit type (P=0.045). Our findings indicate that VL outcomes among telehealth users who had VL testing results documented in EHR at least one year later did not differ from in-person HIV care users. However, VL testing uptake was lower among telehealth only users suggesting the need for strategies such as remote VL testing to ensure regular VL testing among PWH who use telehealth HIV care.
Keywords: Human immunodeficiency virus care outcomes (HIV care outcomes); North Carolina (NC); coronavirus disease 2019 (COVID-19); electronic health records (EHRs); telehealth.
Copyright © 2025 AME Publishing Company. All rights reserved.
Conflict of interest statement
Conflicts of Interest: All authors have completed the ICMJE uniform disclosure form (available at https://mhealth.amegroups.com/article/view/10.21037/mhealth-24-69/coif). V.Y. received supports from the Agency for Healthcare Research and Quality (AHRQ) Grants for Health Services Research Dissertation Program (R36HS029267); the SPARC Graduate Research Program from the Office of the Vice President for Research at University of South Carolina (USC); and the NIH Ruth L. Kirschstein National Research Service Award (5T32AI007392) to present parts of the data presented in this manuscript at the CROI 2024 conference. This publication was made possible with regulatory help from the Duke University Center for AIDS Research (CFAR) and an NIH funded program (5P30AI064518). The other authors have no conflicts of interest to declare.
Figures
Similar articles
-
Telehealth and in-person HIV care during the COVID-19 pandemic at a large academic medical center in North Carolina.PLoS One. 2025 Jun 4;20(6):e0320911. doi: 10.1371/journal.pone.0320911. eCollection 2025. PLoS One. 2025. PMID: 40465553 Free PMC article.
-
Disparities in Telehealth Use in HIV Care During the COVID-19 Pandemic: Study Findings from South Carolina.Telemed J E Health. 2024 Jun;30(6):1594-1599. doi: 10.1089/tmj.2023.0383. Epub 2024 Feb 13. Telemed J E Health. 2024. PMID: 38350120 Free PMC article.
-
HIV care using differentiated service delivery during the COVID-19 pandemic: a nationwide cohort study in the US Department of Veterans Affairs.J Int AIDS Soc. 2021 Oct;24 Suppl 6(Suppl 6):e25810. doi: 10.1002/jia2.25810. J Int AIDS Soc. 2021. PMID: 34713585 Free PMC article.
-
Telehealth or in-person HIV care? Qualitative study findings on decision-making from people with HIV and HIV care providers in South Carolina during the COVID-19 pandemic.PLOS Digit Health. 2025 Apr 8;4(4):e0000812. doi: 10.1371/journal.pdig.0000812. eCollection 2025 Apr. PLOS Digit Health. 2025. PMID: 40198619 Free PMC article.
-
The Future of Telehealth in Human Immunodeficiency Virus Care: A Qualitative Study of Patient and Provider Perspectives in South Carolina.AIDS Patient Care STDS. 2023 Oct;37(10):459-468. doi: 10.1089/apc.2023.0176. AIDS Patient Care STDS. 2023. PMID: 37862076 Free PMC article.
References
-
- Dawson L, Kates J. Delivering HIV Care and Prevention in the COVID Era: A National Survey of Ryan White Providers. Kaiser Family Foundation; 2020. Available online: https://www.kff.org/report-section/delivering-hiv-care-prevention-in-the...
LinkOut - more resources
Full Text Sources