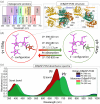
Nonlinear optical properties of photosensory core modules of monomeric and dimeric bacterial phytochromes
- PMID: 40248855
- PMCID: PMC12006755
- DOI: 10.1002/pro.70118
Nonlinear optical properties of photosensory core modules of monomeric and dimeric bacterial phytochromes
Abstract
Near-infrared (NIR) fluorescent proteins and optogenetic tools derived from bacterial phytochromes' photosensory core modules (PCMs) operate within the first (NIR-I) tissue transparency window under single-photon activation. Leveraging two-photon (2P) light in the second transparency window (NIR-II) for photoswitching bacterial phytochromes between Pr and Pfr absorption states offers significant advantages, including enhanced tissue penetration, spatial resolution, and signal-to-noise ratio. However, 2P photoconversion of bacterial phytochromes remains understudied. Here, we study the non-linear Pr to Pfr photoconversion's dependence on irradiation wavelength (1180-1360 nm) and energy fluence (41-339 mJ/cm2) for the PCM of DrBphP bacterial phytochrome. Our findings reveal substantially higher photoconversion efficiency for the engineered monomeric DrBphP-PCM (73%) compared to the natural dimeric DrBphP-PCM (57%). Molecular mechanical calculations, based on experimentally determined 2P absorption cross-section coefficients for the monomer (167 GM) and dimer (170 GM), further verify these results. We demonstrate both short- (SWE) and long-wavelength excitation (LWE) fluorescence of the Soret band using 405 and 810-890 nm laser sources, respectively. Under LWE, fluorescence emission (724 nm) exhibits saturation at a peak power density of 1.5 GW/cm2. For SWE, we observe linear degradation of fluorescence for both DrBphP-PCMs, decreasing by 32% as the temperature rises from 19 to 38°C. Conversely, under LWE, the monomeric DrBphP-PCM's brightness increases up to 182% (at 37°C), surpassing the dimeric form's fluorescence rise by 39%. These findings establish the monomeric DrBphP-PCM as a promising template for developing NIR imaging and optogenetic probes operating under the determined optimal parameters for its 2P photoconversion and LWE fluorescence.
Keywords: DrBphP; Near‐infrared fluorescent protein (iRFP); bacterial phytochrome; long‐wavelength excitation; two‐photon photoconversion.
© 2025 The Author(s). Protein Science published by Wiley Periodicals LLC on behalf of The Protein Society.
Conflict of interest statement
The authors declare no competing interests.
Figures


Similar articles
-
The Crystal Structures of the N-terminal Photosensory Core Module of Agrobacterium Phytochrome Agp1 as Parallel and Anti-parallel Dimers.J Biol Chem. 2016 Sep 23;291(39):20674-91. doi: 10.1074/jbc.M116.739136. Epub 2016 Jul 26. J Biol Chem. 2016. PMID: 27466363 Free PMC article.
-
Intersubunit distances in full-length, dimeric, bacterial phytochrome Agp1, as measured by pulsed electron-electron double resonance (PELDOR) between different spin label positions, remain unchanged upon photoconversion.J Biol Chem. 2017 May 5;292(18):7598-7606. doi: 10.1074/jbc.M116.761882. Epub 2017 Mar 13. J Biol Chem. 2017. PMID: 28289094 Free PMC article.
-
Dynamic inhomogeneity in the photodynamics of cyanobacterial phytochrome Cph1.Biochemistry. 2014 May 6;53(17):2818-26. doi: 10.1021/bi500108s. Epub 2014 Apr 21. Biochemistry. 2014. PMID: 24742290 Free PMC article.
-
Phytochromes from Agrobacterium fabrum.Photochem Photobiol. 2017 May;93(3):642-655. doi: 10.1111/php.12761. Photochem Photobiol. 2017. PMID: 28500698 Review.
-
Engineering of bacterial phytochromes for near-infrared imaging, sensing, and light-control in mammals.Chem Soc Rev. 2013 Apr 21;42(8):3441-52. doi: 10.1039/c3cs35458j. Epub 2013 Jan 29. Chem Soc Rev. 2013. PMID: 23361376 Free PMC article. Review.
References
-
- Auldridge ME, Forest KT. Bacterial phytochromes: more than meets the light. Crit Rev Biochem Mol Biol. 2011;46:67–88. - PubMed
MeSH terms
Substances
Grants and funding
LinkOut - more resources
Full Text Sources
Research Materials
Miscellaneous

