. 2025 May;18(5):e012293.
doi: 10.1161/CIRCHEARTFAILURE.124.012293. Epub 2025 Apr 18.

Ca2+ Cycling Alteration in a Porcine Model of Right Ventricular Dysfunction

Affiliations

Ca2+ Cycling Alteration in a Porcine Model of Right Ventricular Dysfunction

Fabrice Antigny et al. Circ Heart Fail. 2025 May.

Abstract

Background: Pulmonary hypertension is a severe disease with high mortality rates due to right ventricular (RV) failure. The molecular and cellular processes involved in RV remodeling, including Ca2+ handling, remain elusive due to the lack of relevant animal models. In this study, we aim to understand better the pathophysiological mechanisms involved in RV failure.

Methods: We used the chronic thromboembolic pulmonary hypertension (CTEPH) pig model, which leads to progressive RV hypertrophy and dysfunction. Cellular, molecular unbiased global transcriptional profiling and biochemical analyses were performed on RV cardiomyocytes from CTEPH and Sham-operated pigs.

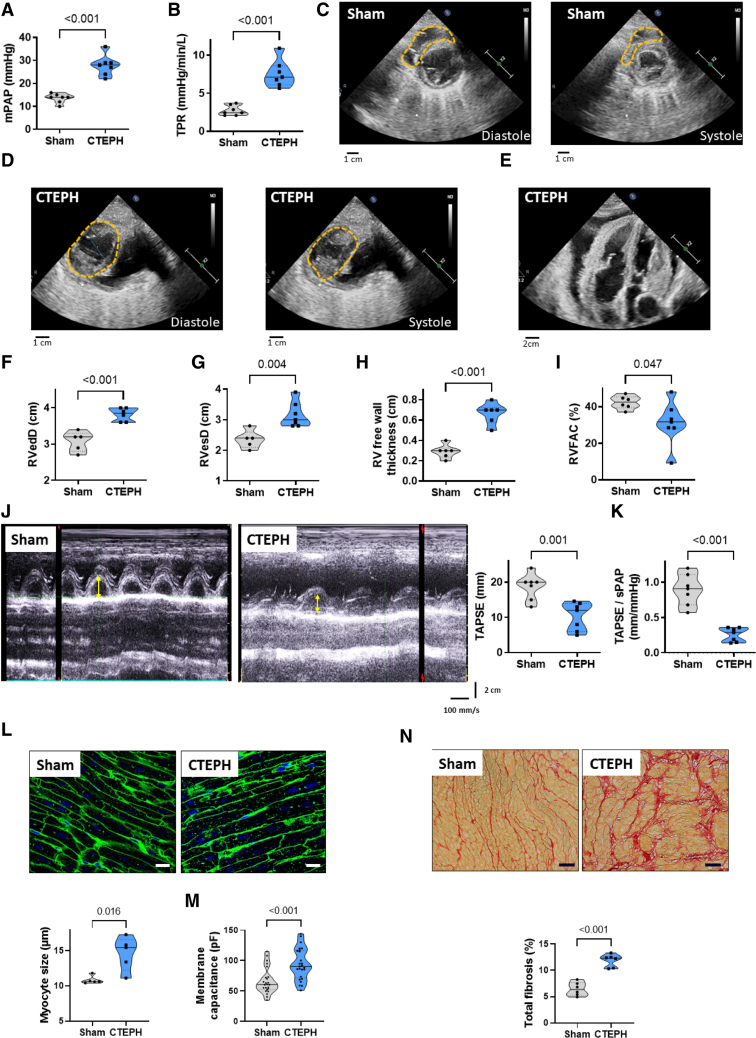
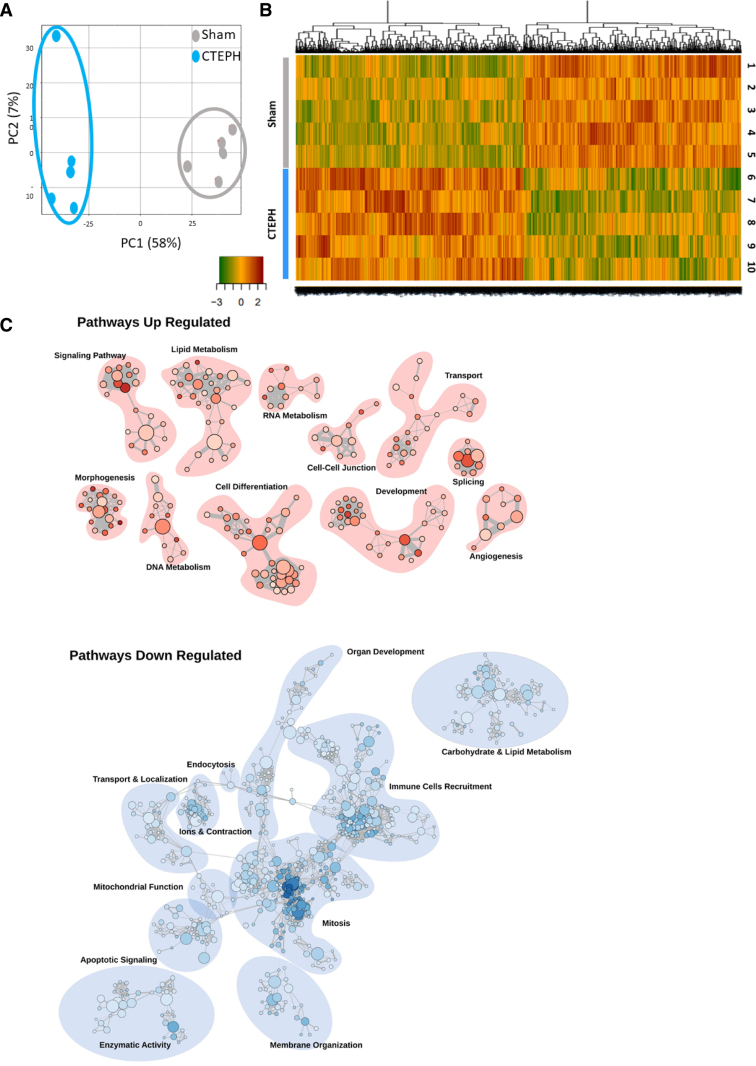
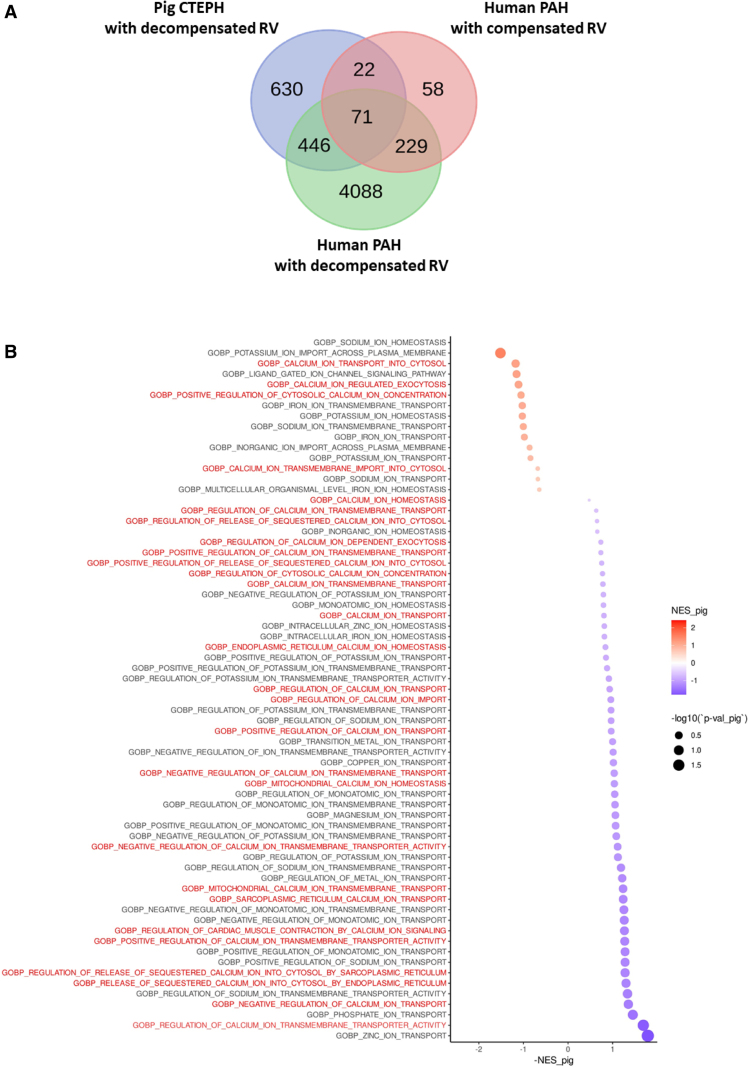
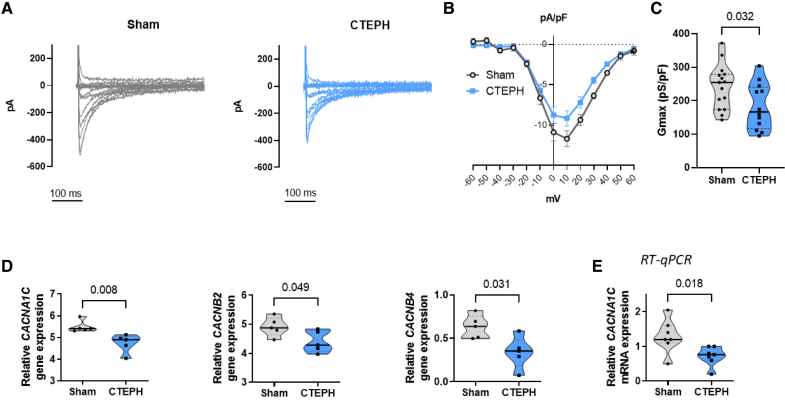
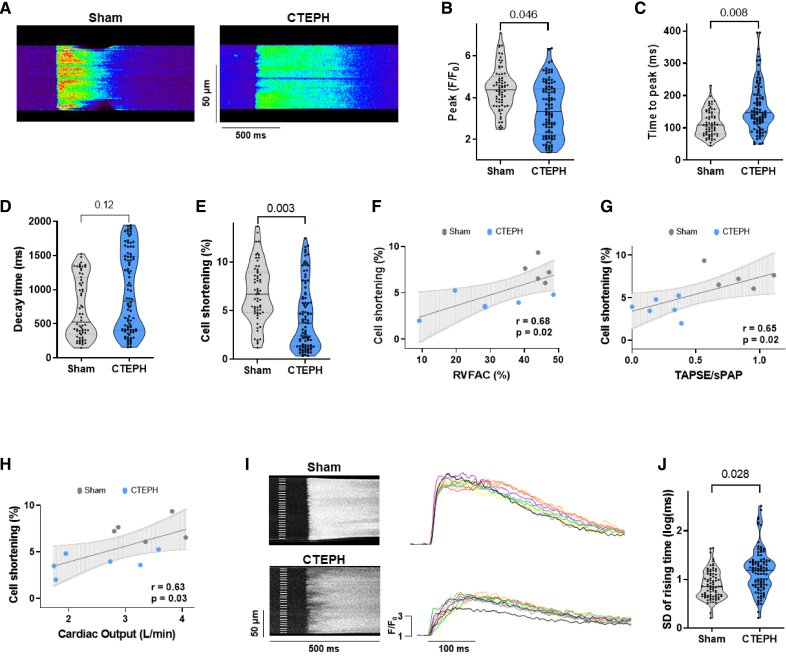
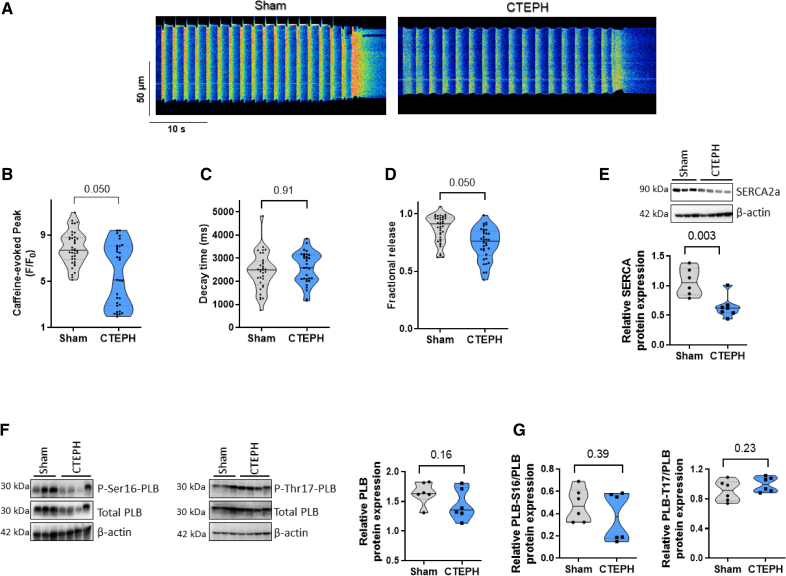
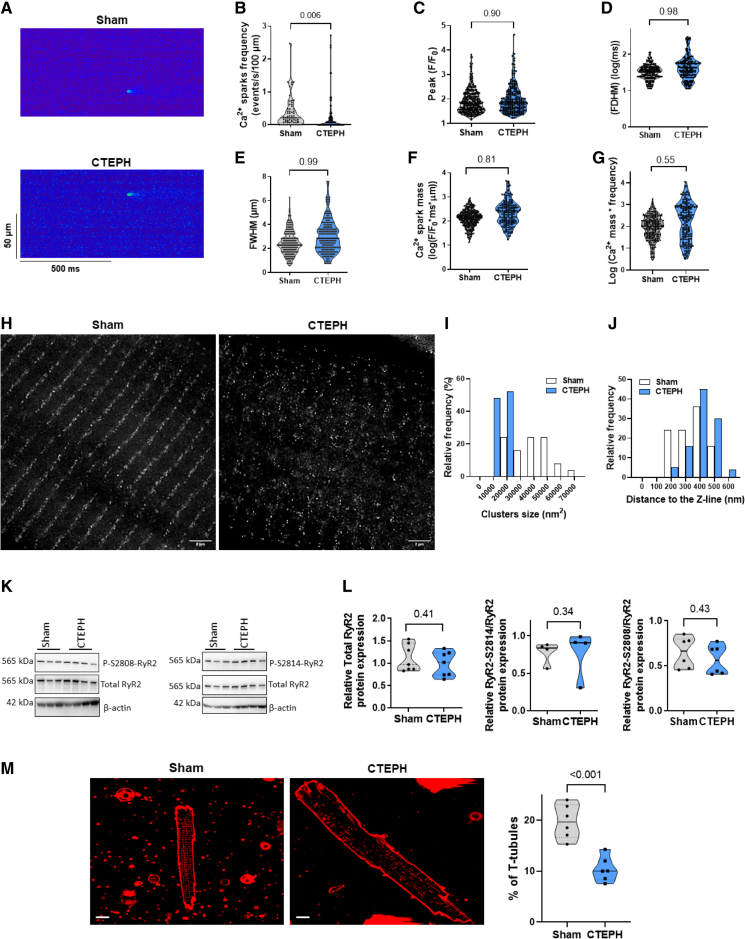
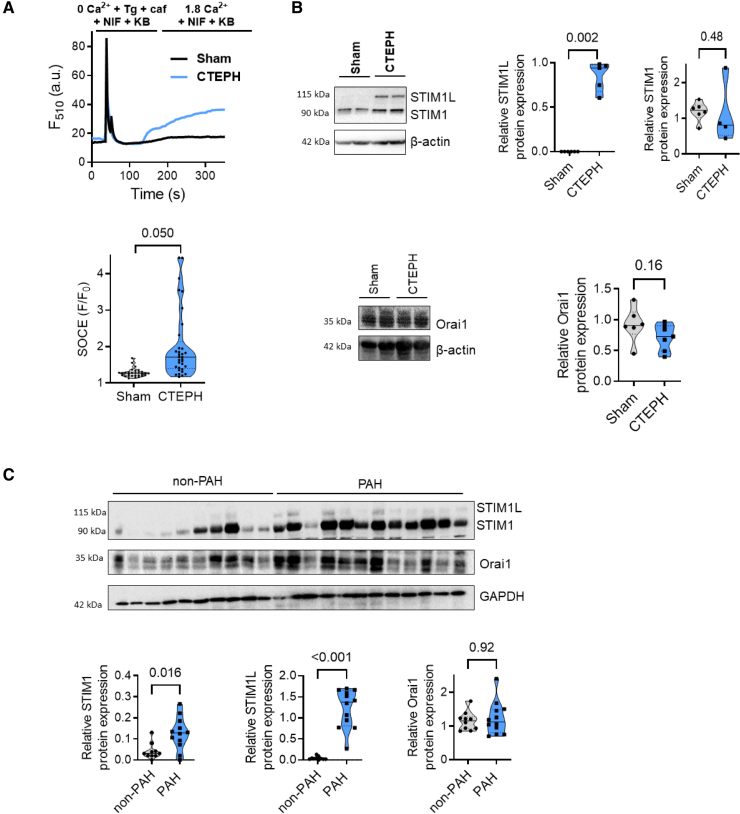
Results: CTEPH pigs replicated the hemodynamics and histological changes of human CTEPH features. Transcriptome analysis in Sham and CTEPH pigs revealed molecular RV remodeling close to human patients with pulmonary arterial hypertension with decompensated RV function and notably identified changes in genes involved in Ca2+ signaling. At the cellular level, CTEPH myocytes presented reduced L-type Ca2+ current in association with reduced mRNA of CACNA1C. Furthermore, CTEPH myocytes showed lower [Ca2+]i transients, decreased sarcoplasmic reticulum Ca2+ content, and decreased cell shortening, related to reduced SERCA2a (Sarco/endoplasmic reticulum Ca2+-ATPase isoform 2a) protein expression. Moreover, CTEPH cardiomyocytes exhibited reduced Ca2+ spark occurrence, which relied on smaller RyR2 (ryanodine receptor 2) clusters and T-tubule disorganization. Finally, these alterations in Ca2+ homeostasis were also associated with an increased store-operated Ca2+ entry and the de novo expression of the Ca2+ sensor protein STIM1L (stromal interaction molecule 1 long isoform) in CTEPH myocytes as well as in RV from human patients with pulmonary arterial hypertension.

Conclusions: Our data reveal cellular Ca2+ cycling remodeling that participates in the pathogenesis of RV dysfunction and may constitute therapeutic targets to limit the development of RV dysfunction.

Keywords: calcium signaling; excitation contraction coupling; humans; pulmonary hypertension; right-sided heart failure; swine.


Conflict of interest statement

Dr Humbert has relationships with drug companies, including Acceleron, AOP Orphan, Merck, Chiesi, Ferrer, Janssen, MorphogenIX, Shou Ti, Tiakis, and United Therapeutics. Dr Montani has relationships with drug companies, including Actelion, Bayer, GSK, Novartis, and Pfizer. Dr Jaïs has relationships with drug companies, including Janssen, Bayer, and Merck. In addition to being investigators in trials involving these companies, other relationships include consultancy services and memberships to scientific advisory boards. The other authors report no conflicts.

Figures

Figure 1.
Figure 1.
Characterization of right ventricular (RV) dysfunction and remodeling in chronic thromboembolic pulmonary hypertension (CTEPH) pigs. Quantification of mean pulmonary arterial pressure (mPAP, A), and total pulmonary resistance (TPR, B). Representative echocardiographic images from Sham (C) and CTEPH (D) pigs for diastolic and systolic measurement of RV diameters in the parasternal short-axis view, showing RV enlargement and deformation in CTEPH pigs (dotted orange lines). E, Representative echocardiographic images from CTEPH pigs in a 4-chamber view showing intraventricular septum deviation and pericardial effusion in CTEPH pigs. F through I, Quantification of RV end-diastolic (RVedD, F) and systolic diameters (RVesD, G), RV free wall thickness (H), and RV fractional area change (RVFAC, I). J, Representative echocardiographic images for the measurement of the tricuspid annular plane systolic excursion (TAPSE) in M-mode view of Sham and CTEPH pigs. Right, Quantification of the TAPSE. The yellow arrows correspond to the distance of the tricuspid annular longitudinal excursion between end-diastole and peak systole (mm). K, Quantification of TAPSE/systolic PAP ratio (n=7 pigs). L, Analysis of the level of RV cardiomyocyte hypertrophy in Sham and CTEPH pigs. Top, Representative confocal images of RV sections from Sham and CTEPH pigs stained with FITC-conjugated wheat germ agglutinin (WGA, 50 mg/mL). Bottom, Quantification of cardiomyocyte size (10 images per animal from 5 pigs; scale bar=20 µm). M, Membrane capacitance of RV cardiomyocytes from Sham and CTEPH pigs (n=24 cells for Sham and 25 cells for CTEPH from 5 pigs). N, Top, Representative confocal images of interstitial fibrosis identified with Sirius red staining in RV sections from Sham and CTEPH pigs. Bottom, Quantification of the percentage of fibrosis in RV sections from Sham and CTEPH pigs (n=10 images per pig from 6 pigs). Scale bar=50 µm. All the results are presented as violin plots showing all animals with the minimum to maximum, with the median (line), and with first and third quartiles (dotted lines). Specific procedure analysis and output for each figure panel are given in Table S2 and no outliers were eliminated.
Figure 2.
Figure 2.
Characterization of right ventricular (RV) molecular remodeling in chronic thromboembolic pulmonary hypertension (CTEPH) pigs in comparison with Sham pigs. A, Principal component analysis (PCA) was performed on the relative gene expression level between RV tissues from Sham and CTEPH pigs obtained by spectral counting (Sham [gray] or CTEPH [blue]; n=5 pigs). B, Heatmap Representation for RNA sequencing results in RV tissues from Sham and CTEPH pigs. C, Visualization of biological process gene ontology gene set enrichment analysis on the pig RNA sequencing (RNA-seq) data using the Cytoscape software. This visualization highlights the clusters of pathways upregulated (red) or downregulated (blue) involved in specific cellular functions such as ions and contraction or signalization.
Figure 3.
Figure 3.
Comparison of right ventricular (RV) transcriptome from chronic thromboembolic pulmonary hypertension (CTEPH) pigs and human patients with pulmonary arterial hypertension (PAH). A, Venn diagram showing the number of genes similarly dysregulated in pig CTEPH RV and human RV in a compensated or decompensated state. B, Pathways overview identified with reactome pathway analysis of the differentially expressed genes between RV tissues from Sham and CTEPH pigs. The red titles correspond to the Ca2+-dependent pathways that were dysregulated in CTEPH pigs.
Figure 4.
Figure 4.
Reduced ICaL in right ventricular (RV) cardiomyocytes from chronic thromboembolic pulmonary hypertension (CTEPH) pigs. A, Representative ICaL current traces in RV cardiomyocytes from Sham (gray traces) and CTEPH pigs (blue traces). B, Averaged current-voltage (ICaL–V) relationships of ICaL densities in freshly isolated RV cardiomyocytes from Sham and CTEPH pigs (n=15 cells for 4 Sham pigs and 12 cells for 4 CTEPH pigs). C, Quantification of maximum conductance (Gmax) of ICaL in freshly isolated RV cardiomyocytes from Sham and CTEPH pigs (n=15 cells for Sham and 12 cells for CTEPH from 3 pigs). D, Comparison of the relative gene expression of CACNA1C (Calcium Voltage-Gated Channel Subunit α1 C), CACNB2 (Calcium Voltage-Gated Channel Auxiliary Subunit β 2), and CACNB4 (Calcium Voltage-Gated Channel Auxiliary Subunit β 4) in RV from Sham and CTEPH pigs, obtained by RNA sequencing (n=5 pigs). E, Relative mRNA expression of CACNA1C obtained by RT-qPCR (n=7 pigs). All the results are presented as violin plots showing all investigated cells or animals or with the minimum to maximum, with the median (line), and with first and third quartiles (dotted lines). Specific procedure analysis and output for each figure panel are given in Table S2, and no outliers were eliminated.
Figure 5.
Figure 5.
Stimulated [Ca2+]i transients in right ventricular (RV) cardiomyocytes from Sham and chronic thromboembolic pulmonary hypertension (CTEPH) pigs. A, Representative line-scan of [Ca2+]i transients in RV cardiomyocytes field-stimulated at 0.5 Hz and loaded with Fluo-4/AM from Sham and CTEPH pigs. Average of [Ca2+]i transients amplitude (peak F/F0, B), of [Ca2+]i transients time to peak (ms, C) and decay time constant (ms, D), and of % of the cell shortening (E) obtained in RV myocytes field-stimulated at 0.5 Hz from Sham and CTEPH pigs (n=5–6 pigs, n=69–108 investigated cells). F, Correlation between percentage of cell shortening and RVFAC of corresponding pigs. G, Correlation between percentage of cell shortening and the tricuspid annular plane systolic excursion (TAPSE)/systolic PAP ratio of corresponding pigs. H, Correlation between percentage of cell shortening and cardiac output of corresponding pigs. I, Left, Representative line-scan images of inhomogeneous [Ca2+]i transients at steady-state stimulation in RV myocytes from Sham and CTEPH pigs with the corresponding superimposed traces (right) taken at every 5 µm subregion noted on the left of line-scan images. J, Ca2+ release heterogeneity was quantified by the SD of the rising time of the [Ca2+]i transients for Sham and CTEPH cardiomyocytes (n=5–6 pigs, n=81–99 investigated cells). All the results are presented as violin plots showing all investigated cells with the minimum to maximum, with the median (line), and with first and third quartiles (dotted lines). Specific procedure analysis and output for each figure panel are given in Table S2, and no outliers were eliminated.
Figure 6.
Figure 6.
Sarcoplasmic reticulum (SR) Ca2+ content in right ventricular (RV) cardiomyocytes from Sham and chronic thromboembolic pulmonary hypertension (CTEPH) pigs. A, Representative line-scan of caffeine-evoked [Ca2+]i transients in RV cardiomyocytes field-stimulated at 0.5 Hz and loaded with Fluo-4/AM from Sham and CTEPH pigs. Average of caffeine-evoked SR Ca2+ load amplitude (peak F/F0, B), caffeine-evoked SR Ca2+ load decay time constant (ms, C), and fractional release (D) recorded in RV cardiomyocytes from Sham and CTEPH pigs (n=4 pigs, n=31–39 investigated cells). E, Representative Western blot and quantification of SERCA2a (sarco/endoplasmic reticulum Ca2+-ATPase isoform 2a) protein expression in RV tissues from Sham and CTEPH pigs. β-Actin was used as the loading control (n=6–7 pigs). F and G, Representative Western blots and quantification of total phospholamban, P-Ser16-phospholamban, and P-Thr17-phospholamban normalized by the total phospholamban expression in RV tissues from Sham and CTEPH pigs (n=6 pigs). All the results are presented as violin plots showing all investigated cells or tissues with the minimum to maximum, with the median (line), and with first and third quartiles (dotted lines). Specific procedure analysis and output for each figure panel are given in Table S2, and no outliers were eliminated.
Figure 7.
Figure 7.
Intrinsic RyR2 (ryanodine receptor 2) cluster activity and structural organization in right ventricular (RV) cardiomyocytes from Sham and chronic thromboembolic pulmonary hypertension (CTEPH) pigs. A, Representative line-scan images of Ca2+ sparks in quiescent RV cardiomyocytes loaded with Fluo-4/AM from Sham and CTEPH pigs. B, Average of Ca2+ spark frequency (number of sparks/s/100 µm) recorded in 65 cells from Sham and 119 cells from CTEPH pigs. Average of Ca2+ spark amplitude (peak F/F0, C), full duration at half-maximum (FDHM, ms, D) and of full width at half-maximum (FWHM, µm, E) recorded in RV cardiomyocytes from Sham and CTEPH pigs (n=4–6 pigs, n=358–218 analyzed Ca2+ sparks). Average Ca2+ spark mass (F/F0*ms*µm, F) and Ca2+ spark-mediated SR Ca2+ leak (Ca2+ spark mass*frequency, G) in RV cardiomyocytes from Sham and CTEPH pigs. H, Representative deconvoluted stimulated emission depletion images of RyR2 in RV cardiomyocytes from Sham and CTEPH pigs (Scale bar=2 µm). I, Clusters size relative frequency distribution in Sham or CTEPH cells. J, Clusters relative frequency distribution along the Z line in Sham or CTEPH cells. White bars indicate 24 797 clusters in 26 cells from 3 Sham pigs, and blue bars indicates 71 302 clusters in 56 cells from 2 CTEPH pigs. K and L, Representative Western blots and quantification of total RyR2, P-S2808-RyR2, and P-S2814-RyR2 normalized by the total RyR2 expression in RV tissues from Sham and CTEPH pigs (n=4–7 pigs). M, Left, Confocal images of the T-tubule network stained by Di-4ANEPPS in RV cardiomyocytes from Sham and CTEPH pigs (scale bar=10 µm). Right, Percentage of T-tubules under the cell surface in RV cardiomyocytes from Sham and CTEPH pigs (n=6 pigs). All the results are presented as violin plots showing all investigated cells or tissues with the minimum to maximum, with the median (line), and with first and third quartiles (dotted lines). Specific procedure analysis and output for each figure panel are given in Table S2, and no outliers were eliminated.
Figure 8.
Figure 8.
Store-operated Ca2+ entry (SOCE) machinery in right ventricular (RV) cardiomyocytes from Sham and chronic thromboembolic pulmonary hypertension (CTEPH) pigs. A, Top, Representative traces of fluorescence variation in Fluo-4/AM-loaded RV cardiomyocytes. Cells were exposed to 5 μmol/L Tg+20 mmol/L caf in the presence of 10 μmol/L nifedipine (NIF) and 2 µmol/L KB-R7943 (KB) in Ca2+-free medium, then to 1.8 mmol/L Ca2+-containing solution to evaluate the SOCE in the presence of NIF and KB. Bottom, Quantitative assessment of SOCE amplitude (F/F0) in RV cardiomyocytes from Sham and CTEPH pigs (n=3 pigs, n=29–32 investigated cells). B, Representative Western blot and quantification of STIM1L (stromal interaction molecule 1 long isoform), STIM1, and Orai1 protein expression in RV tissues from Sham and CTEPH pigs. β-Actin was used as the loading control (n=5–6 pigs). C, Representative Western blot and quantification of STIM1L, STIM1, and Orai1 protein expression in RV tissues from control and patients with pulmonary arterial hypertension (PAH). β-Actin was used as the loading control. n=10 patients with non-PAH and 12 patients with PAH. Specific procedure analysis and output for each figure panel are given in Table S2, and no outliers were eliminated.

Similar articles

References

    1. Humbert M, Kovacs G, Hoeper MM, Badagliacca R, Berger RMF, Brida M, Carlsen J, Coats AJS, Escribano-Subias P, Ferrari P, et al. ; ESC/ERS Scientific Document Group. 2022 ESC/ERS Guidelines for the diagnosis and treatment of pulmonary hypertension. Eur Respir J. 2023;61:2200879. doi: 10.1183/13993003.00879-2022 - PubMed
    1. Vonk Noordegraaf A, Chin KM, Haddad F, Hassoun PM, Hemnes AR, Hopkins SR, Kawut SM, Langleben D, Lumens J, Naeije R. Pathophysiology of the right ventricle and of the pulmonary circulation in pulmonary hypertension: an update. Eur Respir J. 2019;53:1801900. doi: 10.1183/13993003.01900-2018 - PMC - PubMed
    1. Andersen S, Nielsen-Kudsk JE, Vonk Noordegraaf A, de Man FS. Right ventricular fibrosis. Circulation. 2019;139:269–285. doi: 10.1161/CIRCULATIONAHA.118.035326 - PubMed
    1. Llucià-Valldeperas A, de Man FS, Bogaard HJ. Adaptation and maladaptation of the right ventricle in pulmonary vascular diseases. Clin Chest Med. 2021;42:179–194. doi: 10.1016/j.ccm.2020.11.010 - PubMed
    1. Humbert M, Lau EMT, Montani D, Jaïs X, Sitbon O, Simonneau G. Advances in therapeutic interventions for patients with pulmonary arterial hypertension. Circulation. 2014;130:2189–2208. doi: 10.1161/CIRCULATIONAHA.114.006974 - PubMed

MeSH terms

Substances