. 2025 Apr 10;53(7):gkaf256.
doi: 10.1093/nar/gkaf256.

Nutrient starvation-induced Hda1C rewiring: coordinated regulation of transcription and translation

Affiliations

Nutrient starvation-induced Hda1C rewiring: coordinated regulation of transcription and translation

Min Kyung Lee et al. Nucleic Acids Res. .

Abstract

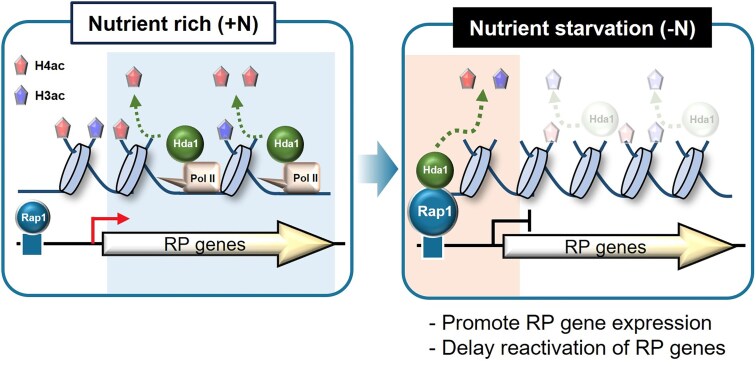
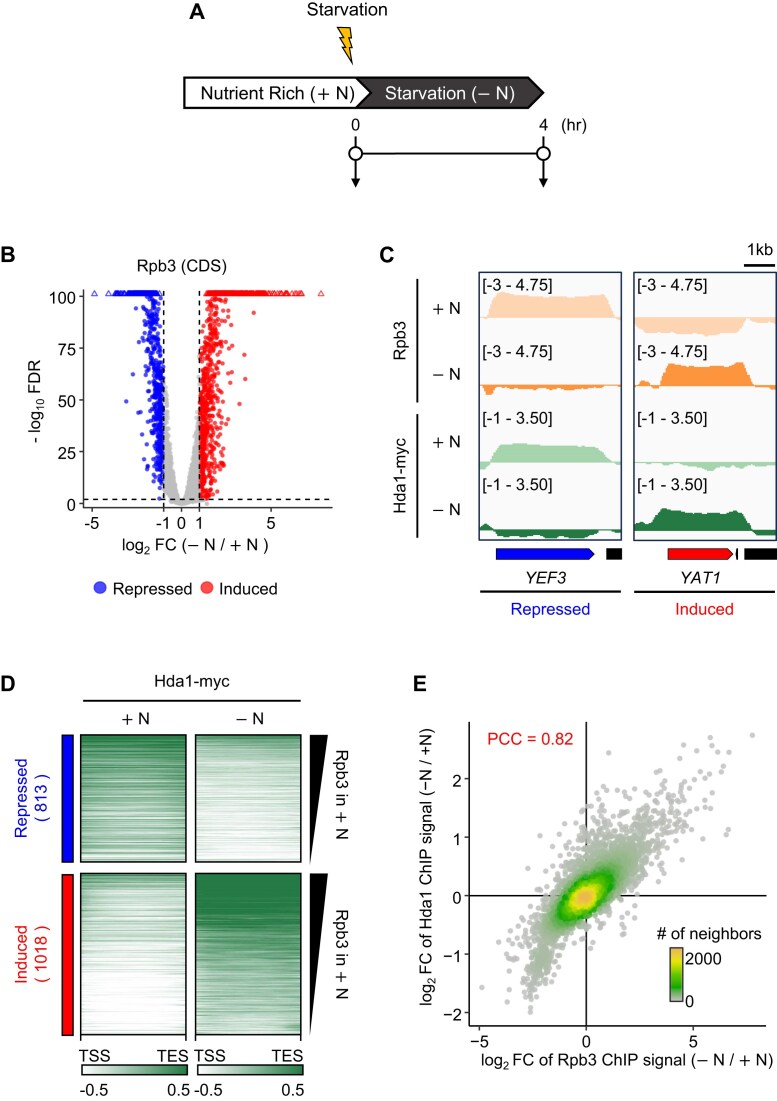
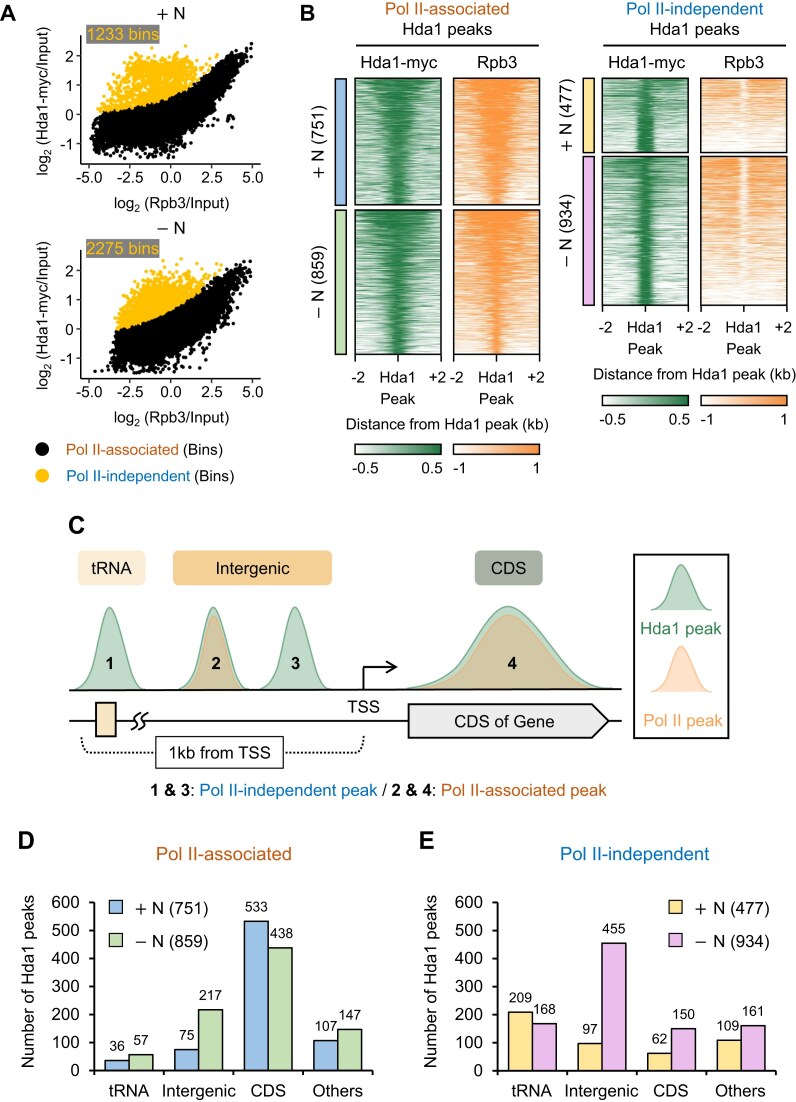
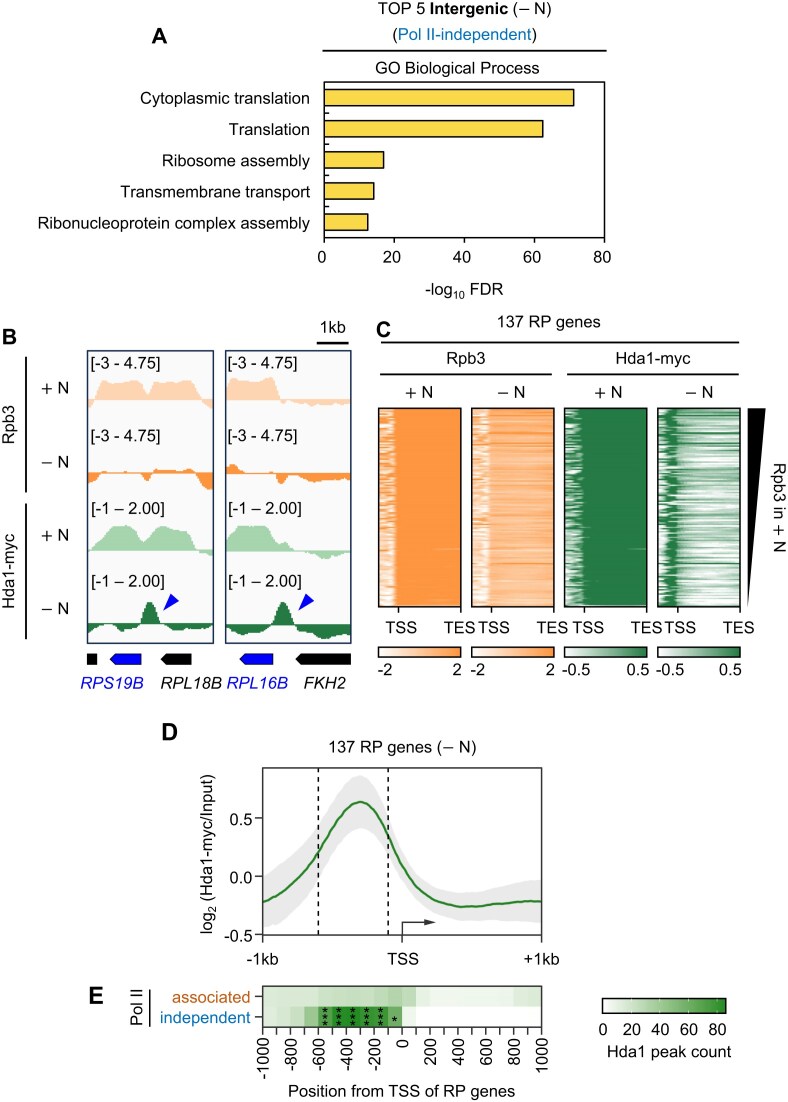
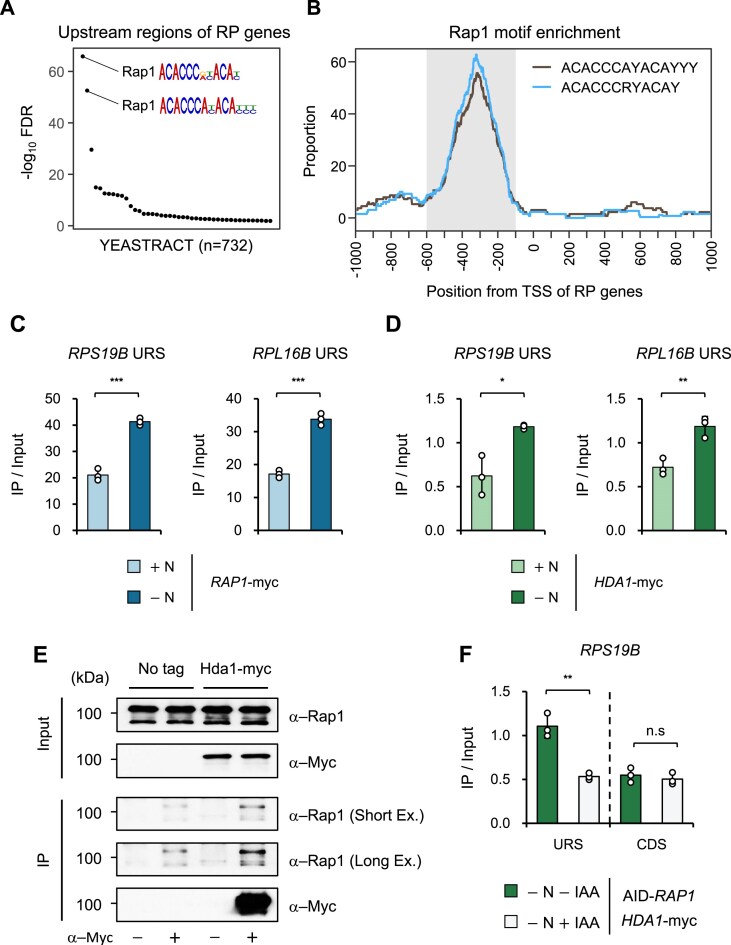
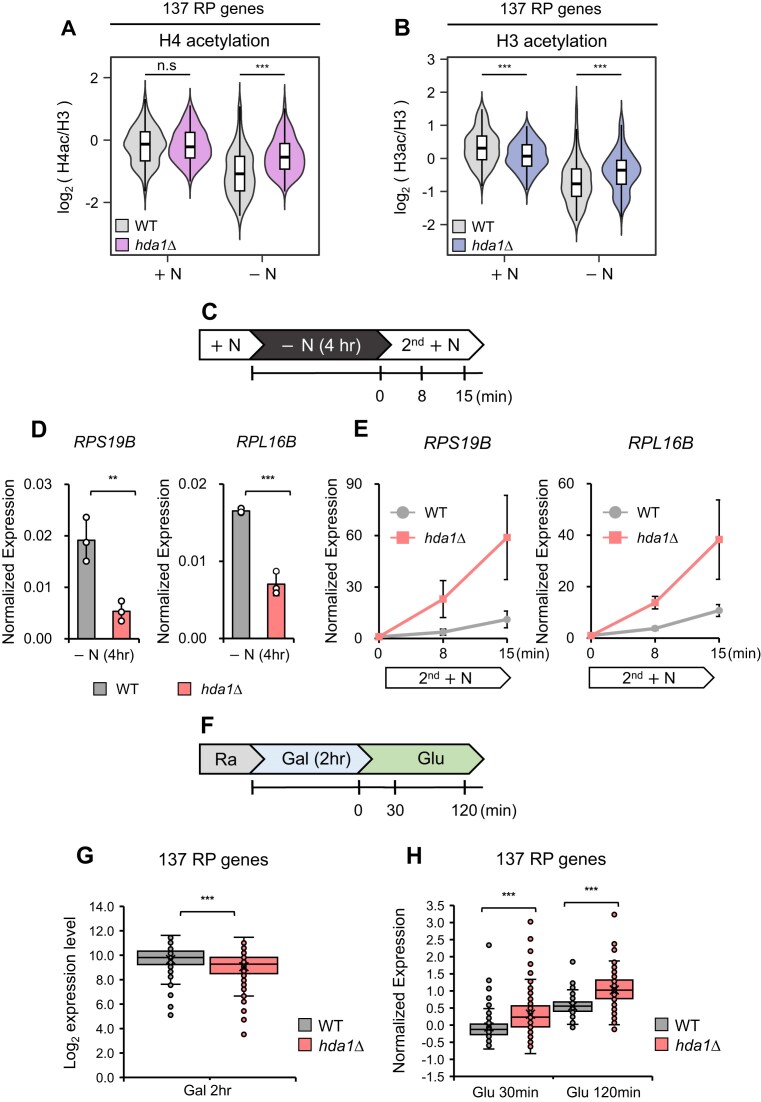
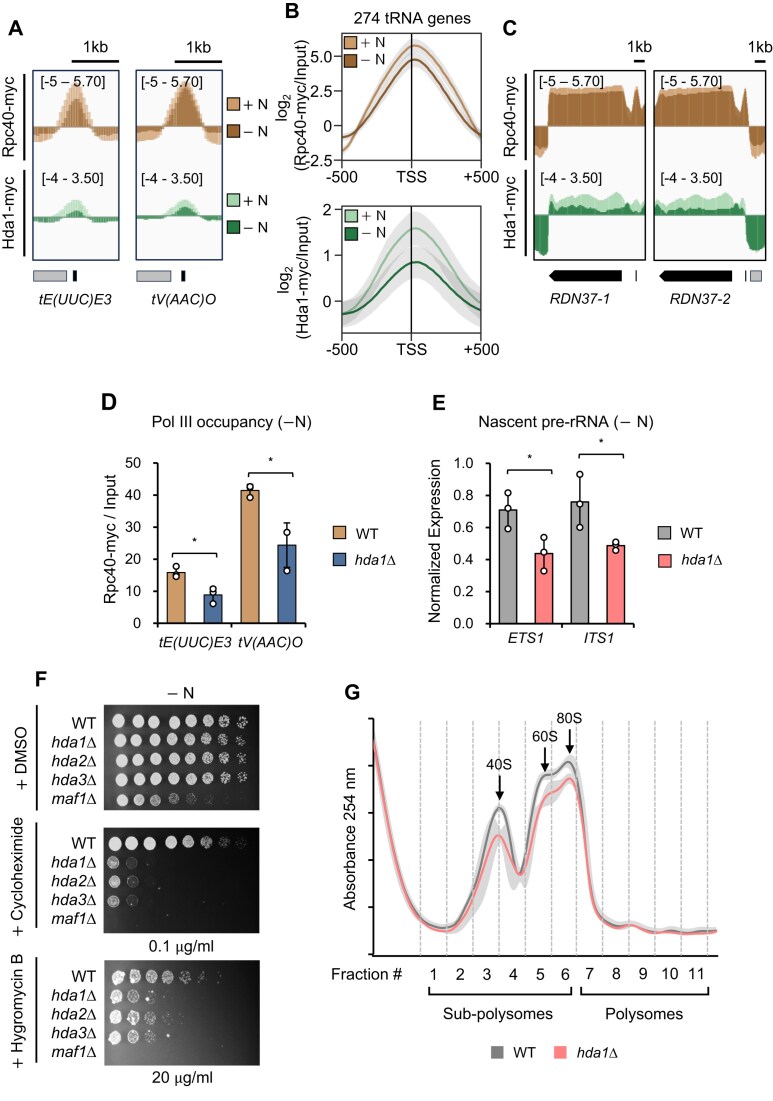
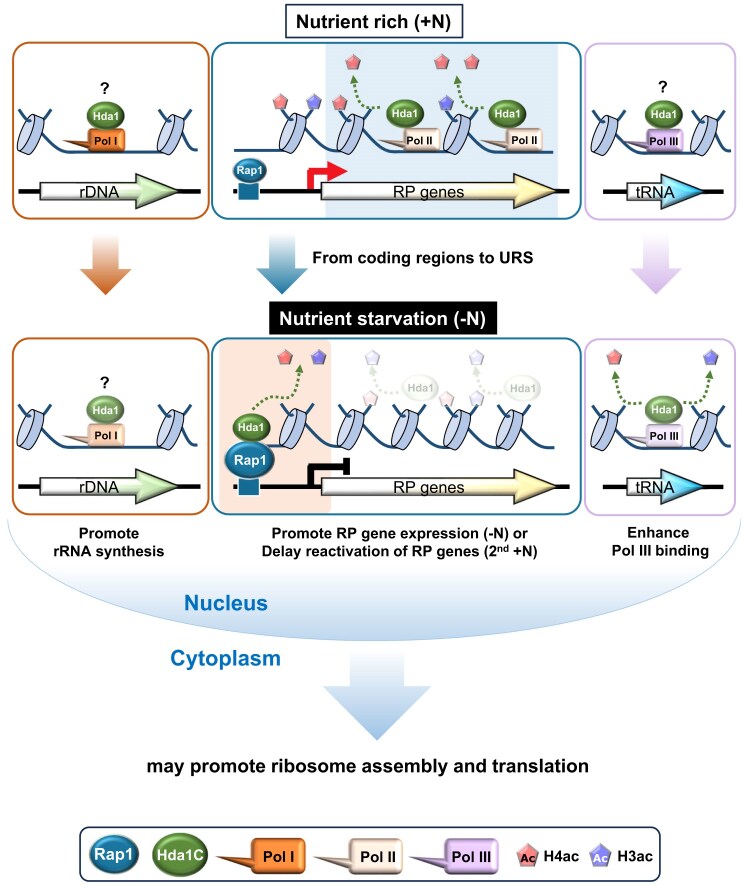
In yeast, Hda1 histone deacetylase complex (Hda1C) plays an important role in transcriptional regulation by modulating histone acetylation. We here explored the changes in Hda1C binding in nutrient-rich and -starved conditions. Chromatin immunoprecipitation sequencing revealed that starvation alters RNA Pol II and Hda1C binding to coding genes in a highly correlated manner. Interestingly, we discovered RNA Pol II transcription-independent recruitment of Hda1C to intergenic regions, particularly the upstream regulatory sequences (URS) of ribosomal protein (RP) genes, which are enriched with Rap1 binding sites. Under nutrient starvation, Rap1 contributes to the recruitment of Hda1C to these URS regions, where Hda1C deacetylates histones, thereby fine-tuning basal gene expression and delaying RP gene reactivation. Furthermore, Hda1C is also required for RNA Pol I transcription of ribosomal RNAs (rRNAs) and RNA Pol III transcription of transfer RNA (tRNA) genes, especially in nutrient-limited conditions. Significantly, Hda1C mutants are sensitive to translation inhibitors and display altered ribosome profiles. Thus, Hda1C may coordinate transcriptional regulation within the nucleus with translation control in the cytoplasm and could be a key regulator of gene expression responses to nutrient stress.


Conflict of interest statement

None declared.

Figures

Graphical Abstract
Graphical Abstract
Figure 1.
Figure 1.
Binding of Hda1C to coding regions correlates with transcription frequency. (A) Schematic representation of the nutrient starvation conditions (+N → −N) used to assess the effect of nutritional changes on transcriptional reprogramming. Nutrient-rich = YPD medium = +N; Starvation = 0.15X YP medium = −N. (B) Volcano plot of differential Rpb3 (RNA Pol II) binding to mRNA genes, based on the average of two independent ChIP-seqs of wild type cells that were subjected to +N and −N. S. pombe chromatin was included as spike-in controls. Two-fold change and 0.01 FDR thresholds were considered significant. The 813 downregulated and 1018 upregulated genes under -N conditions are labeled as "repressed" and "induced" in the plot. (C) ChIP-seq tracks of the Rpb3 and Hda1-myc ChIP signals at YEF3 (a gene that is repressed by −N) and YAT1 (a gene that is induced by −N), based on the average of two independent ChIP-seqs of wild type cells that were subjected to +N and −N. S. pombe chromatin was included as spike-in controls. (D) Heatmaps of Hda1-myc ChIP signals at the 813 and 1018 genes that are repressed and induced by −N, respectively. The average of the two independent experiments including S. pombe spike-in controls is shown. The genes are sorted in descending order of Rpb3 level in formula imageN conditions. The y-axis indicates each gene, and the x-axis indicates relative position to TSS and transcription end site (TES). (E) Changes of Hda1 binding and Rpb3 occupancy at coding regions show a strong positive correlation. Differential Hda1-myc occupancy in −N compared to +N was plotted against differential Rpb3 occupancy in +N and −N. Pearson’s correlation coefficient is indicated (PCC formula image0.82).
Figure 2.
Figure 2.
RNA Pol II-independent targeting of Hda1C. (A) Hda1C can bind to the genome in a transcription-independent manner in +N and −N conditions. The average occupancy of Hda1-myc from two-independent ChIP-seqs including S. pombe chromatin as spike-in controls was plotted against Rpb3 level in +N and −N conditions, respectively. For this, the entire genome except the 200 bp end region of each chromosome was divided into 60333 200 bp bins. A robust nonlinear regression model revealed Pol II-associated bins (fitted bins, black) and Pol II-independent bins (outlier bins, yellow) in both conditions. The numbers of Pol II-independent bins are indicated. (B) Hda1 peaks in +N and −N were subdivided into Pol II-associated (+N: n = 751, blue; −N: n = 859, green) and Pol II-independent peaks (+N: n = 477, yellow; −N: n = 934, pink) based on whether they overlapped with Rpb3 peaks. Heatmaps of the ChIP-seq signals for Hda1-myc and Rpb3 around Hda1 peaks are shown. The signals were plotted over 4 kb windows centered on the Hda1 peaks. Each genomic region is presented in descending order according to Rpb3 levels. (C) Schematic representation depiction of the major regions that bear Hda1 peaks in +N/−N conditions. The Hda1 peaks were classified into four groups based on their genomic location: (i) tRNA, (ii) and (iii) Intergenic, (iv) CDS, and others. (D and E) The number of Pol II-associated (D) and Pol II-independent (E) Hda1 peaks in the different genomic regions. Most Pol II-associated Hda1 peaks were found at CDS in both +N and −N whereas most Pol II-independent Hda1 peaks were at tRNAs in +N and at Intergenic regions −N.
Figure 3.
Figure 3.
RNA Pol II-independent targeting of Hda1C to the URS of RP genes. (A) Gene ontology (GO) analysis of enriched biological processes for mRNA genes where Pol II-independent “Intergenic” −N Hda1 peaks are found within 1 kb upstream region. GO terms associated with translation (GO:0002181 and GO:0006412) were enriched at these genes. (B) ChIP-seq tracks of the Rpb3 and Hda1-myc ChIP signals at RPS19B and RPL16B in +N and −N conditions. (C) Starvation induces Hda1C to relocalize from the coding regions of RP genes to their URS. Heatmaps of Rpb3 and Hda1-myc ChIP signals at all 137 RP genes in +N and −N. Genes are sorted in descending order of Rpb3 levels in +N (y-axis). The x-axis indicates the position relative to the 1 kb upstream region, the TSS, and the TES. (D) Line plot showing the average Hda1-myc ChIP-seq signals in the 1 kb region flanking the TSS of the 137 RP genes in −N conditions. Standard deviation (S.D.) was indicated in gray. (E) Heatmap showing that the RNA Pol II-independent Hda1 peaks in −N are particularly enriched in the −600 bp to −100 bp region of the 137 RP genes. Statistical significance was calculated using the Poisson test (*FDR formula image 0.05, and ***FDR formula image 0.001).
Figure 4.
Figure 4.
Rap1 is required for the recruitment of Hda1C to the URS of RP genes. (A) Two Rap1-binding motifs (ACACCCAYACAYYY and ACACCCRYACAY) are enriched in the 1 kb upstream region of the 137 RP genes. (B) Location of the two Rap1-binding motifs in the 1 kb regions that flank the TSS of the 137 RP genes. RNA Pol II independent Hda1 peaks in −N identified in Fig. 3E were indicated in gray. (C and D) The binding of Rap1 and Hda1 to the URS of RP genes is increased upon starvation. Occupancy of Rap1-myc and Hda1-myc in +N and −N conditions was monitored by ChIP assay using the indicated strains. Crosslinked chromatin was precipitated with anti-myc antibody. qPCR analysis of the precipitated DNA was carried out on the URS of RPS19B and RPL16B. The signals for Rap1-myc and Hda1-myc were quantitated and normalized to the input signal. A nontranscribed region near the telomere of chromosome VI was used as an internal control for ChIP assay using HDA1-myc. Error bars show the standard deviation (S.D.) calculated from three biological replicates, each with three technical replicates. *Pformula image 0.05, **Pformula image 0.01, and ***Pformula image 0.001 (two-tailed unpaired Student’s t tests). (E) Hda1 physically interacts with Rap1 in −N. Whole cell extracts from the indicated strains were incubated with anti-myc antibody and protein G beads. The precipitates (IP) were analyzed by immunoblotting for myc-tagged proteins (Hda1-myc) and Rap1. (F) Hda1C binding to the URS of RP genes is reduced upon depletion of Rap1 in −N conditions. HDA1-myc cells expressing AID-Rap1 were grown in +N and then shifted to IAA containing −N medium (−N + IAA) for 4 h to deplete Rap1. An equal volume of DMSO in −N (−N–IAA) served as a negative control. ChIP-qPCR analysis of RPS19B was performed using anti-myc antibody as in Fig. 4D.
Figure 5.
Figure 5.
Histone deacetylation by Hda1C at the URS affects RP gene expression. (A and B) Hda1C deacetylates histone H3 and H4 at the URS of RP genes in −N. The violin plot shows the average H3 and H4 acetylation levels at the −600 to −100 bp region of all 137 RP genes in WT and HDA1-deleting cells. The H4 acetylation and H3 acetylation levels were normalized to total H3 content and calculated in log2 ratio. The data are from two independent ChIP-seq experiments. Significance levels were computed by Wilcoxon signed-rank test (***P < 0.001). (C) Schematic representation of time course experiments to monitor transcriptional responses of WT and HDA1-deleting cells undergoing starvation (−N) and nutrient refeeding (2nd +N). RNA samples were collected at the indicated time points. (D) Downregulation of RPS19B and RPL16B upon HDA1 deletion in −N conditions. WT and HDA1-deleting cells were grown as in Fig. 5C, and mRNA levels were determined by RT-qPCR with three independent RNA samples. SCR1 was used as an internal control. Error bars show standard deviation (S.D.) calculated from three biological replicates, each with three technical replicates. **P < 0.01, and ***P < 0.001 (two-tailed unpaired Student’s t tests). (E) HDA1 deletion accelerates the recovery of RPS19B and RPL16B after nutrient refeeding. The indicated strains were grown as in Fig. 5C. mRNA levels were determined by RT-qPCR with three independent RNA samples, SCR1 being used as an internal control. The ratios of transcript levels at 2nd +N (8 and 15 min) relative to the transcript levels in −N (4 h) were plotted. Error bars show standard deviation (S.D.) calculated from three biological replicates, each with three technical replicates. (F) Schematic representation of time course experiments to monitor transcriptional responses of WT and HDA1-deleting cells during carbon source shifts (Ra → Gal 2hr → Glu). Ra, Raffinose; Gal, Galactose; Glu, Glucose [12]. (G) Global downregulation of RP genes upon HDA1 deletion in galactose medium. The box plot shows the log2 expression levels of the 137 RP genes in galactose medium (Gal 2 h) [12]. ***P < 0.001 (two-tailed unpaired Student’s t test). (H) Rapid reactivation kinetics of 137 RP genes in HDA1-deleting cells during the transition from galactose to glucose medium. The box plot represents the ratios of the transcript levels of the 137 RP genes in glucose medium (Glu 30 min, Glu 120 min) relative to their transcript levels in galactose medium (Gal 2 h) [12]. ***P < 0.001 (two-tailed unpaired Student’s t test).
Figure 6.
Figure 6.
Hda1C regulates RNA Pol I and Pol III transcription and contributes to translation upon starvation. (A–  C) Targeting of Hda1C to tRNAs and rDNA loci. (A) ChIP-seq tracks of the Rpc40-myc and Hda1-myc ChIP signals at tE(UUC)E3 and tV(AAC)O in +N and −N. (B) Line plot showing the average Rpc40-myc and Hda1-myc ChIP-seq signals at the −500 to +500 bp region of the indicated tRNA genes in +N and −N. The standard deviation is indicated in gray. (C) ChIP-seq tracks of the Rpc40-myc and Hda1-myc ChIP signals at RDN37-1 and RDN37-2 in +N and −N. (D) Hda1C is required for optimal RNA Pol III occupancy to tRNA genes in −N. Crosslinked chromatin from WT and HDA1-deleting cells, expressing Rpc40-myc, was precipitated with anti-myc antibody. ChIP-qPCR analysis of the precipitated DNA was done on tE(UUC)E3 and tV(AAC)O as in Fig. 4D. *P < 0.05 (two-tailed unpaired Student's t tests). (E) Downregulation of nascent pre-rRNA levels upon HDA1 deletion in −N. Nascent pre-rRNA levels were determined by RT-qPCR with three independent RNA samples, SCR1 being used as an internal control. *P < 0.05 (two-tailed unpaired Student’s t tests). (F) Mutants for Hda1C exhibit profound sensitivity to the translational inhibitors cycloheximide and hygromycin B in −N conditions. The indicated cells were spotted in 3-fold dilutions onto 0.15X YP (−N) plates containing DMSO, cycloheximide (0.1formula imageg/ml), or hygromycin B (20formula imageg /ml). The maf1Δ mutant was used as a positive control. (G) Loss of Hda1 slightly impairs ribosome assembly or translation in −N. Polysome profiles of wild type and HDA1-deleting cells were measured by tracing the UV absorbance at 254 nm (A254) after fractionating the whole cell extracts using a sucrose density gradient. The line plot depicts the average A254 signals for the indicated strains, with the standard deviation (S.D.) shown in gray. The average value and S.D. were calculated from three biological replicates.
Figure 7.
Figure 7.
Models of Hda1C-mediated coordination of transcription and translation. Hda1C interacts with genes that are transcribed by all three RNA polymerases (RNA Pol I, II, and III). In nutrient-rich conditions, Hda1C primarily associates with elongating RNA Pol II and deacetylates histone H4 at the coding regions of RP genes. Hda1C also localizes to rDNA and tRNA loci, transcribed by RNA Pol I and Pol III, respectively. However, its precise role in regulating transcription of these genes under nutrient rich conditions remains to be clarified. Upon nutrient starvation, Hda1C relocates to the URS of RP genes by interacting with Rap1, where it deacetylates both histone H3 and H4. This deacetylation either enhances basal transcription or delays reactivation of RP genes when the cells are shifted back to nutrient-rich conditions. Hda1C remains associated with rDNA and tRNA loci and promotes their transcription by RNA Pol I and Pol III, respectively. All of these activities of Hda1C occur within the nucleus. The fact that Hda1C affects RP gene expression and rRNA synthesis suggests that Hda1C shapes ribosome assembly. Moreover, by facilitating tRNA transcription, Hda1C may also directly support translation. These observations propose that Hda1C functions as a key integrator that coordinates transcriptional regulation and ribosome activity, particularly during nutrient starvation, to ensure cellular adaptation to changing environmental conditions.

Similar articles

References

    1. Kim U, Lee DS Epigenetic regulations in mammalian cells: roles and profiling techniques. Mol Cells. 2023; 46:86–98.10.14348/molcells.2023.0013. - DOI - PMC - PubMed
    1. Kouzarides T Chromatin modifications and their function. Cell. 2007; 128:693–705.10.1016/j.cell.2007.02.005. - DOI - PubMed
    1. Li B, Carey M, Workman JL The role of chromatin during transcription. Cell. 2007; 128:707–19.10.1016/j.cell.2007.01.015. - DOI - PubMed
    1. Buratowski S, Kim T The role of cotranscriptional histone methylations. Cold Spring Harbor Symp Quant Biol. 2010; 75:95–102.10.1101/sqb.2010.75.036. - DOI - PMC - PubMed
    1. Woo H, Ha D, L S et al. . Modulation of gene expression dynamics by co-transcriptional histone methylations. Exp Mol Med. 2017; 49:e326.10.1038/emm.2017.19. - DOI - PMC - PubMed

MeSH terms

LinkOut - more resources