

Assessment of risk for pre-eclampsia at mid-gestation to define subsequent care
- PMID: 40248972
- PMCID: PMC12127725
- DOI: 10.1002/uog.29222
Assessment of risk for pre-eclampsia at mid-gestation to define subsequent care
Abstract
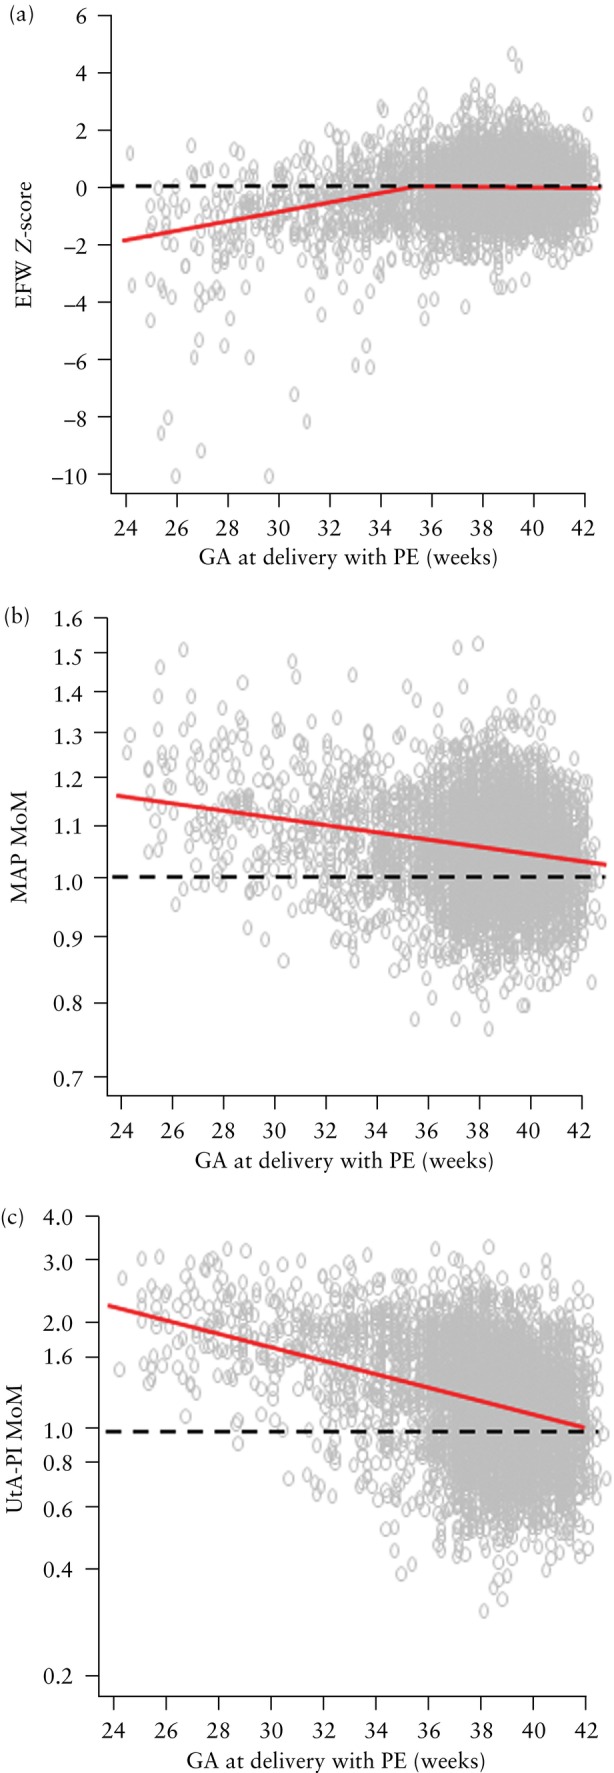
Objective: To stratify pregnancy care based on the estimated risk of pre-eclampsia (PE) from screening at 19-24 weeks' gestation by combinations of maternal risk factors, estimated fetal weight (EFW), mean arterial pressure (MAP) and uterine artery pulsatility index (UtA-PI).
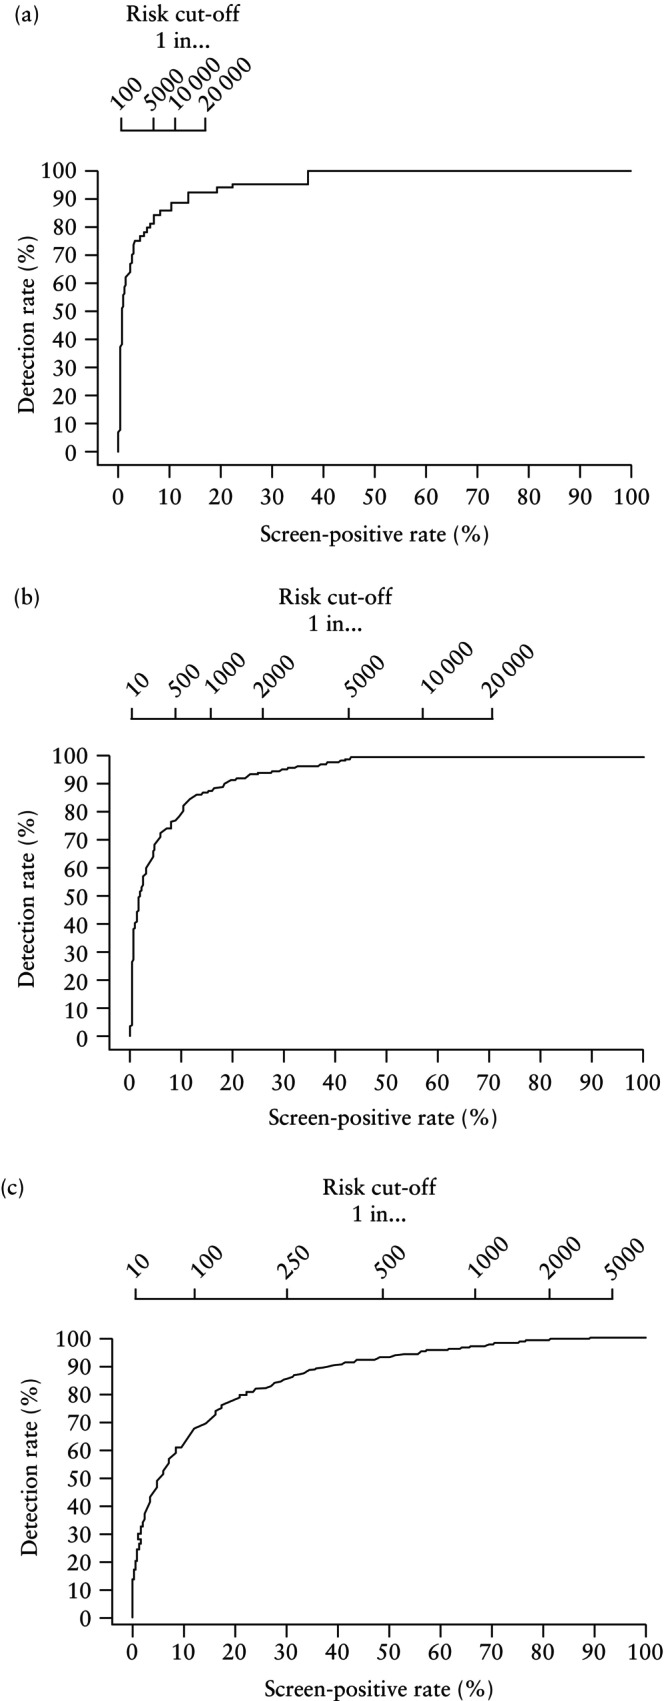
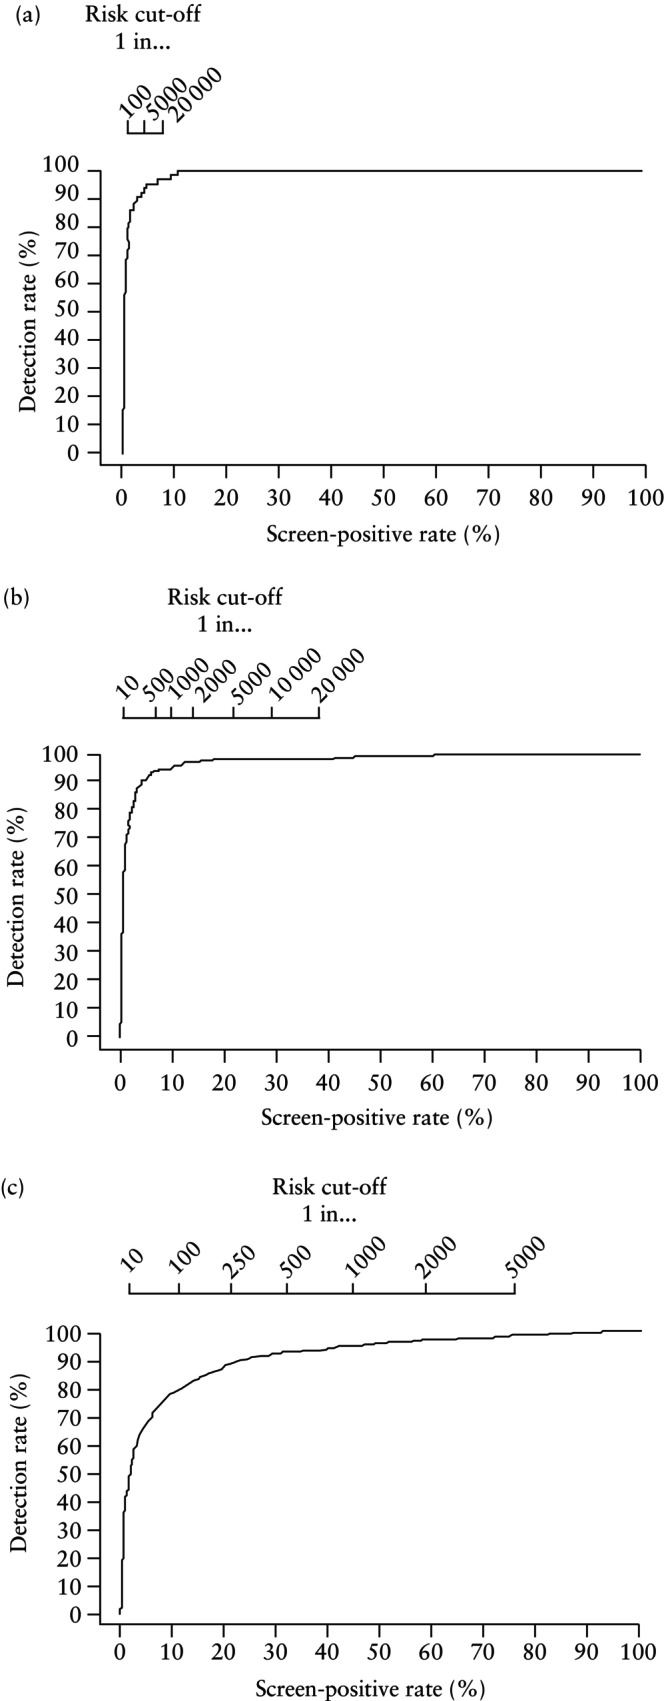
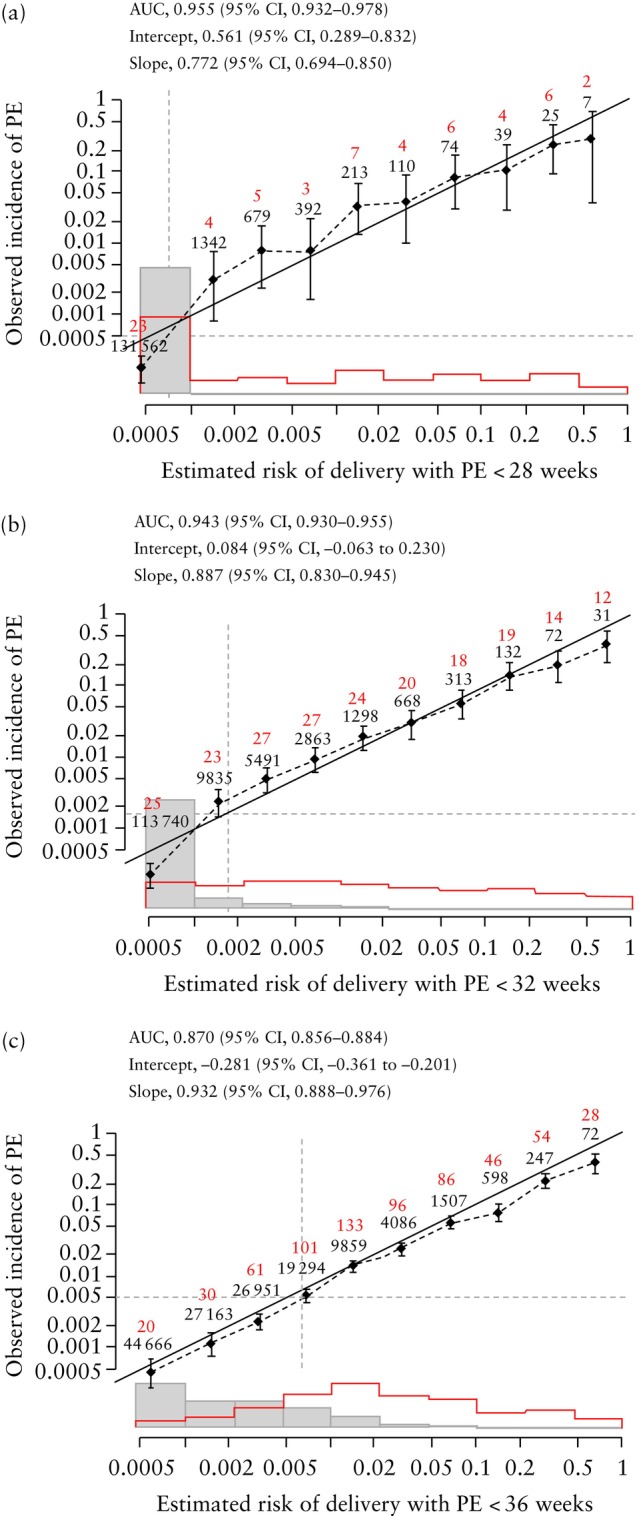
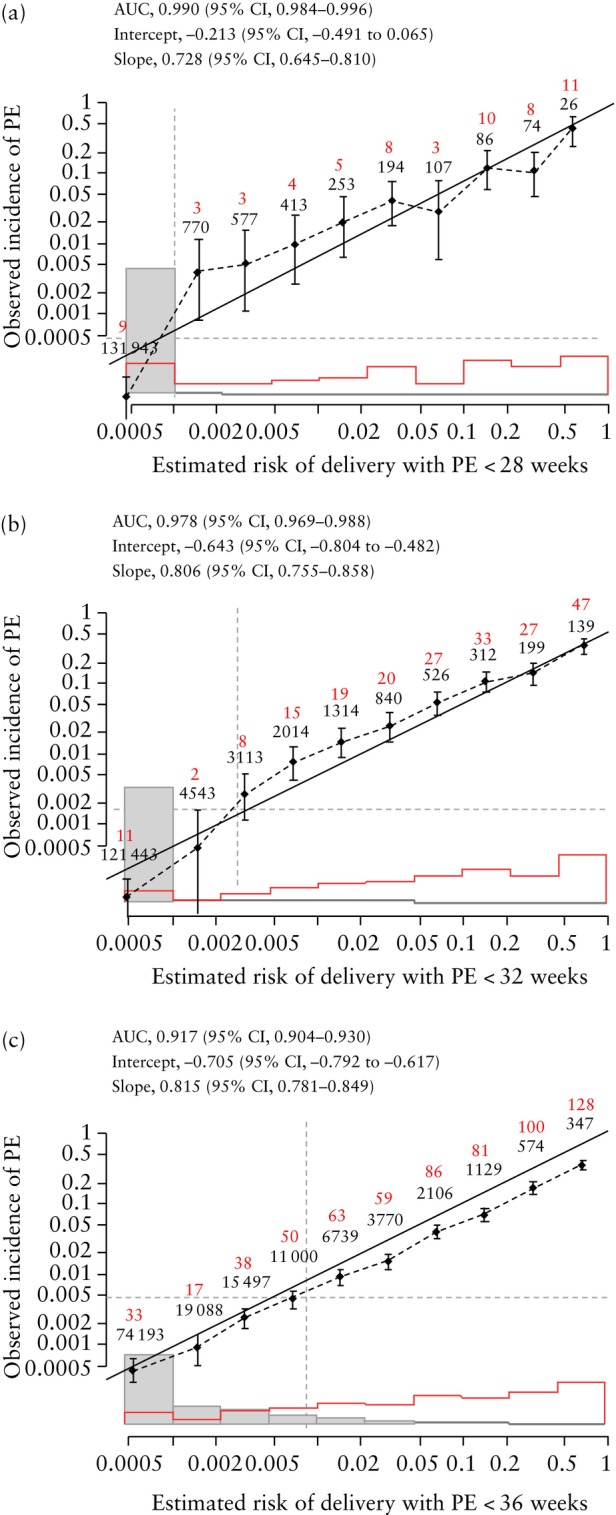
Methods: The data for this study were derived from a prospective non-interventional study in 134 443 women with a singleton pregnancy attending for a routine ultrasound scan at 19 + 0 to 23 + 6 weeks' gestation in two UK maternity hospitals. The visit included recording of maternal demographic characteristics and medical history, sonographic EFW and measurement of MAP and UtA-PI. The competing-risks model was used to estimate the individual patient-specific risk of delivery with PE at < 28, < 32 and < 36 weeks' gestation. Receiver-operating-characteristics curves were constructed for screen-positive rates (SPRs) at different detection rates of delivery with PE at < 28, < 32 and < 36 weeks' gestation for the combinations of maternal risk factors, EFW and MAP, and of maternal risk factors, EFW, MAP and UtA-PI. Different risk cut-offs were used with the intention of detecting about 80%, 85% and 90% of cases of delivery with PE at < 28, < 32 and < 36 weeks' gestation. Calibration for risk of delivery with PE at < 28, < 32 and < 36 weeks' gestation was assessed by plotting the observed incidence of PE against the predicted incidence of PE.
Results: The study population contained 4335 (3.2%) women that subsequently developed PE, including 64 (0.05%) that delivered with PE at < 28 weeks' gestation, 209 (0.2%) that delivered with PE at < 32 weeks and 655 (0.5%) that delivered with PE at < 36 weeks. If the objective of screening was to identify about 90% of cases of delivery with PE at < 28, < 32 and < 36 weeks and the method of screening was a combination of maternal risk factors, EFW and MAP, the respective SPRs would be 11.0%, 18.3% and 38.8%. If the method of screening also included UtA-PI, the respective SPRs would be 2.6%, 3.8% and 23.6%. If the objective of screening was to identify about 80% of cases of delivery with PE at < 28, < 32 and < 36 weeks and the method of screening was a combination of maternal risk factors, EFW and MAP, the respective SPRs would be 5.9%, 9.7% and 21.9%. If the method of screening also included UtA-PI, the respective SPRs would be 1.0%, 2.1% and 11.7%. The calibration plots demonstrated good agreement between the estimated risk and observed incidence of PE.
Conclusions: All women should be offered assessment of risk for PE at 11-13 weeks, to help identify those requiring aspirin prophylaxis to reduce the rate of preterm PE, and at 35-37 weeks, to determine the optimal timing of birth to reduce the rate of term PE. Assessment of risk for PE at mid-gestation can be used to identify the subgroups that require additional monitoring at 24-35, 28-35 and 32-35 weeks' gestation. The best performance of screening, reflected in the SPR necessary to achieve a high detection rate, is achieved by a combination of maternal risk factors, MAP and UtA-PI. © 2025 The Author(s). Ultrasound in Obstetrics & Gynecology published by John Wiley & Sons Ltd on behalf of International Society of Ultrasound in Obstetrics and Gynecology.
Keywords: estimated fetal weight; fetal biometry; impaired placentation; mean arterial pressure; pre‐eclampsia; uterine artery Doppler.
© 2025 The Author(s). Ultrasound in Obstetrics & Gynecology published by John Wiley & Sons Ltd on behalf of International Society of Ultrasound in Obstetrics and Gynecology.
Figures
References
-
- Magee LA, Nicolaides KH, von Dadelszen P. Preeclampsia. N Engl J Med. 2022;386(19):1817‐1832. - PubMed
-
- Wright D, Wright A, Nicolaides KH. The competing risk approach for prediction of preeclampsia. Am J Obstet Gynecol. 2020;223(1):12‐23.e7. - PubMed
-
- O'Gorman N, Wright D, Syngelaki A, et al. Competing risks model in screening for preeclampsia by maternal factors and biomarkers at 11–13 weeks' gestation. Am J Obstet Gynecol. 2016;214(1):103.e1‐103.e12. - PubMed
-
- Andrietti S, Silva M, Wright A, Wright D, Nicolaides KH. Competing‐risks model in screening for pre‐eclampsia by maternal factors and biomarkers at 35–37 weeks' gestation. Ultrasound Obstet Gynecol. 2016;48(1):72‐79. - PubMed
-
- Döbert M, Wright A, Varouxaki AN, et al. STATIN trial: predictive performance of competing‐risks model in screening for pre‐eclampsia at 35–37 weeks' gestation. Ultrasound Obstet Gynecol. 2022;59(1):69‐75. - PubMed
Publication types
MeSH terms
Grants and funding
LinkOut - more resources
Full Text Sources
Research Materials
Miscellaneous
