. 2025 Apr;55(4):e202451641.
doi: 10.1002/eji.202451641.

Combined Deletion of ZFP36L1 and ZFP36L2 Drives Superior Cytokine Production in T Cells at the Cost of Cell Fitness

Affiliations

Combined Deletion of ZFP36L1 and ZFP36L2 Drives Superior Cytokine Production in T Cells at the Cost of Cell Fitness

Nordin D Zandhuis et al. Eur J Immunol. 2025 Apr.

Abstract

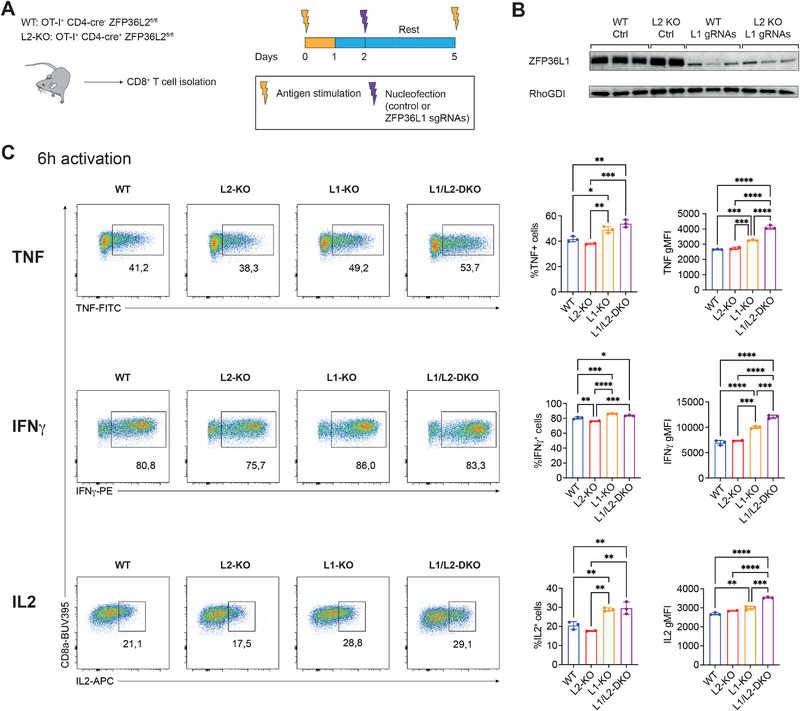
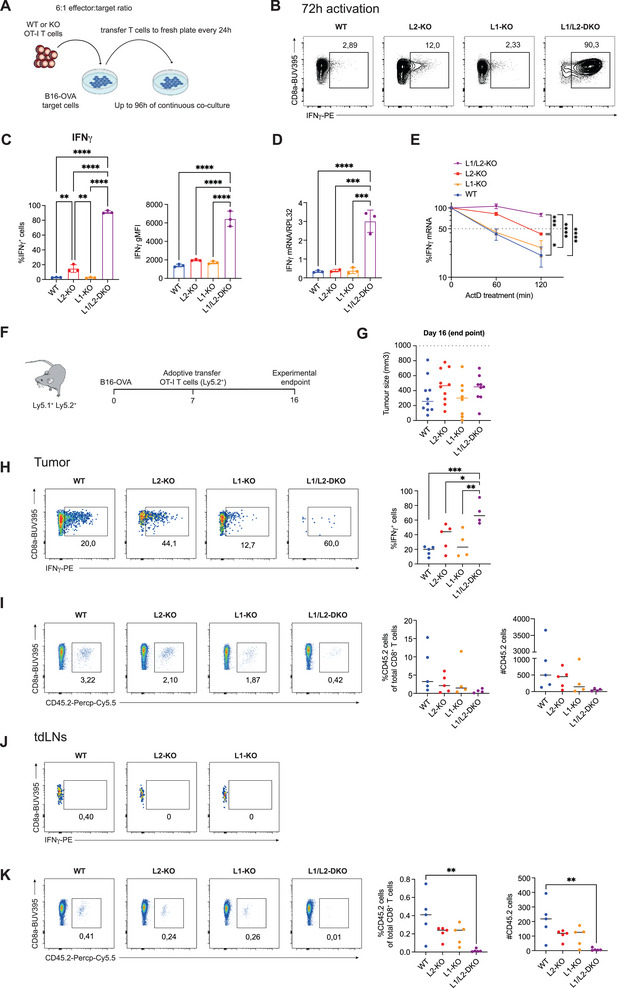
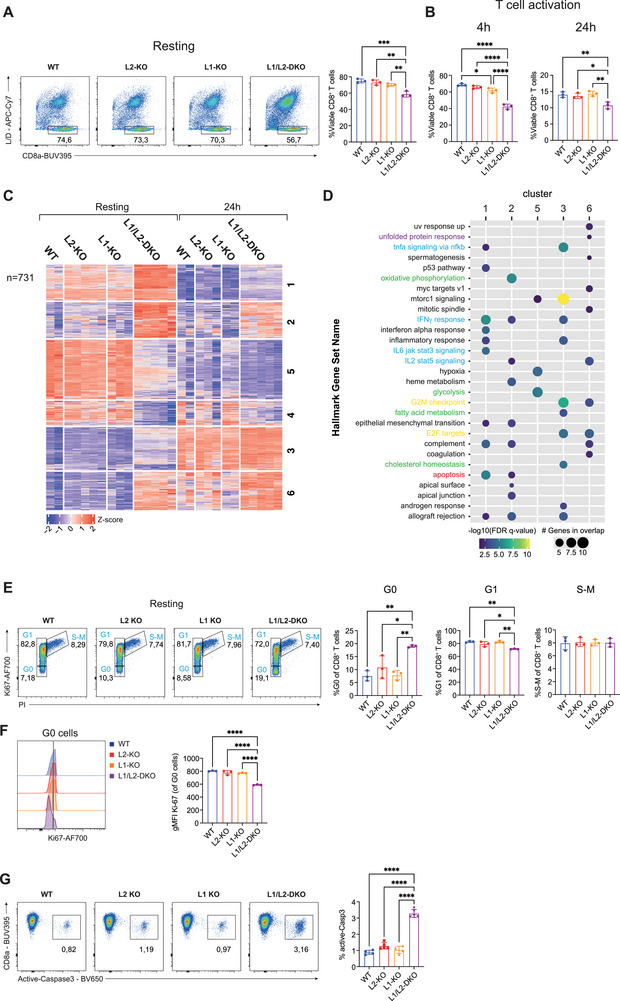
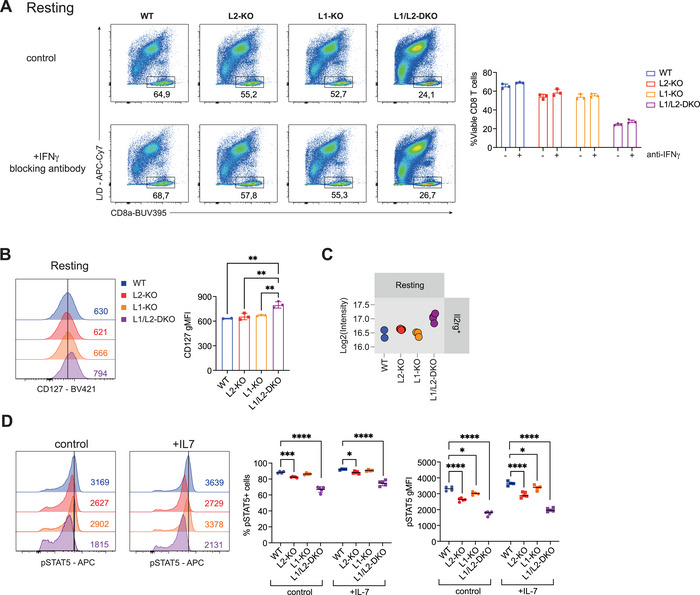
A key feature of cytotoxic CD8+ T cells for eliminating pathogens and malignant cells is their capacity to produce proinflammatory cytokines, which include TNF and IFNγ. Provided that these cytokines are highly toxic, a tight control of their production is imperative. RNA-binding proteins (RBPs) are essential for the fine-tuning of cytokine production. The role of the RBP ZFP36L1 and its sister protein ZFP36L2 herein has been established, but their relative contribution to cytokine production is not well understood. We here compared the effect of ZFP36L1 and ZFP36L2 single and double deficiency in murine effector CD8+ T cells. Whereas single deficient T cells significantly increased cytokine production, double deficiency completely unleashed the cytokine production. Not only the TNF production was substantially prolonged in double-deficient T cells. Also, the production of IFNγ reached unprecedented levels with >90% IFNγ-producing T cells compared with 3% in WT T cells after 3 days of continuous activation. This continuous cytokine production by double-deficient T cells was also observed in tumor-infiltrating lymphocytes in vivo, however, with no effect on tumor growth. ZFP36L1 and ZFP36L2 double deficiency resulted in decreased cell viability, impaired STAT5 signaling, and dysregulated cell cycle progression. In conclusion, while combined deletion in ZFP36L1 and ZFP36L2 can drive continuous cytokine production even upon chronic activation, safeguards are in place to counteract such super-cytokine producers.


Conflict of interest statement

The authors declare no conflicts of interest.

Figures

FIGURE 1
FIGURE 1
Differential expression kinetics of ZFP36L1 and ZFP36L2 during T cell activation correlate with ZFP36L1‐mediated regulation of early cytokine production. (A) Schematic overview of generation of WT, L2‐KO, L1‐KO, and L1/L2‐DKO T cells using ZPF36L2cko and WT OT‐I T cells treated with control sgRNA (WT, L2‐KO) or ZFP36L1‐targeting sgRNAs (L1‐KO, L1/L2‐DKO). (B) Immunoblot displaying ZFP36L1 protein expression in indicated T cells. RhoGDI served as a loading control. n = 2–3 mice per condition. (C) Representative frequency of TNF, IFNγ, and IL‐2 producing T cells after 6 h of co‐culture of WT, L2‐KO, L1‐KO, and L1/L2‐DKO OT‐I T cells with B16‐OVA target cells. Brefeldin A was added for the last 2 h of activation. Expression levels for TNF, IFNγ, and IL‐2 among cytokine‐producing cells are displayed using geometric mean fluorescence intensity (gMFI). Each dot indicates one mouse, n = 2–3 mice per condition. (A–C) The presented data are from individual experiments. (A, B) One independent experiment has been performed. ( c ) Data are representative of four independent experiments. Data were analyzed by one‐way ANOVA with Tukey multiple comparison correction, mean ± SD (D); *p < 0.05, **p < 0.01, ***p < 0.001, ****p < 0.0001.
FIGURE 2
FIGURE 2
ZFP36L2+ZFP36L1 double deficiency results in superior IFNγ production during continuous activation but at the expense of cell loss. (A) Schematic representation of the in vitro B16‐OVA co‐culture system to continuously stimulate OT‐I T cells for up to 96 h. Every 24 h, T cells were transferred to a fresh plate of preseeded B16‐OVA cells. (B) Representative production of IFNγ by WT, L2‐KO, L1‐KO, and L1/L2‐DKO T cells upon 72 h of continuous exposure to B16‐OVA cells. Brefeldin A was added for the last 2 h of activation. (C) Frequency of IFNγ‐producing T cells (left panel) and gMFI levels of IFNγ (right panel) among IFNγ‐producing cells after 72 h of continuous exposure to B16‐OVA cells. n = 3 mice per condition. (D) Ifng mRNA levels and (E) Ifng mRNA decay normalized to Rpl32 mRNA levels in OT‐I T cells after 72 h of continuous co‐culture with B16‐OVA. For mRNA decay, OT‐I T cells were treated with 1 µg/mL Actinomycin D (ActD) for indicated time points. n = 2–3 mice per condition. (F) Schematic overview of in vivo B16‐OVA tumor model. (G) Tumor volume at day 16 posttumor inoculation of mice that received indicated OT‐I T cells. n = 10 for WT mice, n = 10 for L2‐KO mice, n = 8 for L1‐KO mice, and n = 9 for L1/L2‐DKO mice. (H) Frequency of IFNγ‐producing T cells among CD45.2+ tumor‐infiltrating OT‐I T cells after 4 h of ex vivo culture in the presence of Brefeldin A and Monensin. (I) Frequency and absolute number of CD45.2+ OT‐I T cells isolated from B16‐OVA tumors. (H, I) n = 4–5 mice per condition. (J) Representative flow plots showing frequency of IFNγ‐producing T cells among CD45.2+ OT‐I T cells isolated from tumor‐draining lymph nodes after 4 h of ex vivo culture in the presence of Brefeldin A and Monensin. (K) Frequency and absolute number of CD45.2+ OT‐I T cells isolated from tumor‐draining lymph nodes of B16‐OVA bearing mice. (C–E, G–I) The presented data are from individual experiments. (C) Data are representative of three independent experiments. (D–E, G–K) One independent experiment has been performed. Data were analyzed by one‐way ANOVA with Tukey multiple comparison correction, mean ± SD (C–E); *p < 0.05, **p < 0.01, ***p < 0.001, ****p < 0.0001.
FIGURE 3
FIGURE 3
Decreased cell viability of L1/L2‐DKO T cells, which show a dysregulated cell cycle progression. (A, B) Frequency of viable (LiveDeadnegative) T cells among resting (A) OT‐I T cells (4 days after initial activation), and (B) after 4 and 24 h of activation with the OVA peptide. n = 3 mice per condition. (C) Heatmap of Mass spectrometry analysis showing unsupervised clustering of differentially expressed proteins (p.adj < 0.05 & Log2FC > or < 0.5) between WT and L1/L2‐DKO cells of resting T cells and after 24 h of activation. The number of clusters was determined using k‐means clustering. n = 2–5 mice per condition. (D) Gene Set Enrichment Analysis (GSEA) for each cluster identified in (C). Gene sets associated with unfolded protein response (purple), cytokine signaling (blue), metabolism (green), cell cycle progression (yellow), and apoptosis (red) are highlighted. (E) Cell cycle analysis of resting OT‐I T cells using the proliferation marker Ki‐67 and propidium iodide (PI). Left: representative dot plots. Right: compiled data of percentages of G0, G1 and S–M phases. n = 3 mice. (F) Expression levels of Ki67 among G0 (Ki67low PInegative) cells. (G) Representative flow plot and percentage of active‐Caspase3+ cells within alive resting CD8+ T cells. (A‐F) The presented data are from individual experiments. (A) Data are representative of three independent experiments. (B–D, G) One independent experiment has been performed. (E, F) Data are representative of two independent experiments. Data were analyzed by one‐way ANOVA with Tukey multiple comparison correction, mean ± SD (A, B, E, F), *p < 0.05, **p < 0.01, ***p < 0.001, ****p < 0.0001.
FIGURE 4
FIGURE 4
L1/L2‐DKO T cells show impaired IL‐7 signaling (A) Left: Representative analysis of the frequency of viable (LiveDeadnegative CD8+) T cells among resting OT‐I T cells in the absence or presence (10 µg/mL) of an IFNγ blocking antibody. Right: data compiled from n = 3 mice. (B) Expression levels of IL‐7Ra (CD127) among resting T cells displayed using gMFI. n = 3 mice. (C) Protein expression levels in log2 intensity for IL‐2Rg in resting T cells. n = 2–5 mice. (D) Frequency of phosphorylated (Tyr694) STAT5 (pSTAT5) positive cells and pSTAT5 levels as defined by gMFI levels among resting T cells. n = 4–5 mice. (A–D) The presented data are from individual experiments. (A–D) One independent experiment has been performed. Data were analyzed by two‐sided, paired Student's t‐test, mean ± SD (A), or by one‐way ANOVA with Tukey multiple comparison correction, mean ± SD (B–D); *p < 0.05, **p < 0.01, ***p < 0.001, ****p < 0.0001. Asterisks (C) indicate significantly differentially expressed proteins between WT and L1/L2‐DKO cells; p.adj < 0.05 & Log2FC > or < 0.5.

Similar articles

References

    1. Zhang B., Karrison T., Rowley D. A., and Schreiber H., “IFN‐γ– and TNF‐dependent Bystander Eradication of Antigen‐loss Variants in Established Mouse Cancers,” Journal of Clinical Investigation 118 (2008): 1398–1404. - PMC - PubMed
    1. Ciuffreda D., Comte D., Cavassini M., et al., “Polyfunctional HCV‐specific T‐cell Responses Are Associated with Effective Control of HCV Replication,” European Journal of Immunology 38 (2008): 2665–2677. - PubMed
    1. Boulch M., Cazaux M., Cuffel A., et al., “Tumor‐intrinsic Sensitivity to the Pro‐apoptotic Effects of IFN‐γ Is a Major Determinant of CD4+ CAR T‐cell Antitumor Activity,” Nature Cancer 4, no. 7 (2023): 968–983. - PMC - PubMed
    1. Grivennikov S. I., Tumanov A. V., Liepinsh D. J., et al., “Distinct and Nonredundant in Vivo Functions of TNF Produced by T Cells and Macrophages/Neutrophils,” Immunity 22 (2005): 93–104. - PubMed
    1. Salerno F., Engels S., van den Biggelaar M., et al., “Translational Repression of Pre‐Formed Cytokine‐encoding mRNA Prevents Chronic Activation of Memory T Cells,” Nature Immunology 19 (2018): 828–837. - PMC - PubMed

MeSH terms