. 2025 May 2;13(5):729-748.
doi: 10.1158/2326-6066.CIR-24-0630.

Antitumor CD4+ T Helper 1 Cells Target and Control the Outgrowth of Disseminated Cancer Cells

Affiliations

Antitumor CD4+ T Helper 1 Cells Target and Control the Outgrowth of Disseminated Cancer Cells

Ganesan Ramamoorthi et al. Cancer Immunol Res. .

Abstract

Detection of disseminated cancer cells (DCC) in the bone marrow (BM) of patients with breast cancer is a critical predictor of late recurrence and distant metastasis. Conventional therapies often fail to completely eradicate DCCs in patients. In this study, we demonstrate that intratumoral priming of antitumor CD4+ T helper 1 (Th1) cells was able to eliminate the DCC burden in distant organs and prevent overt metastasis, independent of CD8+ T cells. Intratumoral priming of tumor antigen-specific CD4+ Th1 cells enhanced their migration to the BM and distant metastatic site to selectively target DCC burden. The majority of these intratumorally activated CD4+ T cells were CD4+PD1- T cells, supporting their nonexhaustion stage. Phenotypic characterization revealed enhanced infiltration of memory CD4+ T cells and effector CD4+ T cells in the primary tumor, tumor-draining lymph node, and DCC-driven metastasis site. A robust migration of CD4+CCR7+CXCR3+ Th1 cells and CD4+CCR7-CXCR3+ Th1 cells into distant organs further revealed their potential role in eradicating DCC-driven metastasis. The intratumoral priming of antitumor CD4+ Th1 cells failed to eradicate DCC-driven metastasis in CD4- or IFN-γ knockout mice. Moreover, antitumor CD4+ Th1 cells, by increasing IFN-γ production, inhibited various molecular aspects and increased classical and nonclassical MHC molecule expression in DCCs. This reduced stemness and self-renewal while increasing immune recognition in DCCs of patients with breast cancer. These results unveil an immune basis for antitumor CD4+ Th1 cells that modulate DCC tumorigenesis to prevent recurrence and metastasis in patients.


Conflict of interest statement

G. Ramamoorthi reports a patent for PCT/US2024/013114 pending to Moffitt Cancer Center. M.C. Lee reports other support from private donors during the conduct of the study. B.J. Czerniecki reports grants from CDMRP/DOD, Pennies in Action, and CDMRP/DOD during the conduct of the study as well as other support from ImmunoRestoration outside the submitted work and has a patent for use of syringe ready type I dendritic cells pending. No disclosures were reported by the other authors.

Figures
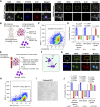
Figure 1.
Figure 1.
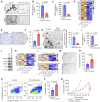
Gene expression status of DCCs, primary tumors, and metastatic tumors. A, Immunofluorescence staining for HER2+CYT8/18+Ki-67+ DCCs detection in the BM. Scale bars, 100 μm. B, Schematic showing the methods for DCCs isolation from the BM of BALB-neuT mice. C, Percentage of EpCAM+ DCCs isolated from the BM of BALB-neuT mice as determined by flow cytometry (isolated from the BM pool of 10 BALB-neuT mice). D, Cumulative representation of differentially expressed cancer stemness, EMT, and cell-cycle genes in DCCs of BALB-neuT mice, early lesion tumor cells from BALB-neuT mice (EL), and metastatic TUBO cells analyzed by RNA sequencing (n = 2/group). Cumulative Z-score denotes average score of genes in the respective panels. E, Schematic depicting the methods for DCCs isolation from the BM aspirates of patients with HER2+ breast cancer (BC). F, Cytopathologic confirmation of isolated DCCs from the BM of patients with HER2+ BC by Diff-Quik staining. Scale bars, 100 μm. G, Immunofluorescence staining for HER2+CYT8/18+ DCCs detection in the BM of patients with HER2+ BC. Scale bars, 100 μm. H, Percentage of Pan-cytokeratin+ (Pan-CYT+) DCCs isolated from the BM of a patient with HER2+ BC analyzed by flow cytometry. I, Bright-field image of in vitro cultured DCCs of patients with BC. Scale bars, 500 μm. J, Cumulative representation (average Z-score of genes) of differentially expressed cancer stemness, EMT, and cell-cycle genes in DCCs of patients with HER2+ BC, JIMT-1, BT474, and HCC1954 cells analyzed by RNA sequencing (n = 3/group). All data are presented as mean ± SEM. P values were assessed by one-way ANOVA with Tukey multiple comparisons test. SSC-A, side scatter area.
Figure 2.
Figure 2.
Intratumoral activation of antitumor CD4Th1 cells inhibits spontaneous metastasis. A, MRI images of BALB-neuT mice treated with or without intramammary gland HER2-DC1 (n = 6/group). B, Total tumor burden was recorded by MRI for experimental BALB-neuT mice (n = 6/group). C–E, IHC HER2 and CYT 8/18 double staining for the detection of micrometastases in lung (C), liver (D), and brain (E) sections from BALB-neuT mice treated with or without HER2-DC1 (n = 3/group). F, Quantification of spontaneous micrometastases in the lung and liver of experimental BALB-neuT mice (n = 3/group). G, Quantification of metastatic cancer cells seeding in brain of experimental BALB-neuT mice (n = 3/group). H, Infiltration of CD4T and CD8T cells in mammary gland of HER2-DC1–treated BALB-neuT mice and control analyzed by flow cytometry (n = 3–4/group). I, Frequency of CD4 T cells infiltration in the mammary gland of HER2-DC1–treated BALB-neuT mice and control determined by IHC (n = 3/group). J, IFN-γ secretion after coculturing TDLNs (from experimental BALB-neuT mice) with or without HER2-DC1 individually pulsed with p5, p435, and p1209 for 72 hours by automated ELISA (n = 2/group). K, IFN-γ secretion after restimulating splenocytes of experimental mice with rat HER2/neu peptides p5, p435, and p1209 individually and analyzed by automated ELISA (n = 4–6/group). L, Tumor growth curves of control and intratumoral HER3-DC1–treated BALB/c mice bearing 4T1 TNBC tumors (n = 9–10/group). M and N, IHC HER3 and Pan-cytokeratin (Pan-CYT) double staining for the detection and quantification of metastases in lung (M) and liver (N) sections from 4T1 TNBC spontaneous metastasis model (n = 3/group). O, Tumor growth curves of control and intratumoral HER3-DC1–treated C57BL/6 mice bearing B16F10 melanoma with spontaneous metastasis (n = 10/group). P, Tumor growth curves of B16-F10 high tumor burden spontaneous metastasis–bearing mice treated with or without intratumoral HER3-DC1 (n = 7–10/group). Q, Hematoxylin and eosin staining for the detection and quantification of spontaneous metastatic nodules in lungs from experimental B16F10 melanoma spontaneous metastasis model (O and P; n = 5–8/group). All data are presented as mean ± SEM. P values were calculated with one- or two-tailed Student t test. i.t., intratumoral delivery; ROI, region of interest.
Figure 3.
Figure 3.
Antitumor CD4 Th1 cells are primarily responsible for metastatic prevention. A, Total tumor burden was calculated for control and HER2-DC–treated BALB-neuT mice with or without CD4 or CD8 T-cell depletion by MRI (n = 4–6/group). B, IHC HER2 and cytokeratin 8/18 double staining for micrometastasis detection and quantification in lung and liver sections for experimental BALB-neuT mice (n = 3/group). C, Quantification of metastatic cancer cells seeding in brain of experimental BALB-neuT mice by IHC HER2 and cytokeratin 8/18 double staining (n = 3/group). D, Tumor growth curves of control and intratumoral HER3-DC1–treated mice bearing 4T1 tumors depleted with or without CD4 or CD8 T cells (n = 6–10/group). E and F, Hematoxylin and eosin staining for the detection and quantification of metastatic nodules in lung (E) and liver (F) from experimental 4T1 TNBC mice model (n = 3–8/group). G, Tumor growth curves of CD4 knockout mice bearing B16-F10 spontaneous metastasis treated with or without intratumoral HER3-DC1 (n = 6/group). H, Quantification of spontaneous lung metastatic nodules from CD4 knockout mice model (G; n = 5–6/group). I, 4T1 TNBC tumor–bearing mice treated with HER3-DC1 s.c. and intratumoral HER3-DC1, immature HER3-iDC, unpulsed DC1, or HER2-DC1 (n = 10/group). J, Quantification of spontaneous metastatic nodules in lungs from 4T1 TNBC mice model by hematoxylin and eosin staining (n = 5–10/group). K and L, Detection (K) and frequency (L) of CD4+IFN-γ+ T cells in control and intratumoral HER3-DC1–treated 4T1 TNBC tumors analyzed by flow cytometry (n = 2–3/group). M, Tumor growth curves of 4T1 TNBC tumor–bearing mice treated with intratumoral HER3-DC1 with or without IFN-γ neutralizing antibody (n = 9–10/group). N, Quantification of metastatic nodules in lungs from 4T1 TNBC spontaneous metastasis mice model determined by hematoxylin and eosin staining (n = 7–10/group). O, Tumor growth curves of IFN-γ knockout mice bearing B16F10 melanoma spontaneous metastasis treated with or without intratumoral HER3-DC1 (n = 10/group). P, Frequency of spontaneous metastatic nodules in lungs from IFN-γ knockout mice bearing B16F10 melanoma spontaneous metastasis treated with or without intratumoral HER3-DC1 (n = 4–5/group). Mean ± SEM represented. P values were determined by one- or two-tailed Student t test. ns, not significant; ROI, region of interest; SSC-A, side scatter area.
Figure 4.
Figure 4.
Antitumor CD4 Th1 cells target DCCs. A, Infiltration of CD4 T cells in the BM of experimental BALB-neuT mice analyzed by flow cytometry (n = 3–5/group). B and C, HER2+CYT8/18+Ki-67+ DCCs in BM (B) and lung (C) of experimental BALB-neuT mice were determined by flow cytometry (n = 2–6/group). D and E, SA-β-gal staining for the detection (D) and percentage of senescent DCCs (E) in the BM of experimental BALB-neuT mice (n = 5–8). Scale bars, 1 mm. F, Immunoblots for HER2, NR2F1, Wnt4, and Twist proteins in BM DCCs of control and HER2-DC1–treated BALB-neuT mice. G, Immunofluorescence staining of HER2+CYT8/18+Ki-67+ DCCs in BM of experimental BALB-neuT mice. Scale bars, 100 μm. H, Percentage of senescent DCCs induced by tumor antigen–specific CD4 Th1 cells secreting IFN-γ on DCCs from the BM of control BALB-neuT mice (n = 5–10). I, Frequency of CD45EpCAM+ DCCs (among the 100% of CD45-negative cell population) in the BM of mice bearing 4T1 TNBC spontaneous metastasis receiving various treatment analyzed by flow cytometry (n = 3/group). J and K, Detection (J) and frequency (K) of CD4+IFN-γ+ T cells in the BM of control and intratumoral HER3-DC1–treated mice bearing 4T1 TNBC spontaneous metastasis determined by flow cytometry (n = 2–3/group). L, Tumor growth curves of NSG mice (n = 4/group). M and N, IHC HER2 and CYT8/18 double staining for the detection of micrometastasis in lung (M) and liver (N) sections from L (n = 4). All data are presented as mean ± SEM represented. P values were calculated by one- or two-tailed Student t test and one-way ANOVA with Tukey multiple comparisons test.
Figure 5.
Figure 5.
Phenotypic analysis of CD4T cells in primary tumor, TDLN, and distant metastatic site with DCCs. A–C, Infiltration of CD4T cells in primary tumor (A), TDLN (B), and distant metastasis site lung with DCCs (C) of experimental mice bearing B16-F10 spontaneous metastasis analyzed by flow cytometry (n = 3/group). D, The frequency of CD4+PD1+ T cells in primary tumor (A) was determined by flow cytometry (n = 3/group). E, Infiltration of CD4+CD44+CD62L EM and CD4+CD44CD62L effector cells in primary tumor (A) determined by flow cytometry (n = 3/group). F, Infiltration of CD4+CD44+CD62L EM and CD4+CD44+CD62L+ central memory in TDLN (B) analyzed by flow cytometry (n = 3/group). G, Infiltration of CD4+CD44+CD62L EM, CD4+CD44+CD62L+ central memory, and CD4+CD44CD62L effector cells in distant metastatic site lung with DCCs (C) determined by flow cytometry (n = 3). H, The level of CD4+CCR7+CXCR3+ T, CD4+CCR7+CXCR3 T, CD4+CCR7CXCR3 T, and CD4+CCR7CXCR3+ T cells in primary tumor (A) determined by flow cytometry (n = 3/group). I and J, The level of CD4+CCR7+CXCR3+ T, CD4+CCR7+CXCR3 T, CD4+CCR7CXCR3+ T (I), and CD4+CCR7-CXCR3 T cells (J) in TDLN (B) determined by flow cytometry (n = 3/group). K and L, Infiltration of CD4+CCR7+CXCR3+ T, CD4+CCR7+CXCR3 T, CD4+CCR7CXCR3+ T (K), and CD4+CCR7CXCR3 T cells (L) in metastatic site lung with DCCs (C) determined by flow cytometry (n = 3/group). All data are presented as mean ± SEM represented. P values were calculated by one- or two-tailed Student t test. ns, not significant.
Figure 6.
Figure 6.
Antitumor CD4 Th1 immunity induces immune recognition of DCCs. A and B, Heatmaps showing differential expression of chemokine and chemokine receptor gene signatures in DCCs of BALB-neuT mice (A) and patients with HER2+ breast cancer (B) treated with or without CD4 Th1 cytokine IFN-γ analyzed by RNA sequencing (n = 2–3/group). C and D, Differential expression of antigen presentation genes in DCCs from BALB-neuT mice (C) and patients with HER2+ breast cancer (D) treated with or without CD4 Th1 cytokine IFN-γ analyzed by RNA sequencing (n = 2–3/group). E, MHC I (left) and MHC II (right) expressions in DCCs of BALB-neuT mice by flow cytometry (n = 3). F, CD1d+ population in DCCs of BALB-neuT mice, early lesion tumor cells of BALB-neuT mice, and metastatic TUBO cells analyzed by flow cytometry (n = 3–5/group). G, CD1d+ population in DCCs of BALB-neuT mice treated with or without IFN-γ determined by flow cytometry. H, The percentage of CD1d+ DCCs from G (n = 5–6/group). I, Mean fluorescence intensity (MFI) of CD1d from G and H (n = 5–6/group). J, Infiltration of CD45+CD3+CD1d tetramer+ iNKT cells in the BM of experimental BALB-neuT mice analyzed by flow cytometry (n = 3–4/group). K, Infiltration of CD45+CD3CD49b (DX-5)+ NK cells in the BM of experimental BALB-neuT mice analyzed by flow cytometry (n = 5–6/group). L, CD45+CD19+ B cell infiltration in the BM of experimental BALB-neuT mice analyzed by flow cytometry (n = 5–6/group). M, The frequency of CD45+CD19+ B cells from L (n = 5–6/group). Mean ± SEM represented. Means were statistically compared by one-way ANOVA with Tukey multiple comparisons test and one- or two-tailed Student t test. SSC-A, side scatter area.
Figure 7.
Figure 7.
CD4 Th1 cytokine IFN-γ inhibits tumorigenic and metastatic potential of DCCs. A, Representative bright-field images of mammospheres formed in DCCs of BALB-neuT mice and TUBO cells treated with or without IFN-γ. Scale bars, 1 mm. B, Quantification of mammospheres formed in DCCs of BALB-neuT mice treated with or without IFN-γ from (A) (n = 3/group). C, Quantification of mammospheres formed in TUBO cells treated with or without IFN-γ from (A) (n = 3/group). D, Heatmap showing differential expression of cell adhesion genes in DCCs of BALB-neuT mice treated with or without IFN-γ analyzed by RNA sequencing (n = 2/group). E and F, SA-β-gal staining for the detection (E) and frequency (F) of senescent DCCs in BALB-neuT mice–derived DCCs (n = 3–4/group). Scale bars, 500 μm. G–I, Mammospheres formed (G) and their quantification from DCCs of patients with HER2+ breast cancer (BC) (H) and JIMT-1 cells (I; n = 3/group). Scale bars, 1 mm. J, Immunoblots for HER2, p-HER2, NR2F1, and Wnt4 proteins in DCCs of patients with HER2+ BC. K and L, Heatmaps showing differential expression of genes related to progesterone signaling (K) and cell adhesion (L) in DCCs of patients with HER2+ BC analyzed by RNA sequencing (n = 3/group). M and N, SA-β-gal staining for the detection (M) and percentage (N) of senescent DCCs in patients with HER2+ BC–derived DCCs treated with or without IFN-γ (n = 12–15/group). Scale bars, 500 μm. O and P, Detection (O) and frequency (P) of apoptosis after IFN-γ treatment in DCCs of patients with HER2+ BC (n = 3/group). Q, Tumor growth curves of NSG mice (n = 2/group). Mean ± SEM represented. P values were determined by one- or two-tailed Student t test.

Similar articles

Cited by

  • Intratumoral Immunotherapy in Breast Cancer.
    Baumrucker CC, Harris N, Hoover S, Czerniecki BJ. Baumrucker CC, et al. Vaccines (Basel). 2025 Apr 19;13(4):429. doi: 10.3390/vaccines13040429. Vaccines (Basel). 2025. PMID: 40333343 Free PMC article. Review.

References

    1. Röcken M. Early tumor dissemination, but late metastasis: insights into tumor dormancy. J Clin Invest 2010;120:1800–3. - PMC - PubMed
    1. Kang Y, Pantel K. Tumor cell dissemination: emerging biological insights from animal models and cancer patients. Cancer Cell 2013;23:573–81. - PMC - PubMed
    1. Braun S, Vogl FD, Naume B, Janni W, Osborne MP, Coombes RC, et al. . A pooled analysis of bone marrow micrometastasis in breast cancer. N Engl J Med 2005;353:793–802. - PubMed
    1. Hartkopf AD, Brucker SY, Taran FA, Harbeck N, von Au A, Naume B, et al. . Disseminated tumour cells from the bone marrow of early breast cancer patients: results from an international pooled analysis. Eur J Cancer 2021;154:128–37. - PubMed
    1. Hartkopf AD, Wallwiener M, Fehm TN, Hahn M, Walter CB, Gruber I, et al. . Disseminated tumor cells from the bone marrow of patients with nonmetastatic primary breast cancer are predictive of locoregional relapse. Ann Oncol 2015;26:1155–60. - PubMed