. 2025 Jun;21(24):e2502460.
doi: 10.1002/smll.202502460. Epub 2025 Apr 18.

Operando Measurement of Transition Metal Deposition in a NMC Li-Ion Battery Using Laboratory Confocal Micro-X-ray Fluorescence Spectroscopy

Affiliations

Operando Measurement of Transition Metal Deposition in a NMC Li-Ion Battery Using Laboratory Confocal Micro-X-ray Fluorescence Spectroscopy

Ioanna Mantouvalou et al. Small. 2025 Jun.

Abstract

The degradation of batteries has very different causes depending on the material and operation modes. However, most of these causes are associated with changes in one or more interfaces, in particular through depositions and their potential chemical changes under operating conditions. Over the last decade operando investigations have therefore become increasingly state-of-the-art, elemental analysis of full cell systems, though, is still missing due to a lack of depth resolved methods. Using laboratory confocal micro-X-ray fluorescence spectroscopy the analysis of a Li-ion battery coin cell during 10600 cycles are presented. It is shown that the confocal setup enables to differentiate between the nickel-manganese-cobalt-oxide (NMC) cathode with high levels of transition metal concentration and a possible deposition of traces of Mn, Ni, Co in the underlying layers. This allows for spatially resolved insights in operando without changing the layer stack, nor electrode area. This paper is the first to demonstrate the non-destructive and quantitative elemental analysis of battery interfaces under operating conditions. This quantitative analysis is the prerequisite for the determination of absolute transport and conversion rates, without which the transition from empirical research to a focused development of batteries will not succeed.

Keywords: CR2032 coin cell; NMC Li ion batteries; confocal micro X‐ray fluorescence; non‐destructive testing; operando elemental investigations.


Conflict of interest statement

The authors declare no conflict of interest.

Figures

Figure 1
Figure 1
Schematic view of the cell architecture and the confocal setup with probing volume. Depth profiling measurements are conducted by measuring CMXRF spectra at positions relative to the surface.
Figure 2
Figure 2
Example of an operando depth profile measurement obtained with the BLiX CMXRF spectrometer. a) CMXRF spectra at three selected depth positions: at the HOPG window, in the NMC cathode and in the Cu back contact. b) 2D map of the CMXRF spectra in the energetic region between the Ar K and Cu K fluorescence lines as a function of relative depth (intensity is given in cps). c) Depth profiles of the individual fluorescence peaks are the net peak intensities as a function of relative depth. The different layers of the NMC coin cell are attributed to the elemental signals.
Figure 3
Figure 3
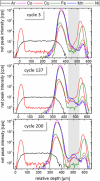
Three depth profiling measurements in the first 3 weeks (after 3d 19 h (cycle 3), 17d 21 h (cycle 136) and 22d 15 h (cycle 199)) show a clear change of shape of the TM depth profiles between the NMC cathode and the Cu back contact. The area of the separator/carbon anode is marked with grey.
Figure 4
Figure 4
All Ar K and Mn K depth profiles over a duration of 6 weeks: a) The Ar K fluorescence depth profiles show an overall decrease of Ar and a reduction of the thickness of the Ar bubble; b). In the Mn K depth profiles a separation of the layers is visible (green arrow) with a gap forming between separator and carbon anode (orange arrow). The Mn K intensity in the carbon anode increases by a factor of 4 (blue arrow). The inset shows the first and last depth profile as well as two examples shown in Figure 3.
Figure 5
Figure 5
: top left: video image of the hole in the casing and window with crystallized electrolyte. Top right: Laboratory MXRF measurements of the cell post mortem (scale bar = 2 mm, net peak intensities in cps). The Fe K distribution highlights the cells casing, the Ti K, P K, Cr K and Fe K distributions show the location of the crystallized electrolyte, the Ni K, Co K, Mn K and Cu K distribution seem similar in the MXRF images; bottom: 3D rendering of the area marked in grey in the Ti K MXRF map measured with CMXRF. The grey arrow points to the gap forming between separator and carbon anode.
Figure 6
Figure 6
a) Video image and laboratory MXRF mapping of the carbon anode on top of the Cu foil (scale bar = 2 mm, net peak intensities in cps). b) In 5 areas (marked with yellow dots in a) 3×3 CMXRF depth profiles were measured. The Mn and Fe K signals vary significantly. c) Quantitative XRF measurements performed at the PTB laboratories of BESSY II result in absolute Mn mass depositions in µg/cm2 in the middle part of the anode. (scale bar = 2 mm).
Figure 7
Figure 7
: left: Comparison of two depth profiling measurements on roughly the same lateral position with the laboratory M4 spectrometer and using synchrotron radiation at the PTB laboratory at BESSY II. The exemplary Mn K, Fe K and Cu K measurements demonstrate that the depth resolution is enhanced with monochromatic excitation and adapted optics, right: Example of CMXANES spectra obtained with 200 µm depth separation. The two Mn K CMXANES measurements (insets) were obtained at the two depth positions marked with grey in the Mn K fluorescence depth profile.
Figure 8
Figure 8
a) Photo of the BLiX CMXRF setup with potentiostat which was used for the operando measurements. b) Detail of the sample holder with 4 coin cells inside the measurement chamber. c) Picture from the side. The tips of both polycapillary lenses can be seen as well as the holder with the coin cell, demonstrating the small working distance.

References

    1. Tarascon J.‐M., Armand M., Nature 2001, 414, 359. - PubMed
    1. Jiang X., Ma J., Xiao G., Shao Z., Guo X., Inf. Fusion 2021, 73, 22.
    1. Geldasa F. T., Kebede M. A., Shura M. W., Hone F. G., RSC Adv. 2022, 12, 5891. - PMC - PubMed
    1. Li T., Yuan X.‐Z., Zhang L., Song D., Shi K., Bock C., Electrochem. Energy Rev. 2020, 3, 43.
    1. Jung R., Metzger M., Maglia F., Stinner C., Gasteiger H. A., J. Electrochem. Soc. 2017, 164, A1361 . - PubMed

LinkOut - more resources