. 2025 Apr 22;122(16):e2424474122.
doi: 10.1073/pnas.2424474122. Epub 2025 Apr 18.

The pentameric chloride channel BEST1 is activated by extracellular GABA

Affiliations

The pentameric chloride channel BEST1 is activated by extracellular GABA

Swati Pant et al. Proc Natl Acad Sci U S A. .

Abstract

Bestrophin-1 (BEST1) is a chloride channel expressed in the eye and other tissues of the body. A link between BEST1 and the principal inhibitory neurotransmitter γ-aminobutyric acid (GABA) has been proposed. The most appreciated receptors for extracellular GABA are the GABAB G-protein-coupled receptors and the pentameric GABAA chloride channels, both of which have fundamental roles in the central nervous system. Here, we demonstrate that BEST1 is directly activated by GABA. Through functional studies and atomic-resolution structures of human and chicken BEST1, we identify a GABA binding site on the channel's extracellular side and determine the mechanism by which GABA binding stabilizes opening of the channel's central gate. This same gate, "the neck," is activated by intracellular [Ca2+], indicating that BEST1 is controlled by ligands from both sides of the membrane. The studies demonstrate that BEST1, which shares no structural homology with GABAA receptors, is a GABA-activated chloride channel. The physiological implications of this finding remain to be studied.

Keywords: GABA; activation; bestrophin; chloride channel; receptor.


Conflict of interest statement

Competing interests statement:The authors declare no competing interest.

Figures

Fig. 1.
Fig. 1.
GABA augments Cl flow through BEST1. A schematic of the flux assay is shown in SI Appendix, Fig. S1A. A decrease in fluorescence indicates anion flow. (A) Experiment testing the effect of GABA. The addition of GABA enhances Cl flux through cBEST1. On its own, GABA does not cause a decrease in fluorescence. Empty liposomes (i.e., liposomes without cBEST1) are shown as controls. (B) GABA increases Cl flux through cBEST1 in a dose-dependent manner. (C–E) Among endogenous molecules tested, only GABA dramatically enhances Cl flux. (F) Analogous experiment to (A) for hBEST1, showing that GABA potentiates Cl flux.
Fig. 2.
Fig. 2.
Whole-cell patch-clamp electrophysiology indicates that extracellular GABA activates hBEST1. All recordings use a pipette solution containing [Ca2+]free ~ 10 nM. (A) Voltage protocol using a train of 0.5 s voltage ramps from −100 mV to +100 mV with a −60 mV holding potential, repeated every 2 s. (B) GFP and (C) hBEST1-transfected HEK293T representative time courses during external 30 mM GABA applications (by perfusion) using the voltage protocol shown in (A). Blue circles represent mean current at −100 mV (Bottom) or +100 mV (Top). Pink horizontal bars show GABA application duration. The dotted black line denotes zero current level. For time courses, GFP n = 3, hBEST1 n = 7. (D) Normalized I-V of hBEST1 in the absence (black) and presence (pink) of external 30 mM GABA. Data are derived from (C). Darker curves are the mean and lighter colored envelopes are SEM, n = 7. “ctrl” denotes the experiment without GABA. (E) hBEST1 reversal potentials without and with 30 mM GABA. The reversal potential without GABA (ctrl) was 0.8 ± 0.8 mV; with 30 mM GABA it was 1.9 ± 1.2 mV. Horizontal bars represent mean; error bars represent SEM, n = 7. (F) Representative hBEST1 time course with indicated external GABA concentrations. 10 mM GABA was applied between each tested concentrations to control for rundown. (G) GABA dose–response curve. Currents observed for a given GABA concentration [from recordings analogous to (F)] were normalized to the subsequent current observed using 10 mM GABA. Circles indicate individual experiments, with the mean and SEM error bars shown, n = 8. (H) Representative time course with applications of 30 mM GABA and 30 mM glycine, using the same conditions as (C), n = 12.
Fig. 3.
Fig. 3.
Bilayer electrophysiology shows that GABA potentiates Cl current through cBEST1. (A) Current-voltage (I-V) relationship indicates that GABA increases BEST1 currents. Symmetric conditions were used, such that both chambers contain 30 mM KCl. Increasing amounts of GABA were added to both chambers during the experiment. (B) GABA dose–response curve. Currents observed at 100 mV at different GABA concentrations from (A) were plotted as fraction of current observed with 30 mM GABA at 100 mV. Data from five separate experiments, denoted by different symbols, were used to calculate half maximal concentration (EC50), Hill coefficient, and SE by fitting the data to a standard agonist activation function (SI Appendix, Materials and Methods). (C) Addition of GABA does not shift the reversal potential. The experiment was done in symmetric 30 mM KCl. Increasing amounts of GABA were added to only the cis chamber. (D) GABA does not change the channel’s selectivity for anions over cations. Asymmetric KCl conditions were used, in which the cis-chamber contains 30 mM KCl and the trans-chamber contains 10 mM KCl. Increasing amounts of GABA were added to both chambers. Permeability ratios (PK/PCl) at 0 mM GABA and 80 mM GABA were calculated using the Goldman–Hodgkin–Katz equation; three separate experiments were used to calculate associated SE. Representative I-V graphs are shown in A, C, and D; current traces for these are shown in SI Appendix, Fig. S3. All recordings use solutions containing [Ca2+]free ~ 170 nM.
Fig. 4.
Fig. 4.
Cryo-EM structures of Ca2+-bound hBEST1. (A and B) Cryo-EM reconstructions of hBEST1 without GABA represent an inactivated state (A) and an open state (B). Left panels show views from the side; right panels show slices of the map from the extracellular side to highlight the widening of the neck in the open structure. (C) Overall architecture of inactivated hBEST1. α helices are depicted as cylinders and each subunit is colored differently. Approximate boundaries of a lipid membrane are indicated. (D and E) Cutaway views of the inactivated (D) and open (E) conformations of hBEST1. The ion conduction pore is depicted as a gray surface representing the minimal radial distance from the center of the pore to the nearest van der Waals contact. The neck and aperture regions are indicated (dashed boxes). Two subunits are shown for clarity. (F) Superimposed individual subunits from the inactivated and open structures highlight the difference in conformation of the neck (boxed region). The inactivation peptide, labeled, is ordered in the inactivated structure but disordered in the open structure.
Fig. 5.
Fig. 5.
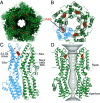
GABA-bound structure of hBEST1 in an open conformation. (A) 2.45 Å resolution cryo-EM map. Densities corresponding to GABA are colored orange. The view is a slice shown from the extracellular side, highlighting the open neck of the pore at the center. (B) Analogous view, showing a cartoon representation of the atomic model. GABA molecules are represented as orange spheres. One subunit is colored blue to highlight the binding of GABA at the interface between two subunits. (C) Side view of two adjacent subunits. GABA interacts with a portion of helix S2a from one subunit (green) and with the S3-S4 linker and amino-terminal end of the S4a helix from the adjacent subunit (blue). (D) Cutaway view of the GABA complex showing the pore (gray) and highlighting the binding of GABA adjacent to the pore within the outer entryway. The aperture adopts the same conformation in all structures of BEST1.
Fig. 6.
Fig. 6.
GABA binding site. One of the five identical binding sites for GABA is shown in each panel, with one subunit colored blue and the adjacent subunit green. (A and B) Cryo-EM densities from structures of the GABA-bound open conformations of hBEST1 (A) and cBEST1345 (B). Density is shown as a semitransparent surface. The atomic models are shown as sticks, with GABA colored orange. (C) Depiction of the GABA binding pocket, showing the cavity formed by the protein as a semitransparent surface. (D) Detailed interactions with GABA. The structure of hBEST1 with GABA is shown (the binding site in cBEST1345 is analogous, SI Appendix, Fig. S14). The atomic model is drawn as cartoons and sticks. Hydrogen bonds are depicted as dashed lines. Two ordered water molecules are shown as red spheres. Protein backbone atoms that form hydrogen bonds with GABA are designated by parentheses. Oxygen atoms are red; nitrogen atoms are dark blue.
Fig. 7.
Fig. 7.
The GABA switch allosterically controls gating of the neck. (A–C) Comparison of cryo-EM structures of hBEST1 in the GABA-bound open conformation (A), the GABA-bound intermediate conformation (B), and the inactivated conformation in the absence of GABA (C). The structures are depicted as cartoons, with certain amino acids drawn as sticks. The view is from the extracellular side, to highlight the dimensions of the neck. GABA molecules are depicted in sphere representation (orange). The S3-S4 linker is blue, the GABA switch (Tyr72-Pro77) is red, and Phe80 and Phe84 of the neck are green. Ca2+ ions are shown as faded green spheres. (D–F) close-up view of the GABA binding site, the GABA switch, and the neck from the structures. In each panel, the GABA switch and neck helix (S2b) from two adjacent subunits (labeled A and B) are shown, but only one S3b-S4a region is drawn (from subunit A). In the open conformation (D), GABA is bound at all five sites, and the GABA switches and neck helices uniformly adopt their open conformations. In the inactivated conformation (F), the neck and GABA switch regions adopt their closed conformations. The intermediate (E) is a structural hybrid. The GABA switch to which GABA binds (subunit B) adopts a GABA-bound conformation. The other GABA switch (subunit A) adopts a closed conformation. The neck of the intermediate is narrow (B), with similar radial dimension to the inactivated state, due to the positioning of Phe80 and Phe84.
Fig. 8.
Fig. 8.
Gating. A schematic of the channel is shown. The neck serves as the gate of the channel. It is allosterically controlled by three inputs (arrows): Ca2+ binding to the cytosolic Ca2+ clasp sensor, binding of the inactivation peptide to a cytosolic receptor on the channel, and GABA binding within the outer entryway of the pore. The aperture does not function as a gate, but rather acts as a size-selective filter to govern the size of anions that can flow through the channel.

Update of

References

    1. Devi L. A., Fricker L. D., “Transmitters and peptides: Basic principles” in Neuroscience in the 21st Century: From Basic to Clinical, Pfaff D. W., Volkow N. D., Rubenstein J. L., Eds. (Springer International Publishing, Cham, 2022), pp. 2059–2075, 10.1007/978-3-030-88832-9_51. - DOI
    1. Shaye H., Stauch B., Gati C., Cherezov V., Molecular mechanisms of metabotropic GABA(B) receptor function. Sci. Adv. 7, eabg3362 (2021). - PMC - PubMed
    1. Kim J. J., Hibbs R. E., Direct Structural Insights into GABA(A) Receptor Pharmacology. Trends Biochem. Sci. 46, 502–517 (2021). - PMC - PubMed
    1. Simon J., Wakimoto H., Fujita N., Lalande M., Barnard E. A., Analysis of the set of GABA(A) receptor genes in the human genome. J. Biol. Chem. 279, 41422–41435 (2004). - PubMed
    1. Olsen R. W., Sieghart W., International Union of Pharmacology. LXX. Subtypes of gamma-aminobutyric acid(A) receptors: Classification on the basis of subunit composition, pharmacology, and function. Update. Pharmacol. Rev. 60, 243–260 (2008). - PMC - PubMed

LinkOut - more resources