. 2025 Apr 18;11(16):eadw1489.
doi: 10.1126/sciadv.adw1489. Epub 2025 Apr 18.

Molecular basis of pyruvate transport and inhibition of the human mitochondrial pyruvate carrier

Affiliations

Molecular basis of pyruvate transport and inhibition of the human mitochondrial pyruvate carrier

Maximilian Sichrovsky et al. Sci Adv. .

Abstract

The mitochondrial pyruvate carrier transports pyruvate, produced by glycolysis from sugar molecules, into the mitochondrial matrix, as a crucial transport step in eukaryotic energy metabolism. The carrier is a drug target for the treatment of cancers, diabetes mellitus, neurodegeneration, and metabolic dysfunction-associated steatotic liver disease. We have solved the structure of the human MPC1L/MPC2 heterodimer in the inward- and outward-open states by cryo-electron microscopy, revealing its alternating access rocker-switch mechanism. The carrier has a central binding site for pyruvate, which contains an essential lysine and histidine residue, important for its ΔpH-dependent transport mechanism. We have also determined the binding poses of three chemically distinct inhibitor classes, which exploit the same binding site in the outward-open state by mimicking pyruvate interactions and by using aromatic stacking interactions.


Figures

Fig. 1.
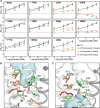
Fig. 1.. Human MPC in the outward-open and inward-open states.
(A to C) MPC in the mitoglitazone-bound outward-open state. (A) Lateral (left) and cytoplasmic views (right) of the structure. Amphipathic helices (AH) and linker helices (LH) are colored gray, transmembrane helix 1 (H1) is colored blue, helix 2 (H2) is colored yellow, helix 3 (H3) is colored red, and the 310 helix is colored green. The surface is indicated. Lighter colors and labels are used for MPC2. (B) Key residues are shown in stick representation, colored by the Zappo scheme and labeled in black (MPC1L) or gray (MPC2). Residues L38, M57, and L61 from MPC1 and L52, L75, and V103 from MPC2 are shown in pink but are not labeled. The water-accessible cavity is shown in cyan. (C) Cross section through MPC showing the central cavity and (D) close-up of the cavity, viewed from the intermembrane space. The surface is colored by electrostatic potential, as shown in the color ramp. K49 and H86 are in stick representation. The view is rotated compared to (B). (E to H) MPC in the apo inward-open state. (E) Lateral (left) and cytoplasmic views (right). Color scheme as in (A). (F) Key residues and water-accessible cavity, shown as in (B). (G) Central cavity and (H) close-up of the cavity, viewed from the matrix, as in (C) and (D).
Fig. 2.
Fig. 2.. The dynamic motions of the MPC.
(A) Alignment of human MPC in the outward-open state (colored cartoon) and inward-open state (outline). (B) Overview of MPC1L in the outward-open (colored cartoon) and inward-open (outline) states before (left) and after (right) alignment of H2 and H3, viewed down the rotation axis (black dot and curved arrow). Residues flanking the hinge region in H1 are shown in stick representation and are labeled. (C) Overview of MPC2 in the outward-open (colored cartoon) and inward-open (outline) states before (left) and after (right) alignment of H2 and H3, as in (B). (D) Dynamics of human MPC1L/MPC2 modeled with AlphaFold 2.0. Dots represent individual models clustered according to the degree of inward and outward closure with the occluded states in the middle. Each most centrally located model of the cluster is depicted with a black dot and labeled with the color of their cluster. The models closest to the experimentally determined structures are indicated with a red triangle. The structures of the center of three clusters are also shown. (E) Dynamics of human MPC1/MPC2, as in (D).
Fig. 3.
Fig. 3.. Mapping the location of the pyruvate binding site.
(A) Screening of cavity residues for pyruvate binding. Thermostability shifts (∆Tm) for wild-type MPC (black line) and 11 single alanine replacement mutants (colored lines, legend) are shown in the presence of 10, 40, 80, and 160 mM pyruvate. Error bars show SD across three biological replicates [not significant (NS), P > 0.05; *P < 0.05; **P < 0.01; ***P < 0.001; ****P < 0.0001]. WT, wild type; MT, mutant. Pyruvate-binding site in the (B) outward-open state and (C) inward-open state with residues colored according to their importance for binding, as in (A). MPC1L and MPC2 are shown as dark and light gray cartoons, respectively. The water-accessible cavities are shown as blue surfaces.
Fig. 4.
Fig. 4.. The pH dependency of pyruvate binding.
Pyruvate binding to wild-type MPC1L/MPC2 in a range of pH values, measured by nanoDSF. (A) Apparent melting temperatures (Tm) and (B) thermostability shift (∆Tm) at 80 mM pyruvate. Error bars show SD across four biological replicates. †††P < 0.001 and ††††P < 0.0001 compared to ∆Tm at pH 5.0; #P < 0.05, ##P < 0.01, ###P < 0.001 compared to ∆Tm at pH 5.5. (C and D) Docking studies of pyruvate (PYR) in the representative occluded state of MPC1L/MPC2 (fig. S17), with H86 either protonated (C) or neutral (D). Residues are colored according to the Zappo scheme with salt bridge and hydrogen bond interactions shown as green and yellow dashed lines, respectively.
Fig. 5.
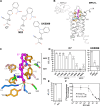
Fig. 5.. The binding site of a UK5099 analog.
(A) Chemical structures of UK5099, its derivative C7 and compound M23, with stereochemistry indicated. (B) Overview of the inhibitor-binding site. MPC is shown as a cartoon, with MPC1L in dark gray and MPC2 in light gray. Helices and N and C termini of MPC1L and MPC2 are labeled. C7 is shown with magenta carbon atoms. Amino acid residues forming the binding pocket are shown in stick representation with the Zappo color scheme. (C) Detailed view of the binding site with salt bridge, hydrogen bond, and hydrophobic π-stacking interactions as green, yellow, and black dashed lines, respectively. Key features of the inhibitor are indicated: PM, pyruvate-mimic; AR1, aromatic ring 1; AR2, aromatic ring 2. (D and E) Thermostability shift assays in the presence of 100 μM inhibitor. The temperature shift (ΔTm) is the apparent melting temperature in the presence of a compound minus the apparent melting temperature in the absence of compound. The data represent the mean and SD of three independent experiments: ***P < 0.001; ****P < 0.0001; NS, P > 0.05. (F) Inhibition of [14C]-pyruvate exchange in MPC1L/MPC2 proteoliposomes by compound M23. The data represent the mean and SD of three independent experiments.
Fig. 6.
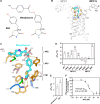
Fig. 6.. The binding site of the TZD mitoglitazone.
(A) Structure of mitoglitazone and the shorter TZD (E)-5-(4-hydroxybenzylidene) thiazolidine-2,4-dione (M20), with stereochemistry indicated. (B) Overview of the inhibitor-binding site, as in Fig. 4B. (S)-mitoglitazone is shown with cyan carbon atoms. (C) Detailed view of the binding site, with hydrogen bonds shown as yellow dashed lines and hydrophobic π-stacking interactions as black dashed lines, as in Fig. 4C. (D and E) Thermostability shift assays in the presence or absence of 100 μM inhibitor, shown as in Fig. 4 (D and E). ***P < 0.001, ****P < 0.0001 (F) Inhibition of [14C]-pyruvate exchange in MPC1L/MPC2 proteoliposomes by compound M20, shown as in Fig. 4F. The data represent the mean and SD of three independent experiments.
Fig. 7.
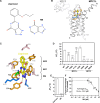
Fig. 7.. The binding site of zaprinast.
(A) Chemical structure of zaprinast and the derivative M8. (B) Overview of the inhibitor-binding site, shown as in Fig. 4B. Zaprinast is shown with yellow carbon atoms. (C) Detailed view of the binding site, with hydrogen bonds shown as yellow dashed lines, and hydrophobic π-stacking interactions as black dashed lines, as in Fig. 4C. (D and E) Thermostability shift assays in the presence or absence of 100 μM inhibitor, as in Fig. 4 (D and E). *P < 0.05, ****P < 0.0001 (F) Inhibition of [14C]-pyruvate exchange in MPC1L/MPC2 proteoliposomes by compound M8, shown as in Fig. 4F. The data represent the mean and SD of three independent experiments.
Fig. 8.
Fig. 8.. ΔpH-dependent transport mechanism of the MPC.
Schematic representation of the pH-dependent pyruvate import mechanism in six stages. The two subunits of MPC are shown schematically with MPC1L in a darker shade and MPC2 in a lighter shade. The circles represent the N-terminal amphipathic helices, which are in the intermembrane space. IMS, intermembrane space; IMM, inner mitochondrial membrane; MM, mitochondrial matrix. The essential residues for pyruvate binding, K49 and H86 (blue), and the substrate (orange) are schematically represented to show their proposed roles.
Fig. 9.
Fig. 9.. Common principles of inhibitor binding to the MPC.
(A) Overlay of human MPC inhibited by C7 (magenta), mitoglitazone (cyan), and zaprinast (yellow). PM, pyruvate mimic; AR1, first aromatic ring; AR2, second aromatic ring. (B) Close-up view of the PM region. Y64 and H86 (MPC1L) and K49 (MPC2) act as hydrogen bond donors (single arrowhead) or donors/acceptors (double arrowhead). K49 and H86 can also interact via salt bridges, depending upon the inhibitor chemistry.

References

    1. Tavoulari S., Sichrovsky M., Kunji E. R. S., Fifty years of the mitochondrial pyruvate carrier: New insights into its structure, function, and inhibition. Acta Physiol (Oxf.) 238, e14016 (2023). - PMC - PubMed
    1. Bricker D. K., Taylor E. B., Schell J. C., Orsak T., Boutron A., Chen Y. C., Cox J. E., Cardon C. M., Van Vranken J. G., Dephoure N., Redin C., Boudina S., Gygi S. P., Brivet M., Thummel C. S., Rutter J., A mitochondrial pyruvate carrier required for pyruvate uptake in yeast, Drosophila, and humans. Science 337, 96–100 (2012). - PMC - PubMed
    1. Bolsterli B. K., Boltshauser E., Palmieri L., Spenger J., Brunner-Krainz M., Distelmaier F., Freisinger P., Geis T., Gropman A. L., Haberle J., Hentschel J., Jeandidier B., Karall D., Keren B., Klabunde-Cherwon A., Konstantopoulou V., Kottke R., Lasorsa F. M., Makowski C., Mignot C., O'Gorman Tuura R., Porcelli V., Santer R., Sen K., Steinbrucker K., Syrbe S., Wagner M., Ziegler A., Zoggeler T., Mayr J. A., Prokisch H., Wortmann S. B., Ketogenic diet treatment of defects in the mitochondrial malate aspartate shuttle and pyruvate carrier. Nutrients 14, 3605 (2022). - PMC - PubMed
    1. Pujol C., Lebigot E., Gaignard P., Galai S., Kraoua I., Bault J. P., Dard R., Youssef-Turki I. B., Omar S., Boutron A., Wai T., Slama A., MPC2 variants disrupt mitochondrial pyruvate metabolism and cause an early-onset mitochondriopathy. Brain 146, 858–864 (2023). - PMC - PubMed
    1. Klingenberg M., Mitochondria metabolite transport. FEBS Lett. 6, 145–154 (1970). - PubMed

MeSH terms

LinkOut - more resources