. 2025 Apr 18;11(16):eads6830.
doi: 10.1126/sciadv.ads6830. Epub 2025 Apr 18.

Spatial analysis of mitochondrial gene expression reveals dynamic translation hubs and remodeling in stress

Affiliations

Spatial analysis of mitochondrial gene expression reveals dynamic translation hubs and remodeling in stress

Adam Begeman et al. Sci Adv. .

Abstract

Protein- and RNA-rich bodies contribute to the spatial organization of gene expression in the cell and are also sites of quality control critical to cell fitness. In most eukaryotes, mitochondria harbor their own genome, and all steps of mitochondrial gene expression co-occur within a single compartment-the matrix. Here, we report that processed mitochondrial RNAs are consolidated into micrometer-scale translation hubs distal to mitochondrial DNA transcription and RNA processing sites in human cells. We find that, during stress, mitochondrial messenger and ribosomal RNA are sequestered in mesoscale bodies containing mitoribosome components, concurrent with suppression of active translation. Stress bodies are triggered by proteotoxic stress downstream of double-stranded RNA accumulation in cells lacking unwinding activity of the highly conserved helicase SUPV3L1/SUV3. We propose that the spatial organization of nascent polypeptide synthesis into discrete domains serves to throttle the flow of genetic information to support recovery of mitochondrial quality control.


Figures
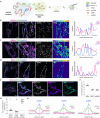
Fig. 1.
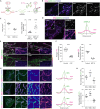
Fig. 1.. Processed mtRNA is excluded from nucleoids and MRGs.
(A) Overview of mammalian mitochondrial gene expression pathway and motivating questions of this study. (B) Representative images and linescans of fixed IMR90 cells immunolabeled with antibodies against TOM20 (green), dsDNA (blue), and RNA-FISH targeting mitoribosomal component RNR2 (magenta), (C) mitochondrial tRNAs (magenta), or (D) ND4 mRNA (magenta). Scale bars, 5 μm and 1 μm in zoom. (E) IMR90 cell immunolabeled with antibodies against GRSF1 (green), dsDNA (blue), and RNA-FISH targeting ND4 mRNA (magenta). Scale bars, 5 μm; 1 μm in zoom. (F) Comparison of the density of ND4-FISH, anti-GRSF1, and anti-dsDNA foci normalized to a mitochondrial area (n = 10 fields of view containing 28 cells). (G) The frequency of total ND4-FISH, anti-GRSF1, and anti-dsDNA foci that overlap by 20% or more in maximum intensity projections in pairwise comparison. Dotted line represents the frequency of overlap expected by random chance, given the foci density along mitochondrial tubules. (****P < 0.0001, **P < 0.01, and *P < 0.05, one-sided t test). (H) Iterative linescan analyses showing normalized intensity values of GRSF1 and RNA localization relative to mtDNA nucleoids marked by anti-dsDNA immunofluorescence and RNA-FISH labeling: RNR2 (n = 1392 nucleoids from 21 cells); tRNA (n = 1020 nucleoids from 13 cells); ND4 (n = 1211 nucleoids from 26 cells).
Fig. 2.
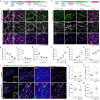
Fig. 2.. Processed mtRNA marks local translation hubs.
(A) Metabolic labeling of mitochondrial translation. (B) Fixed IMR90 cells immunolabeled with antibodies against TOM20 (blue), MRPL23 (green), and RNA-FISH targeting ND4 mRNA (magenta). (C) Left: Comparison of ND4-FISH and anti-MRPL23 foci density. Right: Frequency of ND4-FISH and anti-MRPL23 foci overlap greater than expected by random chance. ****P < 0.0001, one-sided t test (n = 10 fields of view; 34 cells). (D) Left: IMR90 cell fixed and immunolabeled to detect MRPL23 (green) and TOM20 (blue) after a 15-min pulse of 50 μM HPG (magenta). Right: Iterative linescan analysis showing normalized intensity values of MRPL23 (n = 4048 foci; 40 cells) and ND4-FISH fluorescence intensity. (E) Left: Average HPG fluorescence intensity in control cells versus CAP. Right: Average HPG fluorescence intensity in control cells versus IMT1B. (F) Quantification of (E). ****P < 0.0001 and ***P < 0.001, Mann-Whitney test. (Left) control: n = 10 fields of view; 39 cells, CAP: n = 10 fields of view; 49 cells; (right) dimethyl sulfoxide (DMSO): n = 10 fields of view; 44 cells, IMT1B: n = 6 fields of view; 25 cells. (G) Visualization of HPG fluorescence intensity (green) relative to RNA-FISH (magenta) targeting ND4 mRNA (top), RNR2 (middle), or mitochondrial tRNAs (bottom). (Right) Iterative linescans analyses showing normalized RNA intensity values (magenta) relative to HPG foci (green): ND4 (n = 3870 HPG foci; 44 cells); RNR2 (n = 4052 foci; 36 cells); tRNA (n = 4522 foci; 41 cells). (H) Top: Proportion of segmented RNA foci that overlap with HPG foci by 20% or more (bottom). Frequency of RNA and HPG foci overlap greater than expected by random chance. (ND4: n = 10 fields of view; 38 cells; RNR2: n = 10 fields of view; 34 cells; tRNAs: n = 10 fields of view; 33 cells) ****P < 0.0001, one-sided t test. Scale bars, 5 μm; 1 μm in zoom. n.s., not significant.
Fig. 3.
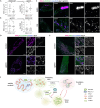
Fig. 3.. Mitochondrial translation hubs are dynamic.
(A) Top: HPG labeling time course with variable chase times. Bottom: IMR90 cells pulse labeled for 15 min with HPG and chased with unlabeled methionine for 5, 15, 30, or 60 min. (B) Density of thresholded HPG domains in each condition. (C) Average size of HPG-labeled domains in each condition. (D) Average above-threshold fluorescence intensity of HPG-labeled domains in each condition (5-min chase: n = 10 fields of view; 39 cells; 15-min chase: n = 10 fields of view 40 cells; 30-min chase: n = 10 fields of view; 30 cells; 1-hour chase: n = 10 fields of view; 28 cells). (E) Top: HPG labeling time course with variable pulse times. Bottom: IMR90 cells pulse labeled for 15, 30, or 60 min with HPG followed by a constant chase in unlabeled methionine for 5 min, relative to control cells incubated in HPG for 15 min concurrent with CAP. (F to H) Quantification of the number of thresholded HPG objects in each condition. (CAP: n = 10 fields of view; 49 cells; 15-min pulse: n = 10 fields of view; 39 cells; 30-min pulse: n = 10 fields of view; 34 cells; 1-hour pulse: n = 10 fields of view; 28 cells). Scale bars, 1 μm. (I) IMR90 cells that were transiently transfected with mCherry-DRP1K38A (grayscale), pulse labeled for 15 min with HPG (green), immunolabeled with an antibody against TOM20 (blue), and RNR2-FISH (magenta). Scale bars, 5 μm; 1 μm in zoom. (J) Average size of thresholded RNR2 signal intensity. (K) Average size of thresholded HPG signal intensity. (L) Average fluorescence intensity of RNR2 signals per thresholded mitochondrion. (M) Average fluorescence intensity of HPG per thresholded mitochondrion (control: n = 22 cells; mCherry-DRP1K38A: n = 16 cells) (**P < 0.01 and *P < 0.05, Mann-Whitney test). OE, over expression.
Fig. 4.
Fig. 4.. mtRNAs remodel into dsRNA-rich mesoscale bodies during stress.
(A) Schematic of mitochondrial transcript unwinding and degradation by SUV3 and PNPase complexes. (B) Representative images of cells immunolabeled for TOM20 (grayscale) and dsRNA (J2; blue/rainbow lookup table) at 4 days versus 7 days of SUV3 depletion. Scale bars, 5 μm. (C) Three representative images of RNA bodies in cells fixed and immunolabeled with antibodies against dsRNA (J2; blue), TOM20 (green), and RNA-FISH targeting RNR2 (magenta). Scale bars, 1 μm.
Fig. 5.
Fig. 5.. Mitochondrial stress body formation coincides with attenuation of mitoribosome translation.
(A) Representative image of control (top) and SUV3-depleted (bottom) cells pulse-labeled with 50 μM HPG for 15 min (green), fixed, and immunolabeled to detect TOM20 (blue) and RNA-FISH against RNR2 (magenta). Scale bars, 1 μm. (B) Average HPG fluorescence intensity in segmented mitochondria in the presence or absence of CAP (50 μg/ml) [(no CAP) control: n = 9 mitochondrial networks, sgSUV3: n = 6 mitochondrial networks; (CAP) control: n = 4 mitochondrial networks, sgSUV3: n = 4 mitochondrial networks]. [**P < 0.01, Kruskal-Wallis test (**P < 0.01), followed by Dunn’s multiple comparisons]. (C) Diagram of proposed impact of SUV3 depletion on dsRNA accumulation and single-stranded RNA reorganization into mitochondrial stress bodies.
Fig. 6.
Fig. 6.. mtRNA remodeling in stress is downstream of active translation.
(A) Average ROI area and fluorescence intensity of segmented RNR2-FISH signals in maximum intensity projections of imaged IMR90 cells when SUV3 depletion is induced in cells after incubation in CAP (50 μg/ml) (DMSO: n = 16, CAP: n = 12). (**P < 0.01, Mann-Whitney test). (B) Average size and fluorescence intensity of segmented RNR2-FISH signals in maximum intensity projections of IMR90 cells incubated in CAP (50 μg/ml), imaged 7 days after transfection with sgSUV3 RNP complexes (DMSO: n = 17, CAP: n = 18). (not significant, Mann-Whitney test). (C) Representative images of control (top) and 50 μM CAP-treated (bottom) cells 7 days after transfection with sgSUV3 RNP complexes, fixed, and immunolabeled to detect dsRNA (J2; blue), TOM20 (green), and RNA-FISH against RNR2 (magenta). Scale bars, 5 μm; 1 μm in zoom. (D) Representative image of control (top) and day 4 sgSUV3 (bottom) cells, fixed, and immunolabeled to detect dsRNA (J2; green), GRSF1 (blue), and RNR2-FISH against RNR2 (magenta). Scale bars, 5 μm; 1 μm in zoom. (E) Representative image of control (top) and day 4 sgSUV3 (bottom) cells, pulse-labeled with 50 μM HPG for 15 min (green), fixed, and immunolabeled to detect dsRNA (J2; blue) and RNA-FISH against RNR2 (magenta). Scale bars, 5 μm; 1 μm in zoom. (F) Proposed model for organization of mitochondrial gene expression into translational hubs and their remodeling during stress.

Update of

References

    1. Suomalainen A., Nunnari J., Mitochondria at the crossroads of health and disease. Cell 187, 2601–2627 (2024). - PubMed
    1. Gustafsson C. M., Falkenberg M., Larsson N.-G., Maintenance and expression of mammalian mitochondrial DNA. Annu. Rev. Biochem. 85, 133–160 (2016). - PubMed
    1. Antonicka H., Sasarman F., Nishimura T., Paupe V., Shoubridge E. A., The mitochondrial RNA-binding protein GRSF1 localizes to RNA granules and is required for posttranscriptional mitochondrial gene expression. Cell Metab. 17, 386–398 (2013). - PubMed
    1. Kakudji E. V., Lewis S. C., Mitochondrial nucleoids. Curr. Biol. 34, R1067–R1068 (2024). - PubMed
    1. Lewis S. C., Uchiyama L. F., Nunnari J., ER-mitochondria contacts couple mtDNA synthesis with mitochondrial division in human cells. Science 353, aaf5549 (2016). - PMC - PubMed