

Perinuclear mitochondrial clustering for mesenchymal-to-epithelial transition in pluripotency induction
- PMID: 40250438
- PMCID: PMC12143155
- DOI: 10.1016/j.stemcr.2025.102474
Perinuclear mitochondrial clustering for mesenchymal-to-epithelial transition in pluripotency induction
Abstract
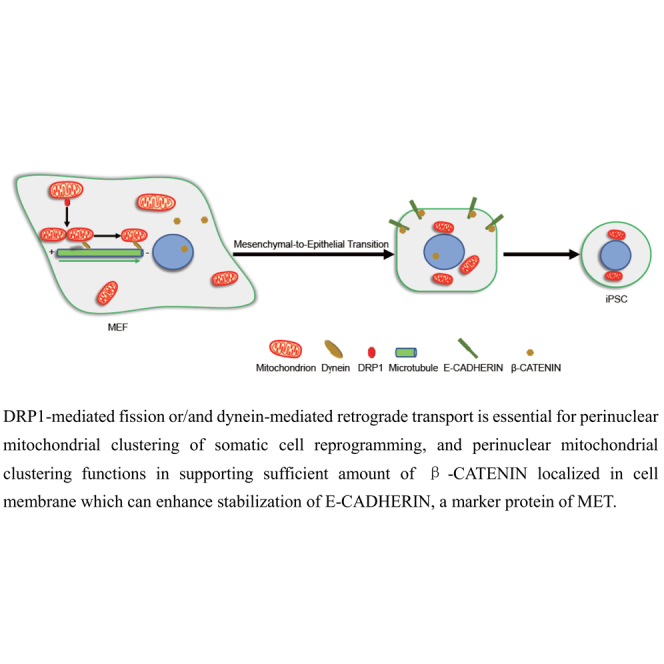
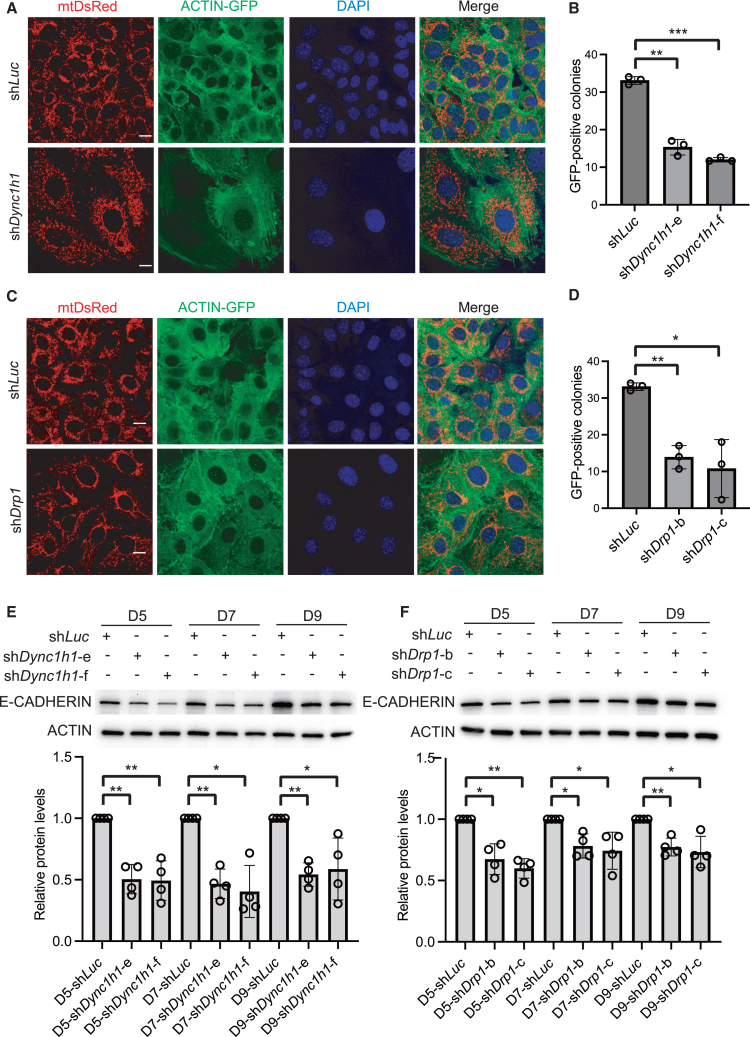
Remodeled mitochondria are characteristic of pluripotent stem cells. However, a role for mitochondrial movement and distribution in pluripotency remains unknown. Here, we show that mitochondrial retrograde transport-mediated perinuclear clustering via dynein complex occurs at the early phase of pluripotency induction. Interestingly, this mitochondrial redistribution is regulated by Yamanaka factor OCT4 but not SOX2 or KLF4. This mitochondrial redistribution, which has effect on the efficiency of somatic cell reprogramming, also depends on DRP1-mediated mitochondrial fission. Importantly, perinuclear mitochondrial clustering is required for mesenchymal-to-epithelial transition (MET), an early step in reprogramming, during which β-catenin regulates the MET process. Furthermore, sufficient amount of β-catenin plays a key role in maintaining stabilization of E-CADHERIN. Taken together, these studies show that perinuclear mitochondrial clustering is an essential organellar step for MET process of pluripotency induction, which may shed light on the subcellular relationship between mitochondrial dynamics, pluripotency, and cellular morphology.
Keywords: Drp1; Dynein; Oct4; Wnt signaling; mesenchymal-to-epithelial transition.
Copyright © 2025 The Author(s). Published by Elsevier Inc. All rights reserved.
Conflict of interest statement
Declaration of interests The authors declare no competing interests.
Figures


Similar articles
-
Early ERK1/2 activation promotes DRP1-dependent mitochondrial fission necessary for cell reprogramming.Nat Commun. 2016 Mar 31;7:11124. doi: 10.1038/ncomms11124. Nat Commun. 2016. PMID: 27030341 Free PMC article.
-
Wnt signaling promotes reprogramming of somatic cells to pluripotency.Cell Stem Cell. 2008 Aug 7;3(2):132-5. doi: 10.1016/j.stem.2008.06.019. Cell Stem Cell. 2008. PMID: 18682236 Free PMC article. No abstract available.
-
Sox2 and Klf4 as the Functional Core in Pluripotency Induction without Exogenous Oct4.Cell Rep. 2019 Nov 12;29(7):1986-2000.e8. doi: 10.1016/j.celrep.2019.10.026. Cell Rep. 2019. PMID: 31722212
-
Cell cycle and pluripotency: Convergence on octamer‑binding transcription factor 4 (Review).Mol Med Rep. 2017 Nov;16(5):6459-6466. doi: 10.3892/mmr.2017.7489. Epub 2017 Sep 13. Mol Med Rep. 2017. PMID: 28901500 Free PMC article. Review.
-
Directing reprogramming to pluripotency by transcription factors.Curr Opin Genet Dev. 2012 Oct;22(5):416-22. doi: 10.1016/j.gde.2012.07.001. Epub 2012 Aug 3. Curr Opin Genet Dev. 2012. PMID: 22868173 Review.
References
-
- Agarwal S., Ganesh S. Perinuclear mitochondrial clustering, increased ROS levels, and HIF1 are required for the activation of HSF1 by heat stress. J. Cell Sci. 2020;133 - PubMed
-
- Behrens J., von Kries J.P., Kühl M., Bruhn L., Wedlich D., Grosschedl R., Birchmeier W. Functional interaction of beta-catenin with the transcription factor LEF-1. Nature. 1996;382:638–642. - PubMed
-
- Clevers H., Nusse R. Wnt/beta-catenin signaling and disease. Cell. 2012;149:1192–1205. - PubMed
Publication types
MeSH terms
Substances
LinkOut - more resources
Full Text Sources
Miscellaneous
