. 2025 Apr 18;16(1):3709.
doi: 10.1038/s41467-025-59002-y.

Selective identification of epigenetic regulators at methylated genomic sites by SelectID

Affiliations

Selective identification of epigenetic regulators at methylated genomic sites by SelectID

Wenchang Qian et al. Nat Commun. .

Abstract

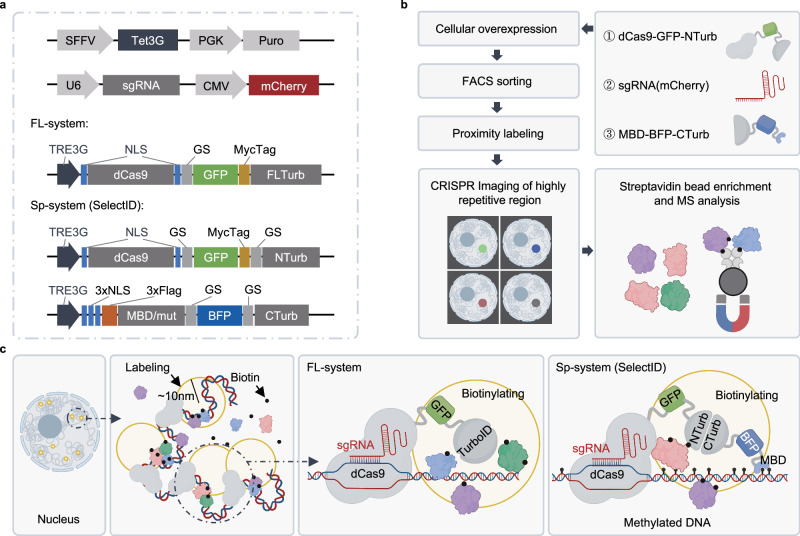
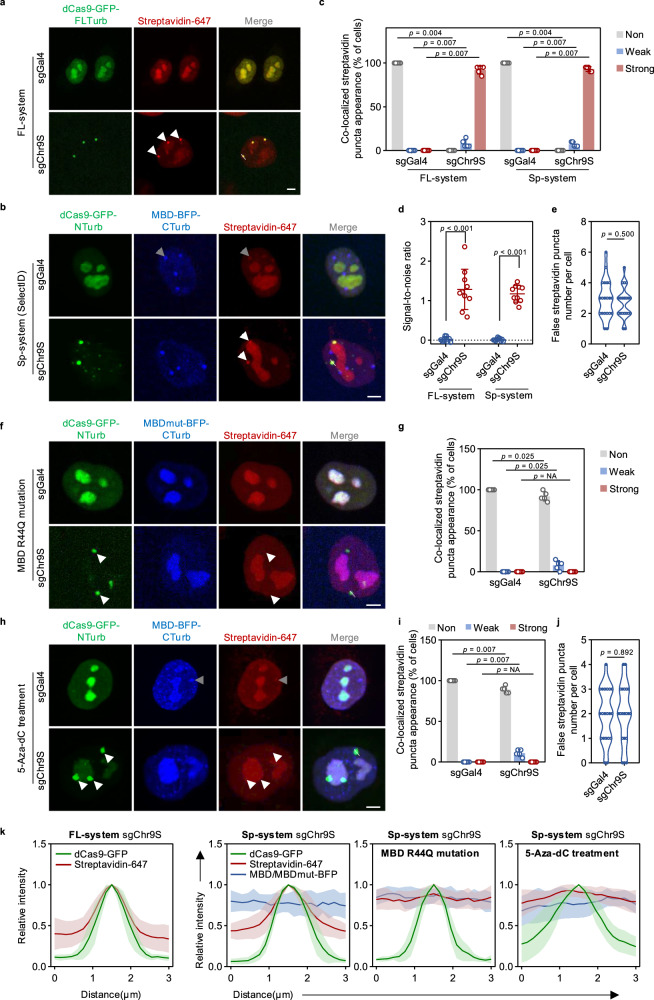
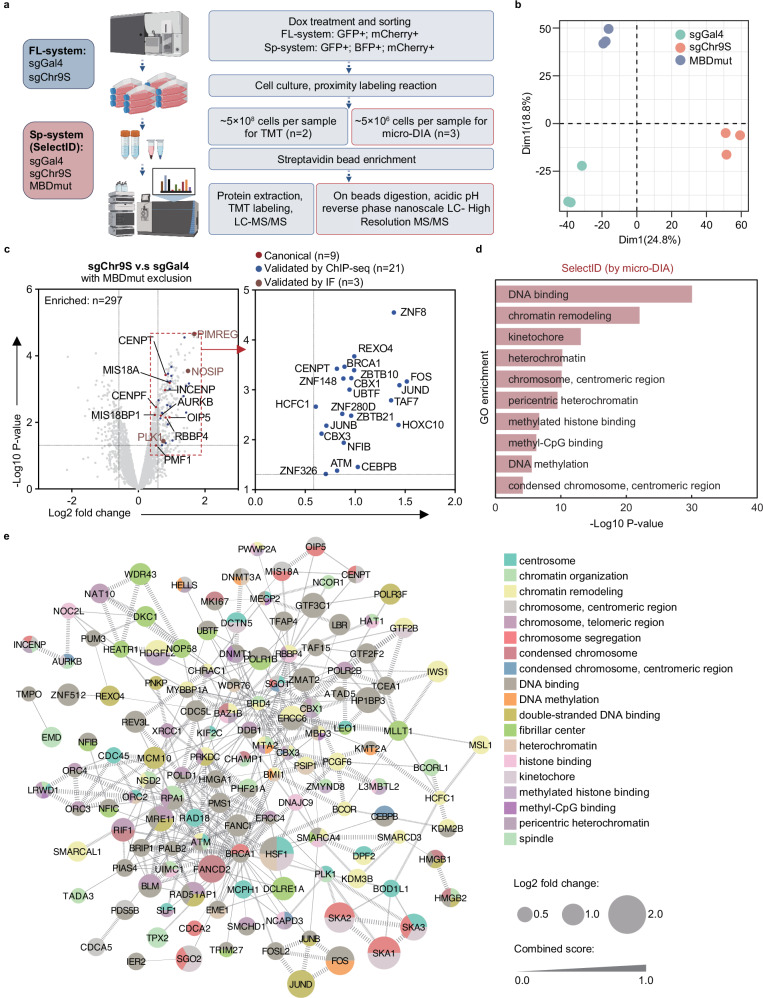
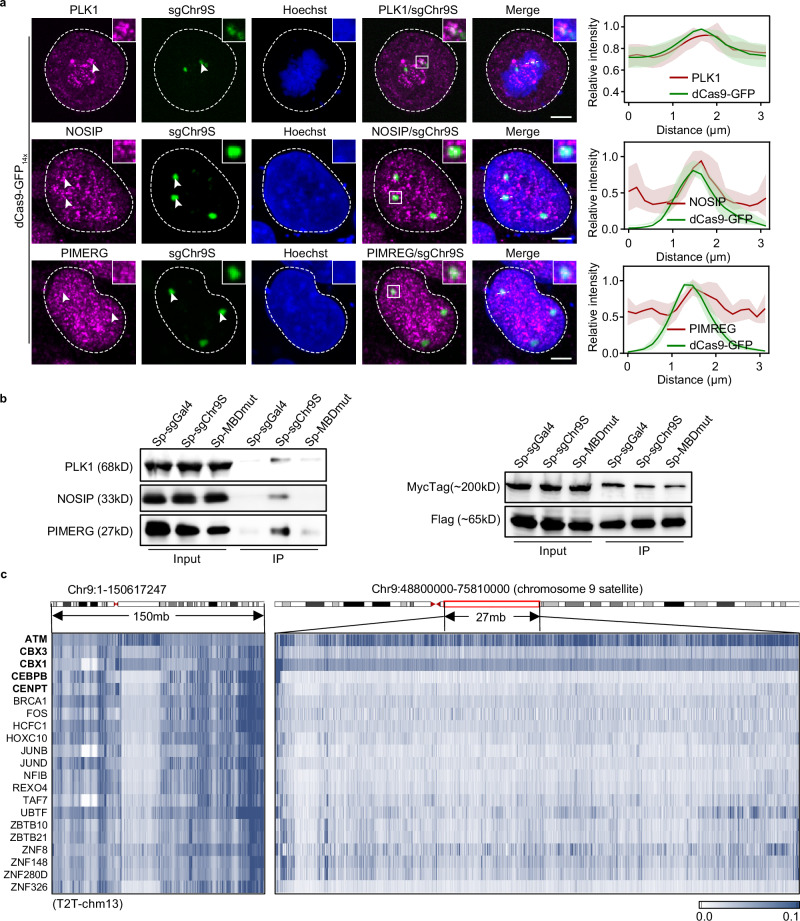
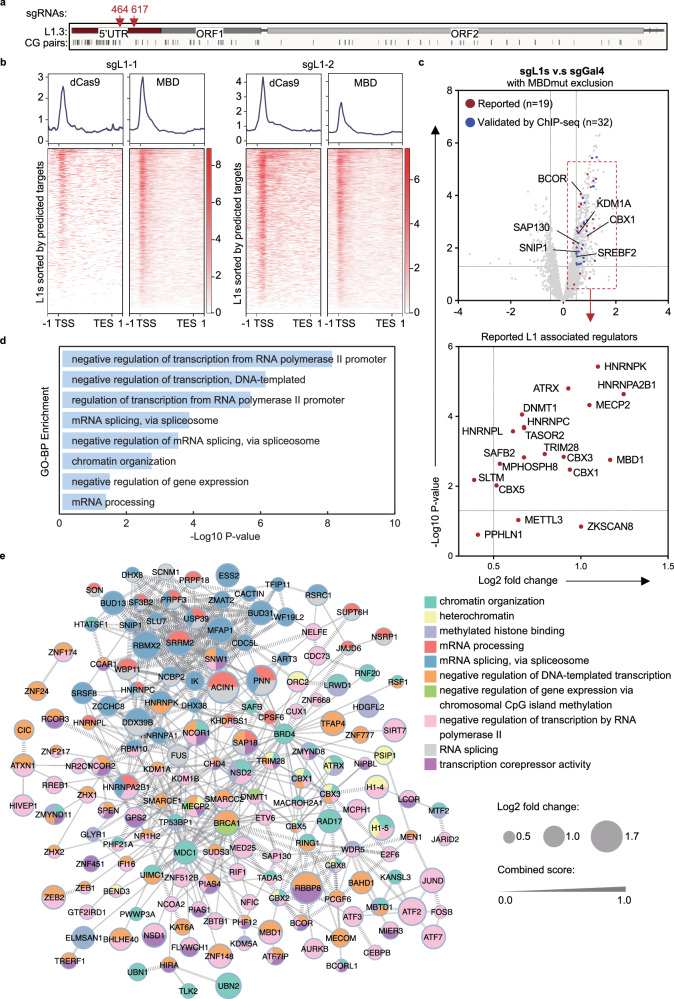
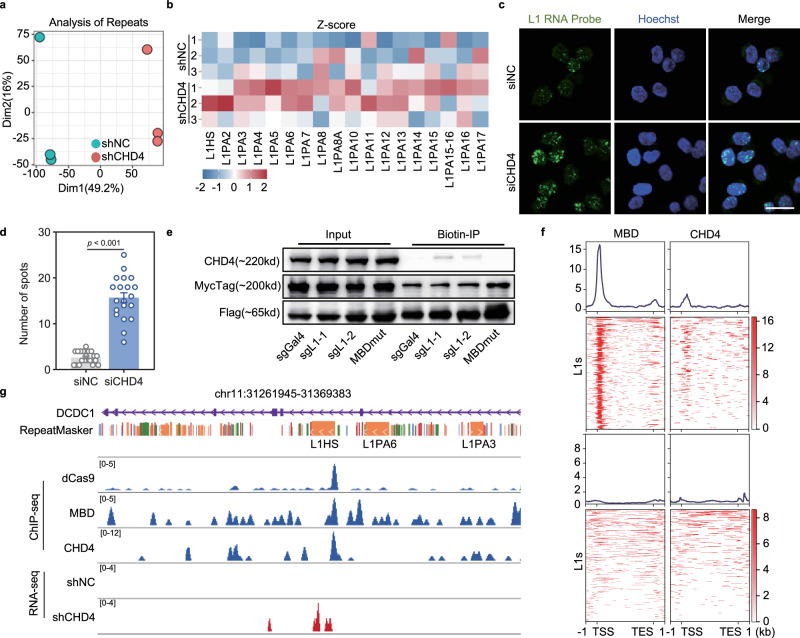
DNA methylation is a significant component in proximal chromatin regulation and plays crucial roles in regulating gene expression and maintaining the repressive state of retrotransposon elements. However, accurate profiling of the proteomics which simultaneously identifies specific DNA sequences and their associated epigenetic modifications remains a challenge. Here, we report a strategy termed SelectID (selective profiling of epigenetic control at genome targets identified by dCas9), which introduces methylated DNA binding domain into dCas9-mediated proximity labeling system to enable in situ protein capture at repetitive elements with 5-methylcytosine (5mC) modifications. SelectID is demonstrated as feasible as dCas9-TurboID system at specific DNA methylation regions, such as the chromosome 9 satellite. Using SelectID, we successfully identify CHD4 as potential repressors of methylated long interspersed nuclear element-1 (LINE-1) retrotransposon through direct binding at the 5' untranslated region (5'UTR) of young LINE-1 elements. Overall, our SelectID approach has opened up avenues for uncovering potential regulators of specific DNA regions with DNA methylation, which will greatly facilitate future studies on epigenetic regulation.


Conflict of interest statement

Competing interests: The authors declare no competing interests.

Figures

Fig. 1
Fig. 1. Schematic representation of the study.
a Diagram illustrating the expression cassettes used in the FL-system and Sp-system. b, c Schematic representation of the SelectID approach in this study. The FL- (Full-length TurboID) and Sp- (Split-TurboID, SelectID) systems are employed. b, c are created in BioRender. (2025) https://BioRender.com/i93a730.
Fig. 2
Fig. 2. Validation of SelectID at chromosome 9 satellite by CRISPR imaging.
a FL-system labeling of human chromosome 9 satellites in HeLa cells showing dCas9-GFP-FLTurb (green) and Streptavidin-647 (red). b Sp-system labeling with dCas9-GFP-NTurb (green), Streptavidin-647 (red), and MBD-BFP-CTurb (blue). c Co-localization analysis of streptavidin signals with dCas9-GFP in FL- and Sp-systems. n  =  5 biologically independent replicates. d Signal-to-noise ratio comparison between sgGal4 (nuclear) and sgChr9S (co-localized puncta). n = 10 cells. e False streptavidin puncta quantification in Sp-system. n = 20 cells. f Loss of biotinylated signal at the chromosome 9 satellite region observed in the HeLa cells with the indicated Sp-system cassettes with the R44Q MBD mutant. g Quantification of the streptavidin signal co-localized with the dCas9-GFP in the HeLa cells with sgChr9S in (f). n  =  5 biologically independent replicates. h Loss of biotinylated signal at the chromosome 9 satellite region observed in the HeLa cells with the indicated Sp-system cassettes under 3-days 5-Aza-dC treatment. i Quantification of the streptavidin signal co-localized with the dCas9-GFP in the HeLa cells with sgChr9S in (h). n  =  5 biologically independent replicates. j Quantification of the false streptavidin puncta in the HeLa cells with the indicated Sp-system cassettes in (h). n = 20 biologically independent cells. k Quantification of the relative fluorescence intensity along the dotted line indicated in (a, b, f, and h). n  =  5 biologically independent replicates. In panels (a, b, f, and h), HeLa cells expressing the FL-system and Sp-system expression cassettes were incubated with 50 μM biotin for 0.5 hours (FL-system) or 1 h (Sp-system), and fixed for Streptavidin staining, after treatment with 0.5 μg/mL Doxycycline for 12 h. Streptavidin-647 was used to detect biotinylated proteins; Scale bar: 5μm. In panels (c, d, g, i, and k), data were shown as mean ± SD. In panels (e and j), data were shown as violin plots with median and quartiles. Statistical significance was tested with the Wilcoxon rank sum test with continuity correction for panels (c, g, and i) two-tailed, unpaired Student’s t test for panels (d, e, and j). Source data are provided as a Source Data file.
Fig. 3
Fig. 3. SelectID provides highly efficient protein enrichment of the targeted chromosome 9 satellite region.
a Schematic representation of the experimental design for MS-based protein capture using SelectID. Created in BioRender. (2025) https://BioRender.com/i93a730. b Principal components analysis (PCA) of 3 replicates of SelectID groups at the chromosome 9 satellite region. c Volcano plot of the proteins identified by micro-DIA mass spectrometry. d Gene Ontology analysis of the enriched proteins shown in panel (c). P-values were calculated by Fisher’s Exact test. e Interaction network constructed from proteins in the indicated GO term. The statistical analyses of P-values were derived from a two-sided statistical test (c) or one-sided statistical test (d) and without adjustment for multiple comparisons. Source data are provided as a Source Data file.
Fig. 4
Fig. 4. Validation of the enriched proteins at chromosome 9 satellite region.
a The representative images of the immunofluorescence in dCas9-GFP14x cells transfected with sgChr9S at the mitosis state using anti-PLK1, anti-NOSIP, or anti-PIMREG; The co-localization assays of the dCas9-GFP and PLK1, NOSIP, or PIMREG performed at the sites of the dCas9-GFP dots. Data are shown as mean ± SD. Scale bar: 5 μm. n  =  5 biologically independent replicates. b Biotin affinity immunoprecipitation of PLK1, NOSIP, and PIMREG in the HeLa cells transfected with indicated SelectID cassettes. n  =  3 biologically independent replicates. c Representative ChIP-seq genome browser tracks of the chromosome 9 satellite region. Positive controls were highlighted with bold font. Source data are provided as a Source Data file.
Fig. 5
Fig. 5. SelectID identifies L1-associated proteins in methylated young L1 elements.
a Schematic representation showing the positions of the 2 sgRNAs targeting human L1HS for SelectID. b Heatmap of dCas9-NTurb and MBD-CTurb ChIP signals over the dCas9-bound L1s in HeLa cells with SelectID cassettes, sorted by dCas9-NTurb ChIP signal and aligned on the L1 5’end. c Volcano plot of the proteins identified by SelectID through micro-DIA mass spectrometry at the 5’UTR of L1 elements. The red dots represented the validated L1-associated proteins. d Gene Ontology analysis of the enriched proteins identified through SelectID, revealing GO-BP functional categories associated with the proteins. P-values were calculated by Fisher’s Exact test. e Gene connection network of the enriched proteins at the 5’UTR of methylated young L1 elements. The statistical analyses of P-values were derived from a two-sided statistical test (c) or one-sided statistical test (d) and without adjustment for multiple comparisons. Source data are provided as a Source Data file.
Fig. 6
Fig. 6. CHD4 suppresses L1 expression by binding the 5’UTR of the L1 elements.
a Principal components analysis (PCA) of the repeats in RNA-seq of stable HeLa cell lines with shCHD4 and control shRNA expression. b Z-scores of the young L1 elements expression in aforementioned HeLa cells. c RNA FISH analysis of L1 RNA in control cells (siNC) or HeLa cells transfected with siRNAs targeting CHD4. Scale bar: 20 μm. d Quantification of spot numbers in each cell based on fluorescent images. Data are shown as mean ± SD. P-values were calculated by a two-tailed Student’s t test. n  =  20 biologically independent cells. e Biotin affinity immunoprecipitations of the CHD4 in the indicated groups of HeLa cells transfected with SelectID cassettes. n  =  3 biologically independent replicates. f Aggregated ChIP–seq reads density (the top panels) and heatmaps (the bottom panels) centered around the full-length L1 elements sorted by the MBD bound and unbound L1 elements. g ChIP-seq and RNA-seq genome browser tracks of the genomic region of the genes containing an L1HS element. Source data are provided as a Source Data file.

Similar articles

References

    1. Deniz, O., Frost, J. M. & Branco, M. R. Regulation of transposable elements by DNA modifications (vol 20, pg 417, 2019). Nat. Rev. Genet.20, 432–432 (2019). - PubMed
    1. Jones, P. A. Functions of DNA methylation: islands, start sites, gene bodies and beyond. Nat. Rev. Genet.13, 484–492 (2012). - PubMed
    1. Jones, P. A. & Liang, G. Rethinking how DNA methylation patterns are maintained. Nat. Rev. Genet.10, 805–811 (2009). - PMC - PubMed
    1. Smit, A. F., Toth, G., Riggs, A. D. & Jurka, J. Ancestral, mammalian-wide subfamilies of LINE-1 repetitive sequences. J. Mol. Biol.246, 401–417 (1995). - PubMed
    1. Brouha, B. et al. Hot L1s account for the bulk of retrotransposition in the human population. Proc. Natl. Acad. Sci. USA100, 5280–5285 (2003). - PMC - PubMed

MeSH terms

LinkOut - more resources