

MammOnc-DB, an integrative breast cancer data analysis platform for target discovery
- PMID: 40251157
- PMCID: PMC12008238
- DOI: 10.1038/s41523-025-00750-x
MammOnc-DB, an integrative breast cancer data analysis platform for target discovery
Abstract
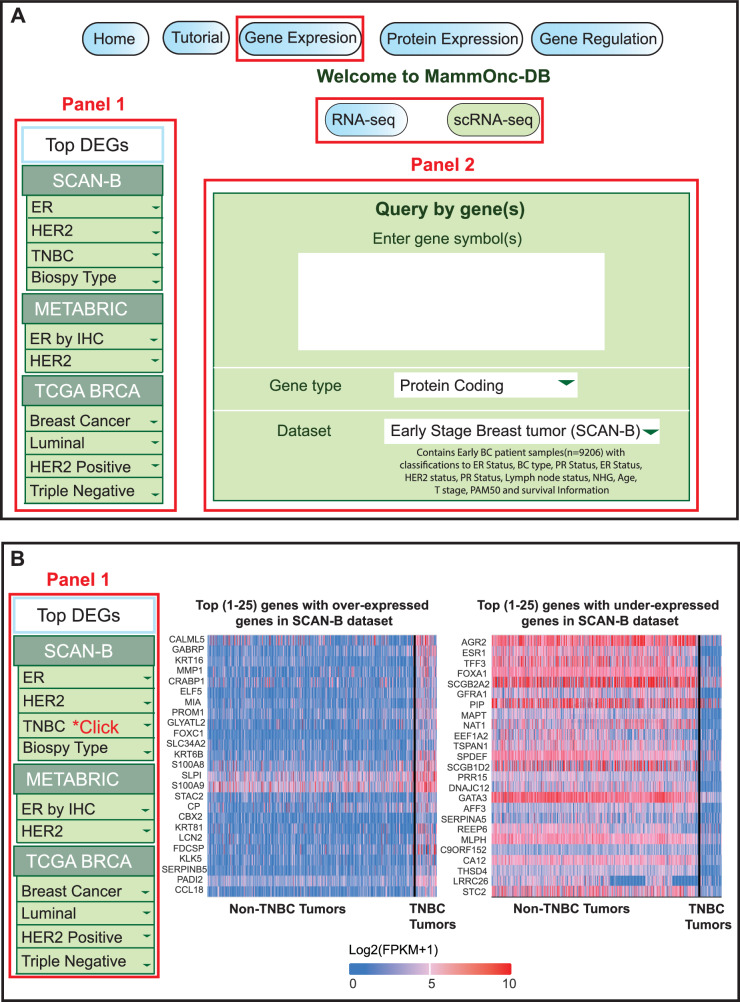
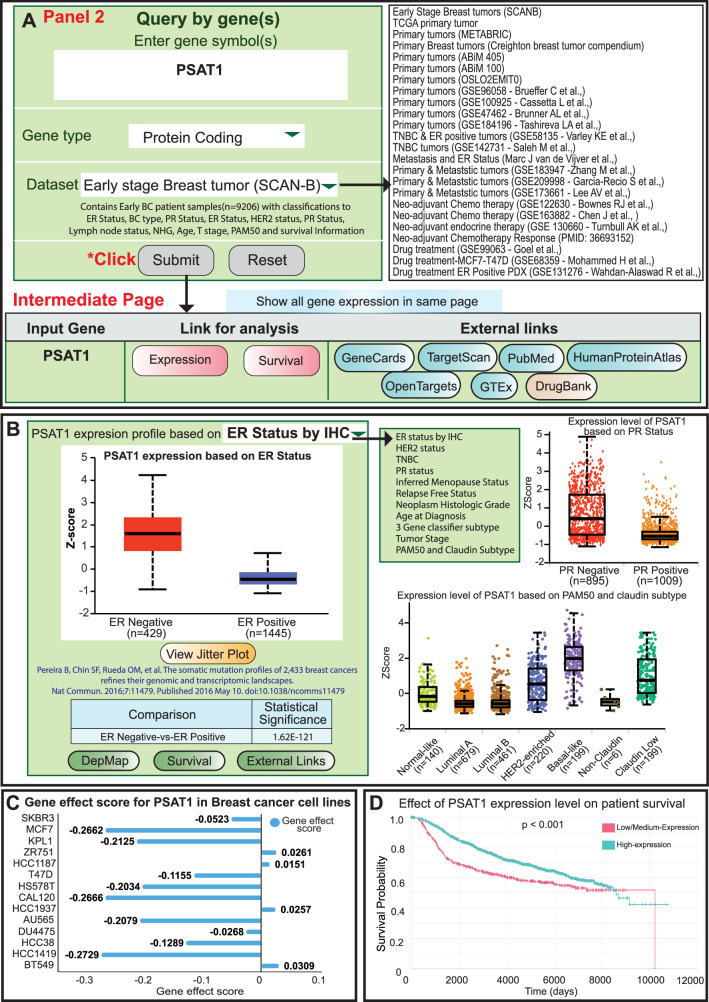
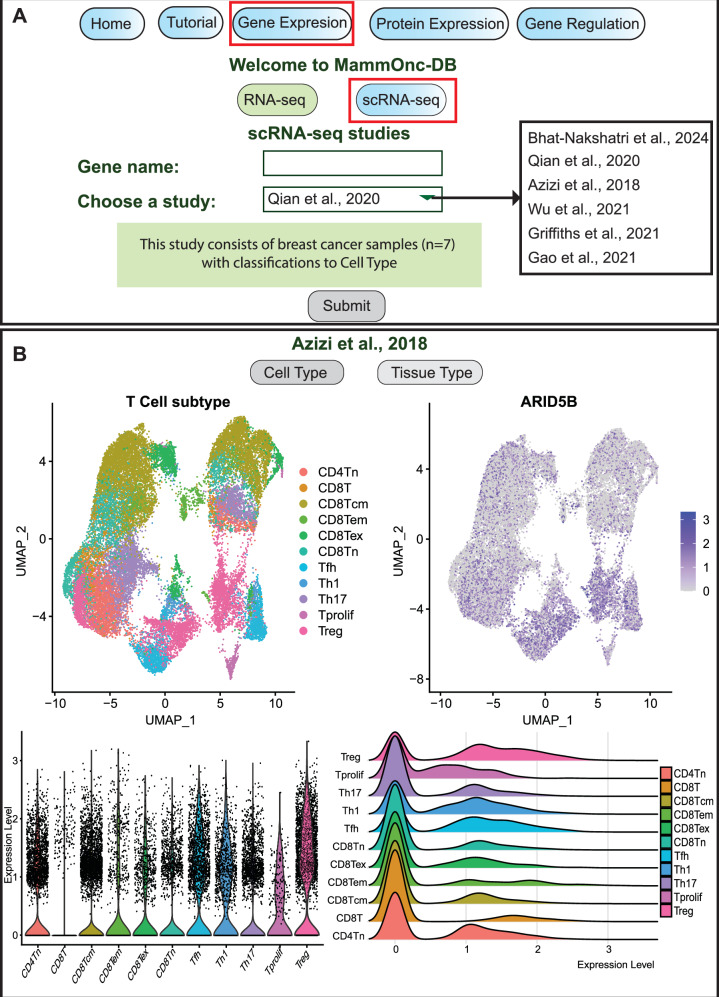
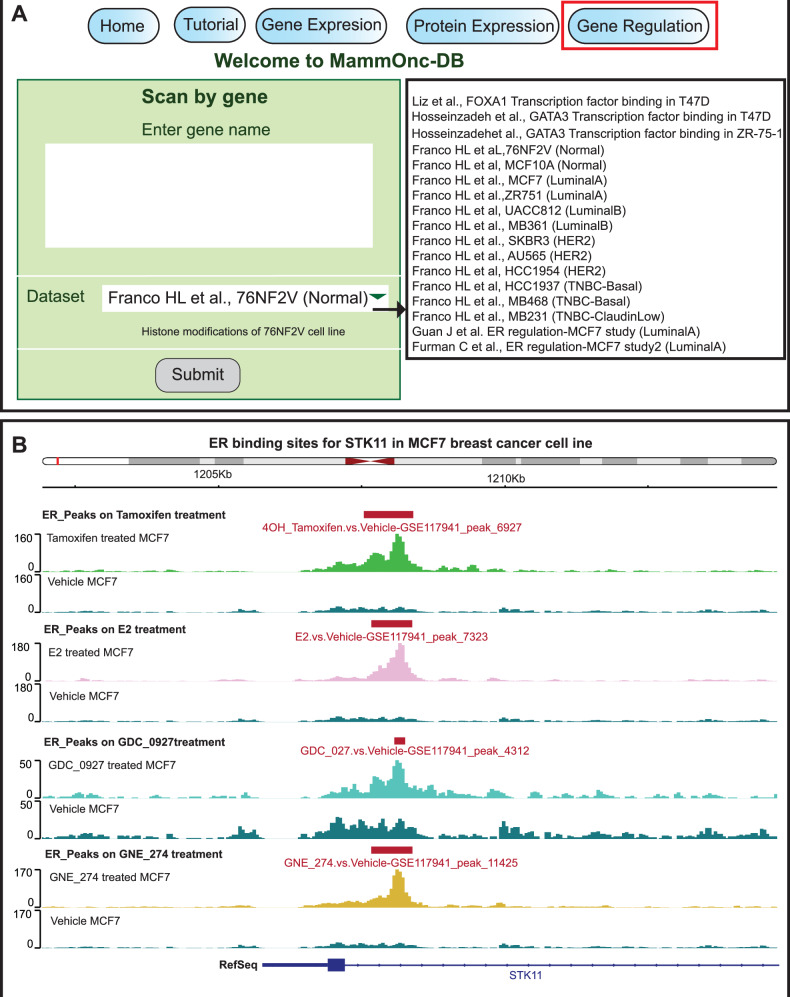
Breast cancer (BCa), a leading malignancy among women, is characterized by morphological and molecular heterogeneity. While early-stage, hormone receptor, and HER2-positive BCa are treatable, triple-negative BCa and metastatic BCa remains largely untreatable. Advances in sequencing and proteomic technologies have improved our understanding of the molecular alterations that occur during BCa initiation and progression and enabled identification of subclass-specific biomarkers and therapeutic targets. Despite the availability of abundant omics data in public repositories, user-friendly tools for multi-omics data analysis and integration are scarce. To address this, we developed a comprehensive BCa data analysis platform called MammOnc-DB ( http://resource.path.uab.edu/MammOnc-Home.html ), comprising data from more than 20,000 BCa samples. MammOnc-DB facilitates hypothesis generation and testing, biomarker discovery, and therapeutic targets identification. The platform also includes pre- and post-treatment data, which can help users identify treatment resistance markers and support combination therapy strategies, offering researchers and clinicians a comprehensive tool for BCa data analysis and visualization.
© 2025. The Author(s).
Conflict of interest statement
Competing interests: The authors declare no competing interests.
Figures


Update of
-
MammOnc-DB, an integrative breast cancer data analysis platform for target discovery.Res Sq [Preprint]. 2024 Sep 26:rs.3.rs-4926362. doi: 10.21203/rs.3.rs-4926362/v1. Res Sq. 2024. Update in: NPJ Breast Cancer. 2025 Apr 18;11(1):35. doi: 10.1038/s41523-025-00750-x. PMID: 39399665 Free PMC article. Updated. Preprint.
Similar articles
-
MammOnc-DB, an integrative breast cancer data analysis platform for target discovery.Res Sq [Preprint]. 2024 Sep 26:rs.3.rs-4926362. doi: 10.21203/rs.3.rs-4926362/v1. Res Sq. 2024. Update in: NPJ Breast Cancer. 2025 Apr 18;11(1):35. doi: 10.1038/s41523-025-00750-x. PMID: 39399665 Free PMC article. Updated. Preprint.
-
AEBP1 Contributes to Breast Cancer Progression by Facilitating Cell Proliferation, Migration, Invasion, and Blocking Apoptosis.Discov Med. 2023 Feb 1;35(174):45-56. doi: 10.24976/Discov.Med.202335174.6. Discov Med. 2023. PMID: 37024441
-
Overcoming endocrine resistance in hormone receptor-positive breast cancer.Curr Oncol. 2018 Jun;25(Suppl 1):S18-S27. doi: 10.3747/co.25.3752. Epub 2018 Jun 13. Curr Oncol. 2018. PMID: 29910644 Free PMC article. Review.
-
Osteopontin level and promoter polymorphism in patients with metastatic breast cancer.Curr Oncol. 2020 Oct;27(5):e444-e450. doi: 10.3747/co.27.6449. Epub 2020 Oct 1. Curr Oncol. 2020. PMID: 33173383 Free PMC article.
-
Androgen receptor: A promising therapeutic target in breast cancer.Crit Rev Clin Lab Sci. 2019 May;56(3):200-223. doi: 10.1080/10408363.2019.1575643. Epub 2019 Mar 1. Crit Rev Clin Lab Sci. 2019. PMID: 30821186 Review.
Cited by
-
BCMA: An integrative and versatile database for multi-scale and multi-omics molecular atlas of breast cancer.Comput Struct Biotechnol J. 2025 Jun 20;27:2701-2710. doi: 10.1016/j.csbj.2025.06.031. eCollection 2025. Comput Struct Biotechnol J. 2025. PMID: 40621063 Free PMC article.
-
Semaphorin-7A promotes macrophage-mediated mammary epithelial and ductal carcinoma in situ invasion.Res Sq [Preprint]. 2025 May 15:rs.3.rs-6448305. doi: 10.21203/rs.3.rs-6448305/v1. Res Sq. 2025. PMID: 40470186 Free PMC article. Preprint.
-
Variable roles of miRNA- and apoptosis-linked genes in invasive breast cancer: expression patterns, clinicopathological associations, and prognostic significance.Mol Biol Rep. 2025 Jul 11;52(1):703. doi: 10.1007/s11033-025-10739-1. Mol Biol Rep. 2025. PMID: 40643805
References
-
- Siegel, R. L., Giaquinto, A. N. & Jemal, A. Cancer statistics, 2024. CA Cancer J. Clin.74, 12–49 (2024). - PubMed
-
- Harbeck, N. et al. Breast cancer. Nat. Rev. Dis. Prim.5, 66 (2019). - PubMed
-
- Loibl, S., Poortmans, P., Morrow, M., Denkert, C. & Curigliano, G. Breast cancer. Lancet397, 1750–1769 (2021). - PubMed
Grants and funding
LinkOut - more resources
Full Text Sources
Research Materials
Miscellaneous
