. 2025 Apr 18;16(1):3355.
doi: 10.1038/s41467-025-58464-4.

Therapeutic target prediction for orphan diseases integrating genome-wide and transcriptome-wide association studies

Affiliations

Therapeutic target prediction for orphan diseases integrating genome-wide and transcriptome-wide association studies

Satoko Namba et al. Nat Commun. .

Abstract

Therapeutic target identification is challenging in drug discovery, particularly for rare and orphan diseases. Here, we propose a disease signature, TRESOR, which characterizes the functional mechanisms of each disease through genome-wide association study (GWAS) and transcriptome-wide association study (TWAS) data, and develop machine learning methods for predicting inhibitory and activatory therapeutic targets for various diseases from target perturbation signatures (i.e., gene knockdown and overexpression). TRESOR enables highly accurate identification of target candidate proteins that counteract disease-specific transcriptome patterns, and the Bayesian optimization with omics-based disease similarities achieves the performance enhancement for diseases with few or no known targets. We make comprehensive predictions for 284 diseases with 4345 inhibitory target candidates and 151 diseases with 4040 activatory target candidates, and elaborate the promising targets using several independent cohorts. The methods are expected to be useful for understanding disease-disease relationships and identifying therapeutic targets for rare and orphan diseases.


Conflict of interest statement

Competing interests: The authors declare no competing interests.

Figures

Fig. 1
Fig. 1. Overview of the proposed method for predicting therapeutic targets integrating GWAS and TWAS summary data.
A Construction of our proposed disease signature, TWAS-relevant signature for orphan diseases (TRESOR). SNP β-values from the GWAS summary data for the disease, SNP linkage disequilibrium (LD) from the reference data, and gene weights from gene-expression models from PredictDB database were used to estimate gene-expression scores. These estimated gene-expression scores were used in the construction of TRESOR. B Inverse signature method with TRESOR and target gene perturbation signatures (TGPs). Correlation coefficients for inhibitory or activatory target–disease pairs were calculated using TRESOR and TGPs with gene knockdown or using TRESOR and TGPs with gene overexpression. C Multitask learning method with disease similarities. Target gene knockdown and target gene overexpression signatures were used as inputs for predictive models of individual diseases. The predictive models are simultaneously learned through sharing disease similarities from various disease features, such as causal mutations. D Bayesian integrative method. Using Bayesian optimization, the inverse signature and multitask learning methods are integrated.
Fig. 2
Fig. 2. Visualization of disease–disease relationships based on various disease signatures and performance comparison in predicting therapeutic targets.
A Scatterplots of diseases were obtained after applying principal component analysis (PCA) to the SNP-PV, SNP-eQTL, DT, and TRESOR signatures for 24 diseases. SNP-PV, SNP-eQTL and DT are baseline signatures, and TRESOR is our proposed signature. The proportion of variance explained by top two PCs is shown on each axis. The diseases are labeled with different colors according to the disease classification of the Eleventh Edition of the International Statistical Classification of Diseases and Related Health Problems (ICD-11). B Comparison of the performance of the proposed method and baseline methods for identifying inhibitory targets for 23 diseases; the proposed methods correspond to the inverse signature method with TRESOR. The baseline methods correspond to SNP profiling methods with SNP-PV and SNP-eQTL and the inverse signature method with DT. Each box represents the distribution of AUC scores for diseases. In the box plots: center line, median; box, interquartile range; whiskers, 1.5 × interquartile range; and point, the AUC score for each disease. The horizontal dotted line represents AUC = 0.5. The asterisks represent significance based on one-sided p-values after Benjamini–Homberg (BH) corrections: *p<0.05; **p<0.01; *** p<0.001; **** p<0.0001. The two groups were compared by one-sided Wilcoxon signed-rank test. Corrections for multiple testing were made, adjusting significance values for three tests per analysis stream. The p-values between the TRESOR and SNP-PV, SNP-eQTL, or DT is p*=8.2×10⁴, p*=2.5×10⁵, and p*=5.5×10⁴. C Same as (B) but for activatory target predictions for 13 diseases. The p-values between the TRESOR and SNP-PV, SNP-eQTL, or DT is p*=3.6×10², p*=7.8×10³, and p*=7.8×10³. Source data for Fig. 2A–C is provided in the Supplementary Data S19. Disease name abbreviations: AD, Alzheimer’s disease; ALS, amyotrophic lateral sclerosis; AtD, atopic dermatitis; ATL, adult T-cell lymphoma/leukemia; CC, colorectal carcinoma; CD, Crohn’s disease; CLL, chronic lymphocytic leukemia; IDDM, insulin-dependent diabetes mellitus; EC, endometrial carcinoma; IPF, idiopathic pulmonary fibrosis; MM, multiple myeloma; MNT, malignant neoplasm of the testis; MNB, malignant neoplasm of the breast; MNO, malignant neoplasm of the ovaries; PC, pancreatic carcinoma; PD, Parkinson’s disease; RA, rheumatoid arthritis; RCC, renal cell carcinoma; SCLS, small cell carcinoma of the lung; SLE, systemic lupus erythematosus; UC, ulcerative colitis; UCN, uterine cervical neoplasm.
Fig. 3
Fig. 3. Performance evaluation of the multitask learning method based on various types of disease similarities and performance evaluation of the Bayesian integrative method.
A Performance evaluation of the multitask learning method for inhibitory target predictions. Multitask learning methods were compared across nine types of disease similarities, comprising gene–disease associations (GDAs) and variant–disease associations (VDAs). GDAs consisted of all possible features (All), Altered expression (Ae), Biomarker (Bm), Causal mutation (Cm), Genetic variation (Gv), and Posttranslational modification (Pm); VDAs consisted of all possible features (All), Causal mutation (Cm), and Genetic variation (Gv). The bars in the panel represent the AUC, AUPR, BED AUC scores and disease degrees (the number of known therapeutic targets), from the top to the bottom panels. Blue bars indicate GDAs, and orange bars indicate VDAs. The horizontal axis represents the same diseases shown in Fig. 2. Supplementary Fig. S14 shows the results for all diseases. The horizontal dotted line in the top panel represents AUC = 0.5. Source data is provided in the Supplementary Data S13–S15. B Relevant disease similarities for inhibitory target prediction. The number of diseases with max AUC, AUPR, and BED AUC was counted for each disease feature from the left to right panels. Diseases and colors are the same as in (A). Source data is provided in the Supplementary Data S13–S15. C Part of the disease similarity network based on VDAs on Cm near IDDM. Orange nodes denote diseases. Node sizes reflect random walk with restart (RWR) from IDDM. Edge width reflects disease similarity for VDAs on Cm. Source data is provided in the Supplementary Data S19. D Same as (C) but for SLE. E Same as (A) but for Activatory target predictions. Source data is provided in the Supplementary Data S16–S18. F Relevant disease similarities for activatory target prediction, as in (B). Source data is provided in the Supplementary Data S16–S18. G Same as (C) but for melanoma. Source data is provided in the Supplementary Data S19. H Performance evaluation of the inverse signature, multitask learning, and Bayesian integrative methods for each disease degree for inhibitory target predictions for 113 diseases. The violin plots represent the distributions of AUC, AUPR, and BED AUC scores from the top to bottom panels. In the violin plots: center white point, median; box, interquartile range; whiskers, 1.5× interquartile range; and point, AUC, AUPR, or BED AUC score for the disease. Colors represent prediction methods; pink, inverse signature method with TRESOR; orange, multitask learning method; and blue, Bayesian integrative method. The horizontal axis represents the degree of the disease (the number of known therapeutic targets). The horizontal dotted line in the top panel represents AUC = 0.5. Source data is provided in the Supplementary Data S1. (I) Same as (H) but for activatory target predictions for 61 diseases. Source data is provided in the Supplementary Data S2. Disease name abbreviations: AA, aplastic anemia; AML, acute myeloid leukemia; BCC, basal cell carcinoma; CC, colorectal carcinoma; CML, chronic myeloid leukemia; EC, endometrial carcinoma; GIST, gastrointestinal stromal tumors; IDDM, insulin-dependent diabetes mellitus; LC, liver carcinoma; LMS, leiomyosarcoma; MNP, malignant neoplasm of prostate; MNT, malignant neoplasm of testis; MNB, malignant neoplasm of breast; MT, mammary neoplasms; NET, neuroendocrine tumors; NIDDM, non-insulin-dependent diabetes mellitus; NSCLS, non-small cell carcinoma of lung; OS, osteosarcoma; PH, pulmonary hypertension; TC, papillary thyroid carcinoma; SLE, systemic lupus erythematosus.
Fig. 4
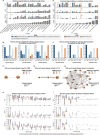
Fig. 4. Newly predicted therapeutic targets and their modes of action for rare diseases using the Bayesian integrative method.
A Parts of the newly predicted inhibitory target–disease association networks. Blue circles and yellow diamonds denote inhibitory targets and diseases, respectively. Gray lines represent known associations, and blue lines show predicted associations. The square represents the first node for multiple endocrine neoplasia (MEN). Source data is provided in the Supplementary Data S3. B Heatmap of GO enrichment analysis for known and predicted inhibitory targets for MEN. The horizontal axis represents known and predicted targets. The vertical axis represents some of more significantly enriched GO terms, and all enriched terms can be found in the source data (Supplementary Data S5). Horizontal and vertical color bars give the GO categories and therapeutic target types, respectively. The color and asterisks for each square reflect p values and significance (*p<0.05), respectively. Enrichment analysis was performed by Fisher’s exact test. Corrections for multiple testing were applied, adjusting significance values based on the number of GO terms. C Scatterplot of TGP with gene knockdown of inhibitory target FHL2 and TRESOR for MEN. The vertical and horizontal axes represent the gene-expression scores for TRESOR and the TGP for the predicted targets, respectively. Each point denotes differentially expressed genes in TRESOR and the TGP. The blue lines represent regression lines, and light blue regions represent the upper and lower limits of 95% confidence intervals for the regression estimate. The color of each point reflects the TWAS p-value, indicating the association level between genes and diseases. TWAS p-value calculation and multiple testing corrections were performed using the S-PrediXcan formula. Source data is provided in the Supplementary Data S19. D Part of the disease similarity network in the vicinity of MEN. Blue nodes denote diseases. The sizes of the nodes reflect random walk with restart (RWR) from MEN. Edge width reflects disease similarity for VDAs on Cm. Nodes with yellow edge color apart from MEN represent major lesions of MEN. Source data is provided in the Supplementary Data S19. E Same as (A) but for the newly predicted activatory target–disease association network. The squares represent first node for idiopathic pulmonary fibrosis (IPF). Source data is provided in the Supplementary Data S4. F Same as (B) but for activatory targets for IPF. All enriched terms can be found in the source data (Supplementary Data S6) (G) Same as (C) but for TGP with gene overexpression for activatory target STIMATE/TMEM110 and TRESOR for IPF. Source data is provided in the Supplementary Data S19. H Same as (D) but for IPF. Source data is provided in the Supplementary Data S19. Disease name abbreviations: AHF, acute heart failure; ALS, amyotrophic lateral sclerosis; AML, acute myeloid leukemia; ATC, anaplastic thyroid carcinoma; BCC, basal cell carcinoma; CC, colorectal carcinoma; CML, chronic myeloid leukemia; DM, diabetes mellitus; CNDI, congenital nephrogenic diabetes insipidus; COPD, chronic obstructive airway disease; EC, endometrial carcinoma; GIST, gastrointestinal stromal tumors; HSA, hemongiosarcoma; HT, hypertensive disease; ICT, islet cell tumor; IPF, idiopathic pulmonary fibrosis; IPH, idiopathic pulmonary hypertension; LC, liver carcinoma; LMS, leiomyosarcoma; MEN, multiple endocrine neoplasia; MM, multiple myeloma; MS, motion sickness; MT, mammary neoplasms; MNP, malignant neoplasm of prostate; MNT, malignant neoplasm of testis; MNB, malignant neoplasm of breast; MNO, malignant neoplasm of ovary; MNUB, malignant neoplasm of urinary bladder; MPA, male pattern alopecia; MTC, medullary thyroid carcinoma; NET, neuroendocrine tumors; NIDDM, non-insulin-dependent diabetes mellitus; NSCLS, non-small cell carcinoma of lung; OS, osteosarcoma; PC, pancreatic carcinoma; PHEO, pheochromocytoma; PPI, paralytic ileus; SLS, Sjogren-Larsson syndrome; SS, systemic scleroderma; TC, papillary thyroid carcinoma; SCLS, small cell carcinoma of lung.
Fig. 5
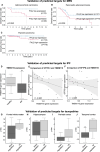
Fig. 5. Validation of predicted therapeutic targets for rare and orphan diseases using independent cohorts.
A Comparison of survival rates in The Cancer Genome Atlas (TCGA) adrenocortical carcinoma cohort between patients with a low and high expression of FHL2, a predicted inhibitory target for MEN. The two groups were compared by two-sided Log-rank test. B Same as (A) but for a TCGA pancreatic adenocarcinoma cohort. C Same as (A) but for a TCGA thyroid carcinoma cohort. Adrenocortical carcinoma, pancreatic adenocarcinoma, and thyroid carcinoma are major lesions of MEN. The horizontal and vertical axes represent survival time (years) and overall survival rate, respectively. The pink and blue lines represent patients with FHL2 low expression and patients with FHL2 high expression, respectively. D Comparison of STIMATE/TMEM110 gene-expression scores between healthy controls (n = 18) and IPF donors (n = 19) in the Lung Tissue Research Consortium. The asterisk represents significance (*p<0.05). The two groups were compared using a one-sided Wilcoxon rank-sum test. Corrections for multiple testing were applied using the false discovery rate (FDR) with BH corrections, adjusting significance values for nine tests per analysis stream (together with Supplementary Fig. S23). The p-value is p*=1.1×10². E Comparison of gene-expression scores between a biomarker and a predicted activatory target for IPF: SFTPA1 and STIMATE/TMEM110. The horizontal and vertical axes represent gene-expression level for STIMATE/TMEM110 and SFTPA1, a disease activity marker of IPF, respectively. Each point denotes an IPF patient (n = 19). The black lines represent regression lines, and the light gray regions represent the upper and lower limits of 95% confidence intervals for the regression estimate. F Comparison of gene-expression scores between a biomarker and a predicted activatory target for IPF: SFTPD and STIMATE/TMEM110. SFTPD is a disease activity marker of IPF. This panel follows the same format as (E). G Comparison of p-tau in the frontal white matter between donors with upregulated and downregulated RAB1B (upregulated, n = 6; downregulated, n = 19), a predicted inhibitory target for tauopathies. The boxes represent the distribution of p-tau. In the box plots: center line, median; box, interquartile range; whiskers, 1.5× interquartile range; and points, tauopathy patients. Asterisks represent significance (*p < 0.05; **p < 0.01). The two groups were compared by one-sided Wilcoxon rank-sum test. We made corrections for multiple testing using the FDR by BH corrections, adjusting significance values for four tests per analyses stream. The p-value is p*=5.1×10². (H) Same as (G) but in the hippocampus (upregulated, n = 14; downregulated, n = 14). The p-value is p*=1.9×101. I Same as (G) but in the parietal cortex (upregulated, n = 14; downregulated, n = 12). The p-value is p*=5.1×10². J Same as (G) but in the temporal cortex (upregulated, n = 13; downregulated, n = 15). The p-value is p*=1.9×10². Source data for Fig. 5A–J is provided in the Supplementary Data S19. Disease name abbreviations: IPF, idiopathic pulmonary fibrosis; MEN, multiple endocrine neoplasia.

Similar articles

References

    1. Santos, R. et al. A comprehensive map of molecular drug targets. Nat. Rev. Drug Discov.16, 19–34 (2017). - PMC - PubMed
    1. Arrowsmith, J. & Miller, P. Trial Watch: Phase II and Phase III attrition rates 2011-2012. Nat. Rev. Drug Discov.12, 569 (2013). - PubMed
    1. He, H., Liu, L., Morin, E. E., Liu, M. & Schwendeman, A. Survey of clinical translation of cancer nanomedicines - lessons learned from successes and failures. Acc. Chem. Res.52, 2673–2683 (2019). - PubMed
    1. Plenge, R. M. Disciplined approach to drug discovery and early development. Sci. Transl. Med. 8, 349ps15 (2016). - PubMed
    1. Griebel, G. & Holmes, A. 50 years of hurdles and hope in anxiolytic drug discovery. Nat. Rev. Drug Discov. 2013 12912, 667–687 (2013). - PMC - PubMed

LinkOut - more resources