. 2025 Apr 18;16(1):3700.
doi: 10.1038/s41467-025-58878-0.

Cell lineage-resolved embryonic morphological map reveals signaling associated with cell fate and size asymmetry

Affiliations

Cell lineage-resolved embryonic morphological map reveals signaling associated with cell fate and size asymmetry

Guoye Guan et al. Nat Commun. .

Abstract

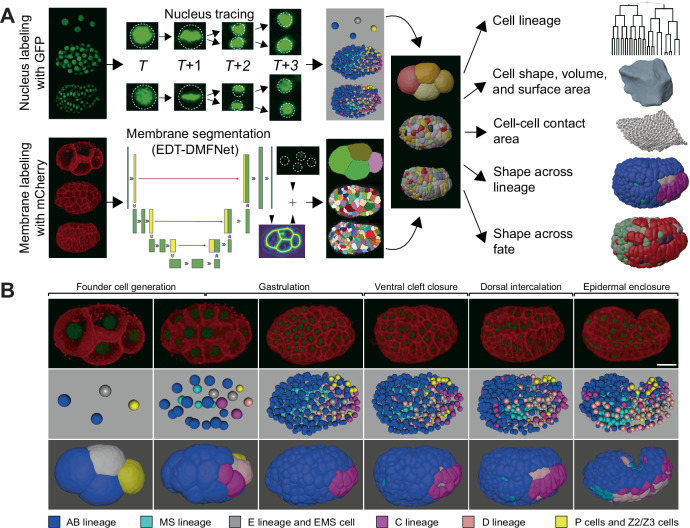
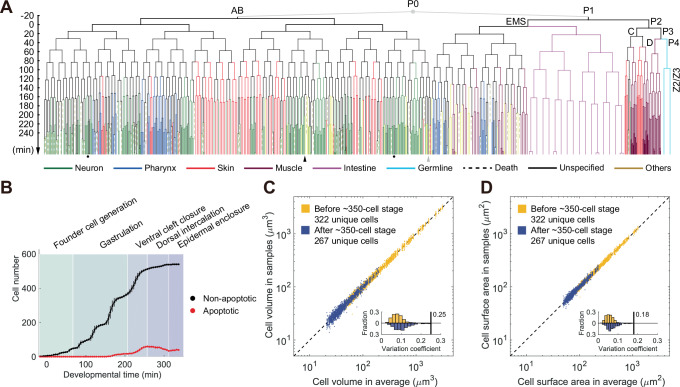
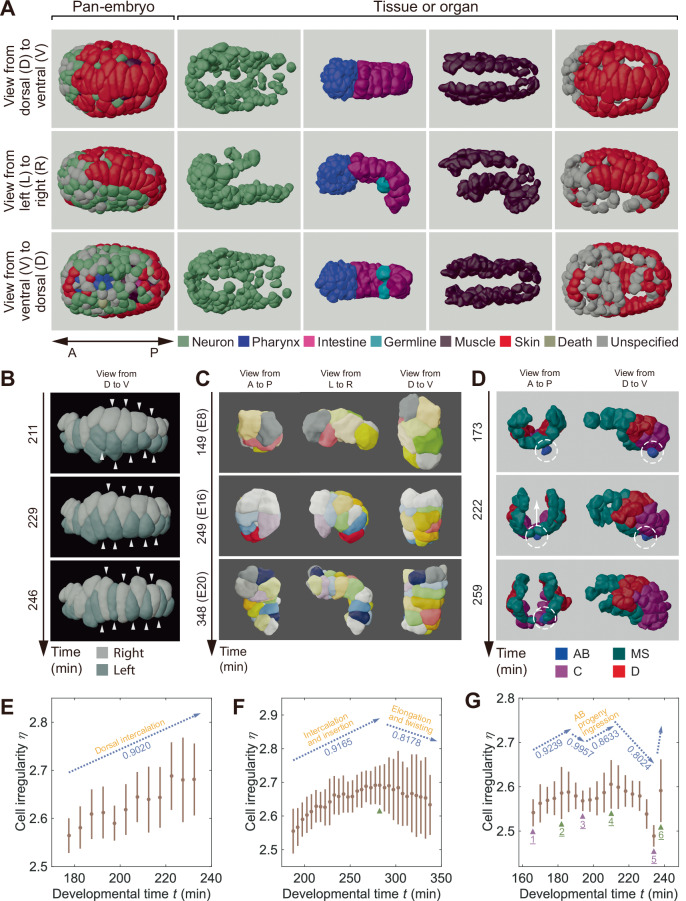
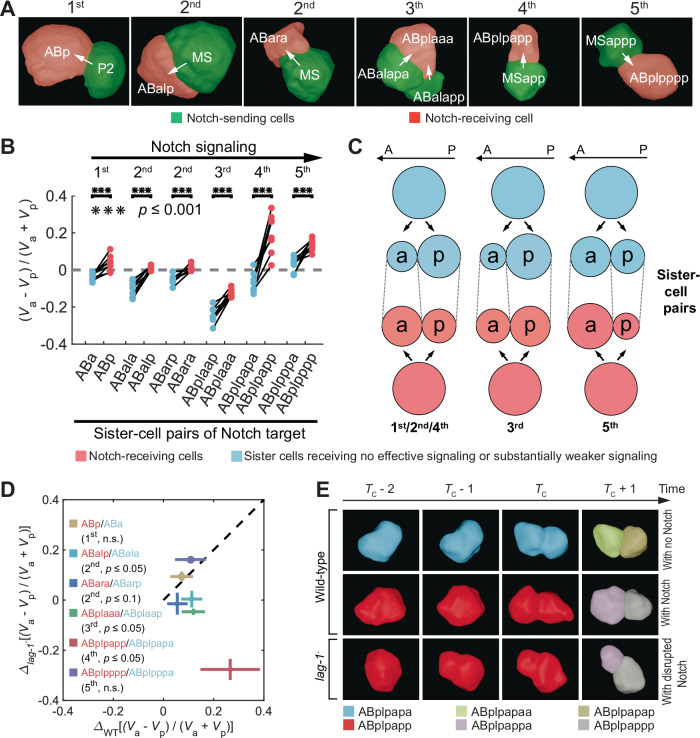
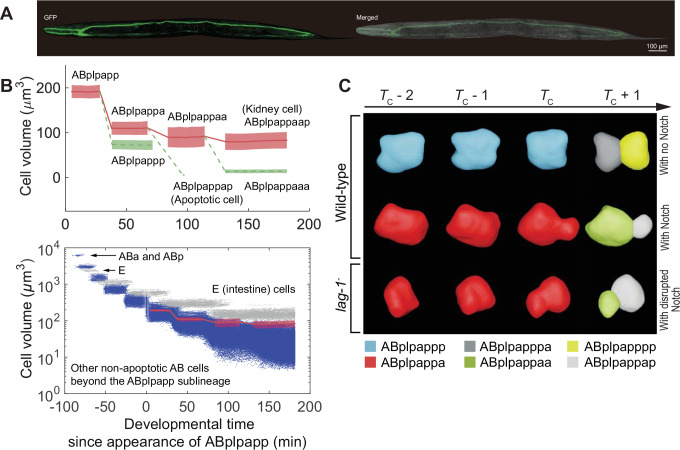
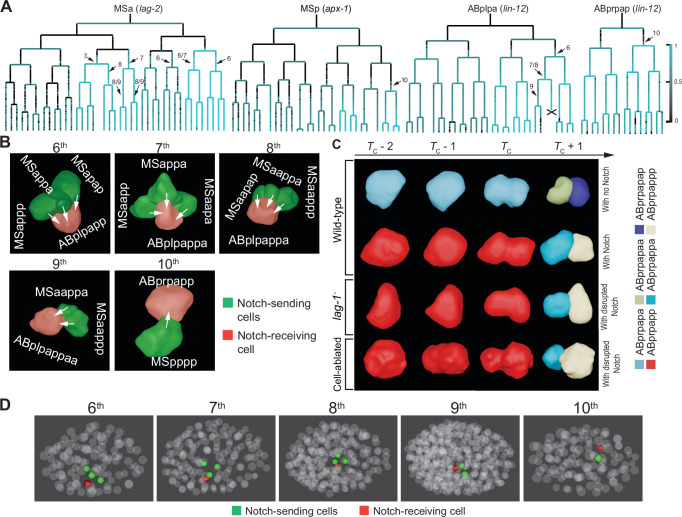
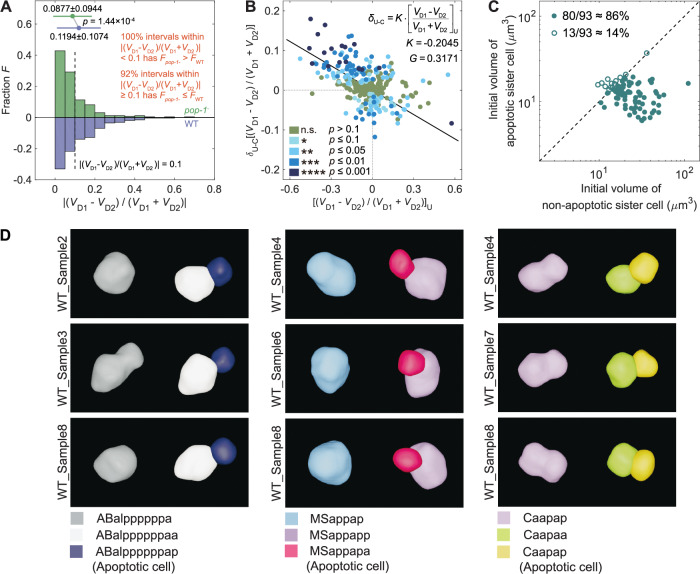
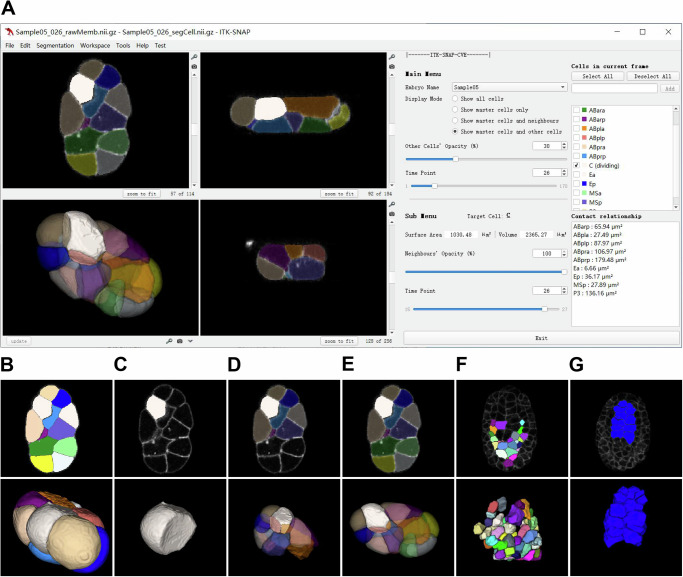
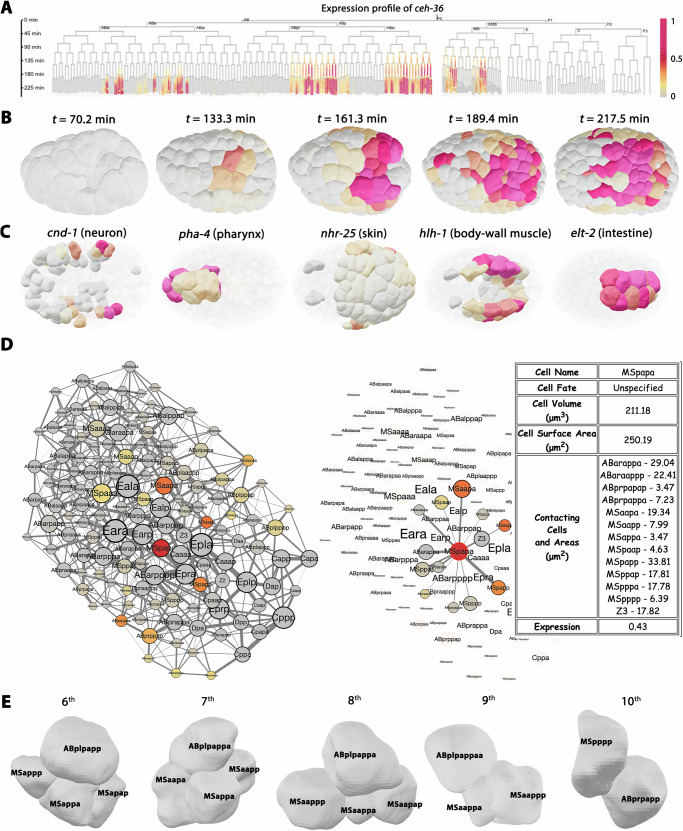
How cells change shape is crucial for the development of tissues, organs and embryos. However, studying these shape changes in detail is challenging. Here we present a comprehensive real-time cellular map that covers over 95% of the cells formed during Caenorhabditis elegans embryogenesis, featuring nearly 400,000 3D cell regions. This map includes information on each cell's identity, lineage, fate, shape, volume, surface area, contact area, and gene expression profiles, all accessible through our user-friendly software and website. Our map allows for detailed analysis of key developmental processes, including dorsal intercalation, intestinal formation, and muscle assembly. We show how Notch and Wnt signaling pathways, along with mechanical forces from cell interactions, regulate cell fate decisions and size asymmetries. Our findings suggest that repeated Notch signaling drives size disparities in the large excretory cell, which functions like a kidney. This work sets the stage for in-depth studies of the mechanisms controlling cell fate differentiation and morphogenesis.


Conflict of interest statement

Competing interests: The authors declare no competing interests.

Figures

Fig. 1
Fig. 1. The pipeline of cellular morphology reconstruction for C. elegans embryogenesis by CMap.
A The data processing pipeline of CMap. Time-lapse 3D (4D) images of GFP-labeled cell nuclei and mCherry-labeled cell membranes are used for cell lineage tracing and morphology segmentation respectively, with output of cell identity (with information on cell lineage and cell fate), cell shape, volume, surface area, and contact area over embryogenesis. The EDT-DMFNet segmentation model of cell membrane morphology is explained in detail in Fig. S6. B Top: 3D projections of a dually labeled embryo at representative developmental stages indicated above; middle: outputs of cell nucleus tracing; bottom: outputs of cell membrane segmentation. Nuclei and membranes are differentially colored based on their lineal origins as indicated.
Fig. 2
Fig. 2. Statistics of the cells with resolved cell lineage and morphology up to the 550-cell stage of C. elegans embryogenesis.
A The embryonic cell lineage tree averaged over the eight C. elegans wild-type embryos up to the 550-cell stage. Cell fates are differentially color-coded as indicated. The excretory cell and the sole body-wall muscle cell derived from the AB lineage are indicated with black and gray arrowhead respectively. The cells with consistent failures in segmentation in all embryo samples are indicated with black dots. Developmental time is shown on the left, with the last time point of the four-cell stage set as the time zero. B Cell counts across developmental stages for the eight embryos, with the average cell numbers represented by dots (black for surviving cells and red for apoptotic ones) and their standard deviations by vertical lines. The duration of significant developmental landmarks is indicated by differential shading. C, D Comparison of average cell volume (C) and cell surface area (D) with individual measurements from the eight C. elegans embryos. Data points represent individual cell comparisons, with the average across embryos on the horizontal axis and individual embryo measurements on the vertical axis. Cells present before and after the ~350-cell stage are color-coded in blue and yellow, respectively. Insets show the distribution of variation coefficients (defined as the ratio of standard deviation to average) for these comparisons, based on 322 and 267 unique cells before and after the ~350-cell stage respectively. Source data are provided as a Source Data file.
Fig. 3
Fig. 3. Cell shape dynamics across tissue formation and organogenesis during late embryogenesis.
A Visualization of cell shapes within whole embryo or within specific tissues/organs from various perspectives. B–D Depiction of dynamic cell shape changes in different tissues during late embryogenesis: skin cells (hypodermis) during dorsal intercalation (B), intestine cells during intestinal twisting and elongation (C), and body-wall muscle cells during the ingression of the AB-derived body-wall muscle cell (ABprpppppaa), which is indicated by an arrow (D). Developmental time and stage are shown on the left, with the last time point of the four-cell stage set as the time zero. EG Quantification of cell irregularity (η) for the processes shown in (BD). Panel (E) presents the average (solid dot) and standard deviation (solid line) of the irregularity for 9 skin cells, as indicated by arrowheads in (B), during the developmental timeline (t) in an exemplary embryo with the last time point of the four-cell stage set as the time zero. Panel (F) presents similar data for all cells during the developmental timeline (t) in an exemplary embryo. Panel (G) presents the average (solid dot) and standard deviation (solid line) of cell shape irregularity (η) for the cell ABprpppppaa during the developmental timeline (t) in eight embryos. In (E, G), the maximums and minimums are denoted by green and pink triangles respectively, and the correlation coefficients for the monotonic ηt curves are shown at the top. Source data are provided as a Source Data file.
Fig. 4
Fig. 4. Notch signaling promotes directional asymmetry in cell volume between anterior and posterior daughters of the target cell and its sibling.
A Reconstructed 3D morphologies of contacting cell pairs engaged in the Notch signaling events during C. elegans embryogenesis identified previously. The relevant cell identities were described elsewhere. Cells expressing Notch ligands are highlighted in green, while those expressing receptors are in red. B Plots showing the volume asymmetry ratio, calculated as the net volume difference over the combined volume of anterior and posterior daughter cells from six sister-cell pairs in eight wild-type embryos. Data for the six Notch target cells (ABp, ABalp, ABara, ABplaaa, ABplpapp, and ABplpppp) are shown in red, and data for their sisters receiving no effective signaling (ABa, ABala, ABarp, ABplaap, and ABplpppa) or substantially weaker signaling (ABplpapa) are shown in blue. The statistical significance is obtained by the one-sided Wilcoxon rank-sum test and is listed at the top. C A summary graph showing the alteration in cell volume asymmetry between the daughters of six Notch target cells (red) or between the daughters of their sisters receiving no effective signaling or substantially weaker signaling (blue). Cells are colored as in (B). D Comparison of volume (V) asymmetries of daughters of Notch target cells between wild-type (horizontal) and perturbed (vertical) embryos by RNAi against lag-1. The cell volume asymmetry between each pair of daughter cells is averaged over eight wild-type replicates and over two lag-1- replicates. The statistical significance is obtained by the one-sided Wilcoxon rank-sum test and is listed on the left, along with the data average (solid dot) and standard deviation (solid line) presented. E Comparison of morphological changes between the Notch-responsive ABplpapp cell (middle) that receives the fourth Notch signaling and its sibling (top), which receives substantially weaker or no effective Notch signaling, in a wild-type embryo, or the ABplpapp cell in a perturbed embryo with RNAi against lag-1 (bottom). Note the directional size asymmetry in the division of ABplpapp (middle) in contrast to its sister (top), and its perturbed state in embryos with RNAi against lag-1 (bottom). TC denotes the last time point of cytokinesis. Source data are provided as a Source Data file.
Fig. 5
Fig. 5. Consecutive asymmetric divisions in terms of cell volume lead to a disproportionately large size of the excretory cell, ABplpappaap.
A The “H”-shaped excretory cell labeled by GFP (left) or its merge with differential interference contrast microscopy (DIC) (right) in an adult. B Top: quantification of volume changes over embryogenesis for the excretory cell and all the progeny of its great-grandmother, ABplpapp. The graph shows the average cell volumes (line) and their standard deviations (shaded area) for the excretory cell and its progenitors from eight wild-type embryos in red, and for their sister cells in green. Bottom: quantification of volume change over embryogenesis for all cells derived from AB (blue) and E (gray) with that for the excretory cell and its progenitors (red, same data as in upper row). The time of ABplpapp’s birth is used as the reference point (time zero). C Comparison of morphological changes between the excretory cell’s grandmother ABplpappa with Notch signaling (middle) and its sibling with substantially weaker or no effective Notch signaling (top), in a wild-type embryo, or the ABplpappa cell in a perturbed embryo with RNAi against lag-1 (bottom). Note the directional size asymmetry in the division of ABplpappa (middle) in contrast to its sister (top), and its perturbed state in embryos with RNAi against lag-1 (bottom). TC denotes the last time point of cytokinesis. Source data are provided as a Source Data file.
Fig. 6
Fig. 6. Identification of new Notch signaling interactions with size effect on the excretory cell progenitors and a symmetric cell.
A Lineal expression (blueness on cell lineage tree) of two ligands, lag-1 and apx-1, and one receptor, lin-12, of the Notch signaling pathway, each derived from an exemplary wild-type embryo. The lag-2 expression in MSapap is deduced based on previous studies,,,. The color scale is shown on the right. Cells involved in the sixth-tenth signaling events are indicated with arrows. Apoptosis is marked with an “X”. B Reconstructed 3D morphologies of contacting cell pairs engaged in the newly identified Notch signaling events during C. elegans embryogenesis. Cells expressing Notch ligands are highlighted in green, while those expressing the receptor are in red. C Comparison of morphological changes between the Notch-responsive ABprpapp cell (2nd row) that is deduced to receivs the tenth Notch signaling and its sibling (1st row), which  is deduced to receive substantially weaker or no effective Notch signaling, in a wild-type embryo, or the ABprpapp cell in a perturbed embryo by RNA against lag-1 (3rd row) or laser ablation on MSpp (4th row). Note the directional size asymmetry in the division of ABprpapp (2nd row) in contrast to its sister (1st row), or its perturbed counterpart in embryos with RNAi against lag-1 (3rd row) or laser ablation of MSpp (4th row). TC denotes the last time point of cytokinesis. D Positions (illustrated with the cell nucleus positions) of the Notch-responsive cells (red), Notch-signaling cells (green), and others (semi-transparent gray) at the moments when the sixth-tenth signaling events take place. Source data are provided as a Source Data file.
Fig. 7
Fig. 7. Multiple mechanisms contribute to the cell volume asymmetry between daughter cells.
A The distribution of cell volume asymmetry between daughter cells without positional bias (VD1VD2VD1+VD2) in the wild-type and pop-1- (pop-1 RNAi) embryos. The cell volume asymmetry between each pair of daughter cells is averaged over eight wild-type replicates and over two pop-1- replicates. Based on 257 pairs of daughter cells present in all wild-type and pop-1- embryos, the statistical significance is obtained by the one-sided Wilcoxon rank-sum test and is listed in the top right corner, along with the data average (solid dot) and standard deviation (solid line) presented. B The negative correlation between the shift of cell volume asymmetry with (δUCVD1VD2VD1+VD2) and without mechanical compression (VD1VD2VD1+VD2U). The result of proportional fitting between VD1VD2VD1+VD2U and δUCVD1VD2VD1+VD2 is shown with a solid line, with the proportional coefficient (K) and goodness of fit (G) listed in the top right corner. The cell volume asymmetry between each pair of daughter cells is averaged over eight wild-type uncompressed replicates and 17 wild-type compressed replicates. The statistical significance is obtained by the one-sided Wilcoxon rank-sum test and is listed in the bottom left corner. C The apoptotic cells (vertical) are mostly smaller in volume compared to their sisters (horizontal) upon their birth. Shown are average volumes of 93 non-apoptotic and apoptotic sister-cell pairs recorded in the eight wild-type embryos, 80 of which have a relatively smaller volume for the apoptotic cells. D The illustration for asymmetric divisions of three representative parents of apoptotic cells from the AB (left), MS (middle), and C (right) lineages. For each cell, only cellular morphology at the time points before and after cytokinesis is shown. Source data are provided as a Source Data file.
Fig. 8
Fig. 8. ITK-SNAP-CVE: A customized software tool for the visualization and interactive analysis of embryonic cell morphologies.
A The main graphical user interface of ITK-SNAP-CVE, showcasing the layout and available tools. B The visual representations of all cells within an embryo using the software’s “Show all cells” display mode, with 2D views (top) and 3D reconstructions (bottom). CE The detailed visualization of a selected individual cell, i.e., the somatic founder cell “C”, within an embryo, as seen through different viewing options: Panel (C) “Show master cells only” display mode, highlighting the “C” cell alone. Panel (D) “Show master cells and neighbors” display mode, highlighting the “C” cell along with its immediate neighboring cells. Panel (E) “Show master cells and other cells” display mode, where the “C” cell is visible in the context of the entire cell population. F A comprehensive view of all cells derived from the same lineage, exemplified here by the MS sublineage, demonstrating the lineage-specific visualization capabilities of the software. G A display of all cells that are destined to become part of the same organ, in this case, the intestine, illustrating the software’s functionality to group cells by their developmental fate.
Fig. 9
Fig. 9. CMOS: An interactive web platform for visualizing embryonic cell morphologies, intercellular contacts, and cell-resolved lineal gene expressions.
A The lineage-specific expression of the transcription factor, ceh-36, over approximately four hours from the four-cell stage. The relationship between gene expression level and color is displayed on the right. B The 3D views of an exemplary embryo at specified developmental stages (t, imaging time) with an overlay of ceh-36 expression (color-coded as in (A)). The embryo is oriented in a dorsal view with the anterior to the left. C The 3D views of different tissues and organs with highlighted expression of corresponding specific cell fate markers (color-coded as in (A)). The embryo is oriented in a ventral view with the anterior to the left. D The comparative views of a cell-cell contact map in an over 200-minute-old embryo (as seen in (B)): a global (left) and a cell-centric perspective (right). Intercellular contacts can be further examined in detail via an interactive table that appears upon clicking on a cell of interest. The thickness of the connecting lines corresponds to the cell-cell contact area. Expression levels for ceh-36 are superimposed on relevant cells, consistent with the visualization in (B). E The visualization of intercellular contacts for the sixth-tenth Notch signaling events (Fig. 6B) through the website. Source data are provided as a Source Data file.

Similar articles

References

    1. Arendt, D. et al. The origin and evolution of cell types. Nat. Rev. Genet.17, 744–757 (2016). - PubMed
    1. Domcke, S. & Shendure, J. A reference cell tree will serve science better than a reference cell atlas. Cell186, 1103–1114 (2023). - PubMed
    1. Qiu, C. et al. Systematic reconstruction of cellular trajectories across mouse embryogenesis. Nat. Genet.54, 328–341 (2022). - PMC - PubMed
    1. Packer, J. S. et al. A lineage-resolved molecular atlas of C. elegans embryogenesis at single-cell resolution. Science365, eaax1971 (2019). - PMC - PubMed
    1. Qiu, C. et al. A single-cell time-lapse of mouse prenatal development from gastrula to birth. Nature626, 1084–1093 (2024). - PMC - PubMed

MeSH terms

Substances

LinkOut - more resources