. 2025 Apr 18;16(1):3701.
doi: 10.1038/s41467-025-59042-4.

A microengineered 3D human neurovascular unit model to probe the neuropathogenesis of herpes simplex encephalitis

Affiliations

A microengineered 3D human neurovascular unit model to probe the neuropathogenesis of herpes simplex encephalitis

Min Zhang et al. Nat Commun. .

Abstract

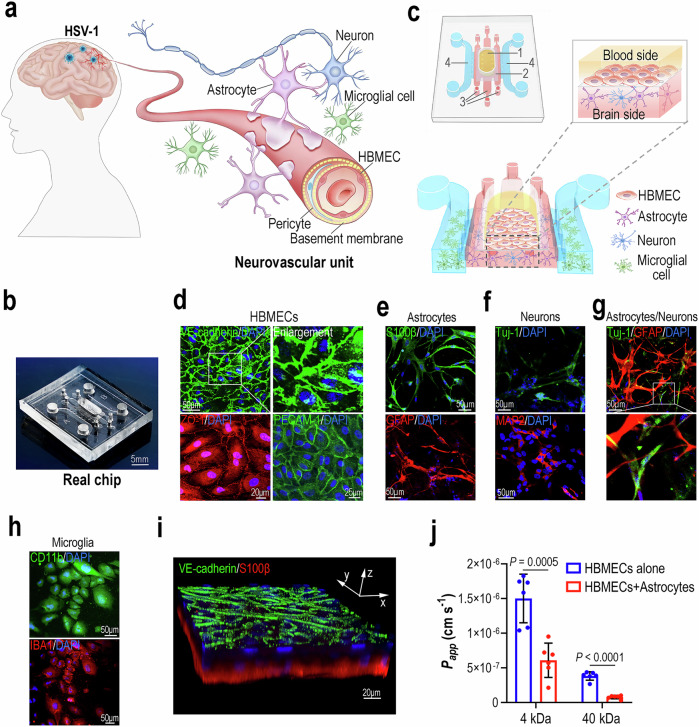
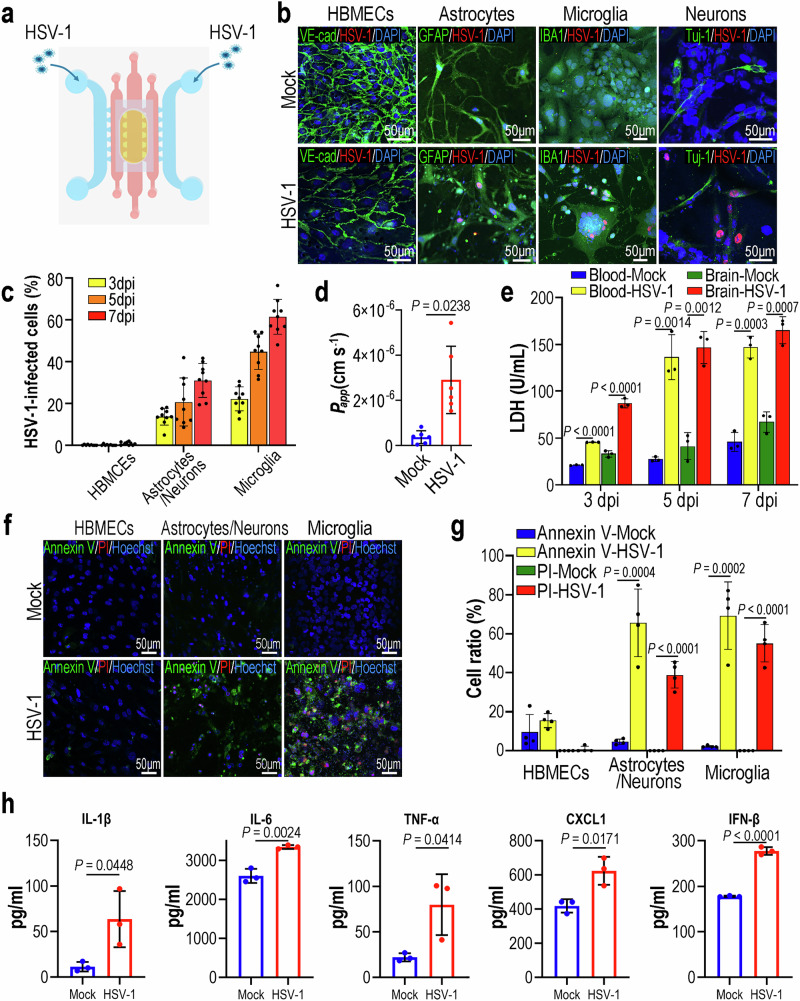
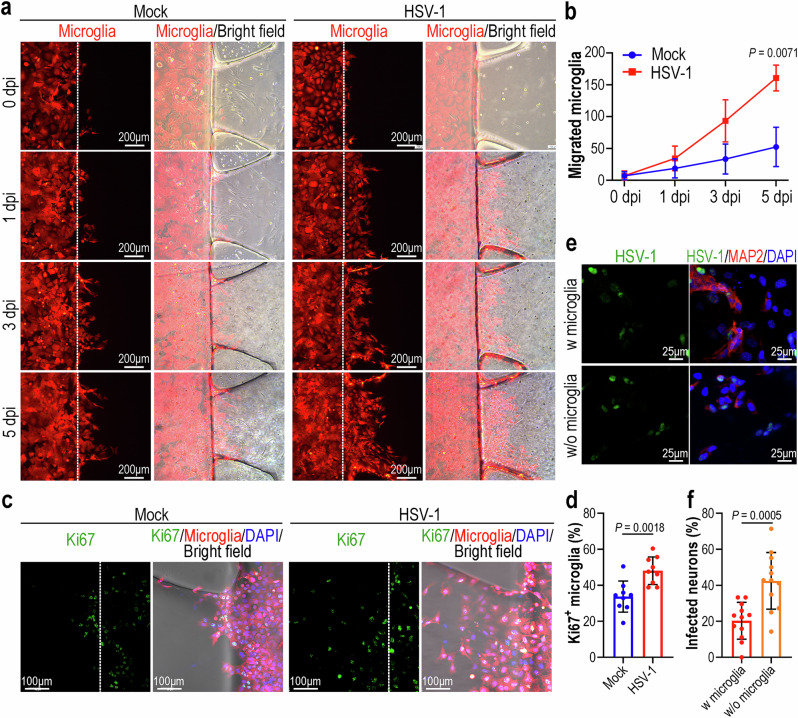
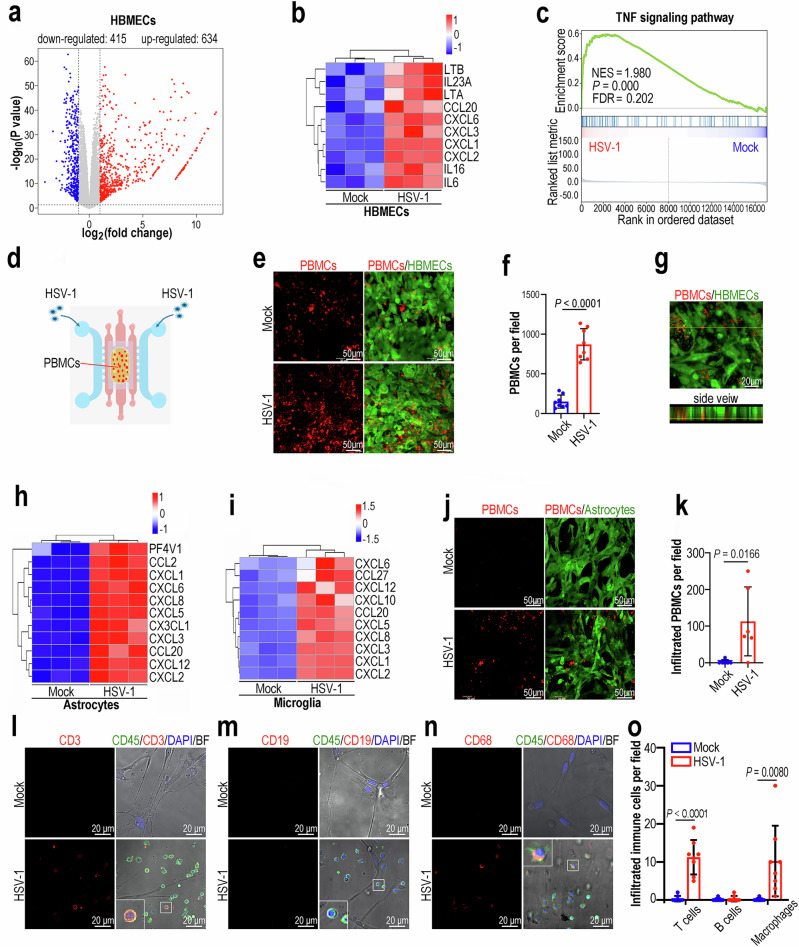
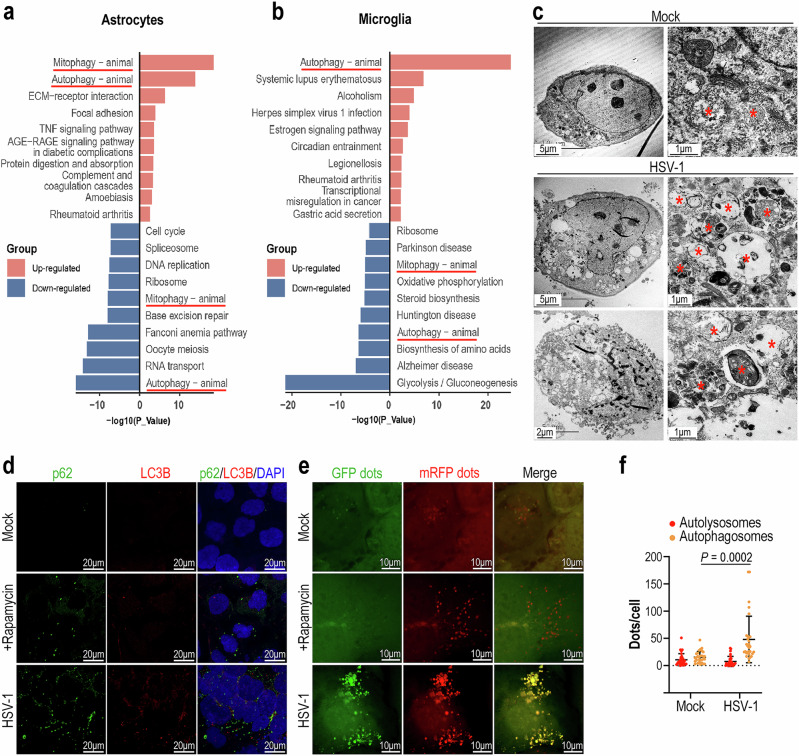
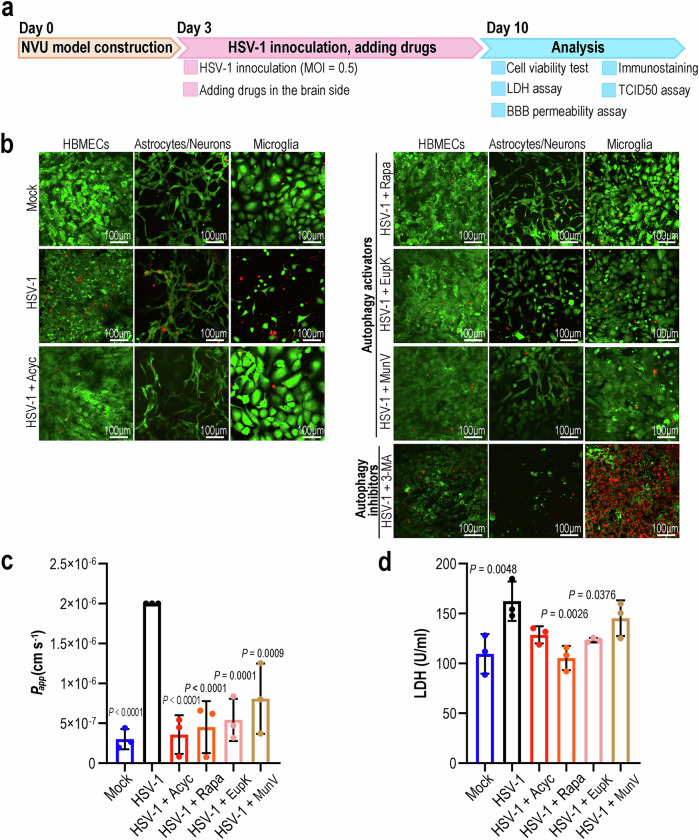
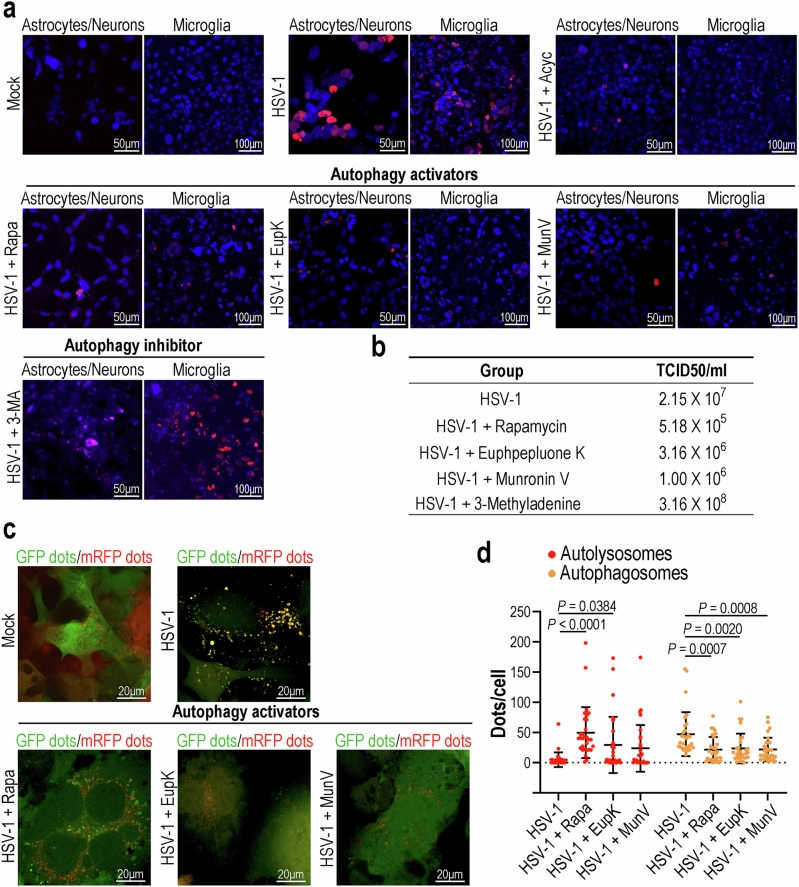
Herpes simplex encephalitis (HSE) caused by HSV-1 is the most common non-epidemic viral encephalitis, and the neuropathogenesis of HSE remains elusive. This work describes a 3D human neurovascular unit (NVU) model that allows to explore the neuropathogenesis of HSE in vitro. This model is established by co-culturing human microvascular endothelial cells, astrocytes, microglia and neurons on a multi-compartment chip. Upon HSV-1 infection, this NVU model exhibited HSE-associated pathological changes, including cytopathic effects, blood-brain barrier dysfunction and pro-inflammatory cytokines release. Besides, significant innate immune responses were observed with the infiltration of peripheral immune cells and microglial activation. Transcriptomic analysis revealed broadly inflammatory and chemotactic responses in host cells. Mechanistically, we found HSV-1 could induce severe suppression of autophagic flux in glial cells, especially in microglia. Autophagy activators could effectively inhibit HSV-1 replication and rescue neurovascular injuries, indicating the utility of this unique platform for studying neurological diseases and new therapeutics.


Conflict of interest statement

Competing interests: The authors declare no competing interests.

Figures

Fig. 1
Fig. 1. Establishment of a 3D human NVU model for HSE study.
a Schematic diagram of the human neurovascular unit. b Image of a real chip. c 3D schematic diagram showing cell culture on the NVU chip. The yellow area indicates the HBMECs culture compartment of the blood side (1). The dark gray area indicates the porous PCTE membrane between the blood side and brain side (2). The red area indicates the astrocytes/neurons culture compartment of the brain side (3). The blue area indicates the microglia culture compartment of the brain side (4). d 3 days after seeding cells on the chip, confocal micrographs showing the HBMECs on the chip, immunostained for VE-cadherin, ZO-1 and PECAM-1. e Confocal micrographs showing the astrocytes on the chip, immunostained for S100β and GFAP. f Confocal micrographs showing the neurons on the chip, stained for Tuj-1 and MAP2. g A confocal micrograph showing the co-culture of astrocytes (GFAP) and neurons (Tuj-1) in Matrigel. h Confocal micrographs showing the microglia on the chip, immunostained for CD11b and IBA1. i A 3D configuration image showing BBB interface formed by HBMECs (VE-cadherin) and astrocytes (S100β) after co-culture for 3 days. di Representative images were from 3 biological replicates. All experiments were repeated at least 3 times. j FITC-dextran permeability assays for BBB formed by HBMECs alone, or HBMECs and astrocytes, after culture for 3 days (n = 6 for biological replicates; n = 3 for technical replicates). Data are presented as the mean ± SD and were analyzed using an unpaired two-sided Student’s t-test.
Fig. 2
Fig. 2. HSV-1 infection on the NVU model.
a Schematic diagram of HSV-1 inoculation on the NVU model. b Confocal micrographs showing the HBMECs, astrocytes, microglia and neurons following HSV-1 infection at 7 dpi on the chip by detecting for viral gG protein (red) (n = 3 for biological replicates; n = 3 for technical replicates). c Quantification of the infected cells for HBMECs, astrocytes/neurons and microglia and at 3, 5 and 7 dpi (n = 3 for biological replicates; n = 3 for technical replicates). Three fields were quantified for each chip. Data are presented as the mean ± SD. d BBB permeability assay using 4 kDa FITC-dextran for Mock or HSV-1-infected NVU chips at 7 dpi (n = 6 for biological replicates; n = 3 for technical replicates). Data are presented as the mean ± SD and were analyzed using an unpaired Student’s t-test. e LDH assay for Mock or HSV-1-infected NVU chips at 3, 5, and 7 dpi, respectively (n = 3 for biological replicates; n = 3 for technical replicates). Data are presented as the mean ± SD and were analyzed using an unpaired two-sided Student’s t-test. f Confocal micrographs of HBMECs, astrocytes/neurons, and microglia, stained with Annexin V-FITC/PI dyes following HSV-1 infection at 7 dpi (n = 4 for biological replicates; n = 3 for technical replicates). g Quantification of Annexin V positive or PI-positive cells for HBMECs, astrocytes/neurons, and microglia following HSV-1 infection, based on (f) (n = 4 for biological replicates; n = 3 for technical replicates). Data are presented as the mean ± SD and were analyzed using an unpaired two-sided Student’s t-test. h ELISA results of medium from brain side for Mock or HSV-1-infected chips at 3 dpi (n = 3 for biological replicates; n = 3 for technical replicates). Data are presented as the mean ± SD and were analyzed using an unpaired two-sided Student’s t-test.
Fig. 3
Fig. 3. Changes of microglia following HSV-1 infection on the NVU model.
a Fluorescent images showing microglial migration (red) following HSV-1 infection on the chip at 0, 1, 3, and 5 dpi (n = 3 for biological replicates; n = 3 for technical replicates). The dotted white line indicates the interface between astrocytes-neurons compartment and microglia compartment. b Quantification of the migrated microglia at 0, 1, 3 and 5 dpi (n = 3 for biological replicates; n = 3 for technical replicates). Data are presented as the mean ± SD and were analyzed using an unpaired two-sided Student’s t-test. c Confocal micrographs of microglia (red) immunostained for Ki67 at 4 dpi (n = 3 for biological replicates; n = 3 for technical replicates). The dotted white line indicates the interface between astrocytes-neurons compartment and microglia compartment. d Quantification of Ki67+ microglia based on c. Three fields were quantified for each chip. Data are presented as the mean ± SD and were analyzed using an unpaired two-sided Student’s t-test. e Confocal micrographs of astrocytes/neurons immunostained for viral gG protein (green) and MAP2 (red) at 4 dpi, with or without microglia (n = 4 for biological replicates; n = 3 for technical replicates). f Quantification of the infected neurons based on (c) (n = 4 for biological replicates; n = 3 for technical replicates). Three fields were quantified for each chip. Data are presented as the mean ± SD and were analyzed using an unpaired two-sided Student’s t-test.
Fig. 4
Fig. 4. HSV-1 infection triggered chemotactic response and infiltration of peripheral immune cells on the NVU model.
a Scatter plots showing the differentially expressed genes in HBMECs following HSV-1 infection at 3 dpi. Genes differentially expressed with fold changes of >2.0 and P < 0.05 are marked in color. P-values were calculated using a two-sided, unpaired Student’s t-test with equal variance assumed (n = 3). b Heatmap indicating the expression levels of upregulated genes annotated to cytokine activity (GO: 0005125) in HBMECs (n = 3). c GSEA analysis reveals the correlation between HSV-1 infection and genes involved in the TNF signaling pathway in HBMECs. The analyses were all one-sided and adjustments were made for multiple comparisons. NES normalized enrichment score, FDR false discovery rate. Gene sets were considered significant when P < 0.05 and FDR < 0.25. d Schematic diagram of adding PBMCs following HSV-1 inoculation on the NVU model. e Fluorescent micrographs of PBMCs (red) attached to the HBMECs (green) following HSV-1 infection at 3 dpi (n = 4 for biological replicates; n = 3 for technical replicates). f Quantification of the attached PBMDs per filed for the Mock or HSV-1-infected chips (n = 4 for biological replicates; n = 3 for technical replicates). Two fields were quantified for each chip. Data are presented as the mean ± SD and were analyzed using an unpaired two-sided Student’s t-test. g Fluorescent micrographs of migrating PBMCs through the brain endothelium on the HSV-1-infected chip (n = 4 for biological replicates; n = 3 for technical replicates). h Heatmap indicating the expression levels of upregulated genes annotated to chemokine activity (GO: 0008009) in astrocytes (n = 3). i Heatmap indicating the expression levels of upregulated genes annotated to chemokine activity (GO: 0008009) in microglia (n = 3). j Fluorescent micrographs of infiltrated PBMCs in the astrocytes culture compartment 3 h after PBMCs addition (n = 3 for biological replicates; n = 3 for technical replicates). k Quantification of the infiltrated PBMCs per filed for the Mock or HSV-1-infected chips (n = 3 for biological replicates; n = 3 for technical replicates). Two fields were quantified for each chip. Data are presented as the mean ± SD and were analyzed using an unpaired two-sided Student’s t-test. l Fluorescent micrographs showing infiltrated T cells (CD45+CD3+) in the astrocytes culture compartment 24 h after PBMCs addition (n = 4 for biological replicates; n = 3 for technical replicates). m Fluorescent micrographs showing infiltrated B cells (CD45+CD19+) in the astrocytes culture compartment 24 h after PBMCs addition (n = 4 for biological replicates; n = 3 for technical replicates). n Fluorescent micrographs showing infiltrated macrophages (CD45+CD68+) in the astrocytes culture compartment 24 h after PBMCs addition (n = 4 for biological replicates; n = 3 for technical replicates). o Quantification of the infiltrated T cells, B cells and macrophages per field for the Mock or HSV-1-infected chips (n = 4 for biological replicates; n = 3 for technical replicates). Two fields were quantified for each chip. Data are presented as the mean ± SD and were analyzed using an unpaired two-sided Student’s t-test.
Fig. 5
Fig. 5. Autophagy dysregulation in glial cells induced by HSV-1 infection on the NVU model.
a KEGG pathway enrichment analysis of upregulated genes and downregulated genes in astrocytes following HSV-1 infection at 3 dpi. b KEGG pathway enrichment analysis of upregulated genes and downregulated genes in microglia following HSV-1 infection at 3 dpi. a, b Autophagy-related terms were marked with red boxes. The analyses were all one-sided and adjustments were made for multiple comparisons. c TEM images showing microglia on Mock or HSV-1-infected NVU models at 3 dpi (n = 3 for biological replicates; n = 3 for technical replicates). The autophagic vacuoles were indicated by red asterisks. d Confocal micrographs showing the microglia immunostained for p62 (green) and LC3B (red) following HSV-1 infection at 3 dpi on the chip (n = 3 for biological replicates; n = 3 for technical replicates). The chip treated with rapamycin was used as a positive control group. e Confocal micrographs showing autophagic flux in microglia following HSV-1 infection at 3 dpi (n = 3 for biological replicates; n = 3 for technical replicates). The red dots indicate autolysosome, and the yellow dots indicate autophagosome. The chip treated with rapamycin was used as a positive control. f Quantification of autolysosome and autophagosome numbers in microglia following HSV-1 infection based on (e) (n = 3 for biological replicates; n = 3 for technical replicates). Ten cells were quantified for each chip. Data are presented as the mean ± SD and were analyzed using an unpaired two-sided Student’s t-test.
Fig. 6
Fig. 6. Evaluation of HSV-1-induced neurovascular injury in response to autophagy activators treatment on the NVU model.
a Experimental flow diagram showing the drug testing on the HSV-1 encephalitis model. b Cell viability assay showing the therapeutic effects of different drugs on HBMECs, Astrocytes/Neurons, and microglia following HSV-1 infection on the model at 7 dpi (n = 3 for biological replicates; n = 3 for technical replicates). Acyclovir (Acyc) was used as a positive control drug. Rapa rapamycin, 3-MA 3-methyladenine, Euphpepluone K EupK, Munronin V MunV. Cells were stained with LIVE/DEAD® Viability/Cytotoxicity Kit, and red color indicates the dead cell. c 4 kDa FITC-dextran assay showing the effects of different drugs on the BBB permeability following HSV-1 infection at 7 dpi (n = 3 for biological replicates; n = 3 for technical replicates). Data are presented as the mean ± SD and were analyzed using a one-way analysis of variance (ANOVA) followed by the Bonferroni post hoc test. d LDH assay showing the therapeutic effects of different drugs on the model following HSV-1 infection at 7 dpi (n = 3 for biological replicates; n = 3 for technical replicates). Data are presented as the mean ± SD and were analyzed using a one-way ANOVA followed by the Bonferroni post hoc test.
Fig. 7
Fig. 7. Assessment of HSV-1 infection and autophagic flux in microglia following autophagy activators treatment on the NVU model.
a At 7 dpi, confocal micrographs showing the HSV-1 infection (red, immunostained for viral gG protein) in astrocytes/neurons and microglia after adding the indicated drugs (n = 3 for biological replicates; n = 3 for technical replicates). b TCID50 assay showing the antiviral effects of different drugs on the brain side (n = 3 for biological replicates; n = 3 for technical replicates). c Confocal micrographs showing autophagic flux in microglia with the addition of indicated drugs following HSV-1 infection at 3 dpi n = 3 for biological replicates; n = 3 for technical replicates. The red dots indicate autolysosome, and the yellow dots indicate autophagosome. d Quantification of autolysosome and autophagosome numbers in microglia of the HSV-1-infected chips after adding indicated drugs (n = 3 for biological replicates; n = 3 for technical replicates). Ten cells were quantified for each chip. Data are presented as the mean ± SD and were analyzed using a one-way ANOVA followed by the Bonferroni post hoc test.

Similar articles

References

    1. Marcocci, M. E. et al. Herpes simplex virus-1 in the brain: the dark side of a sneaky infection. Trends Microbiol.28, 808–820 (2020). - PubMed
    1. Stahl, J. P. & Mailles, A. Herpes simplex virus encephalitis update. Curr. Opin. Infect. Dis.32, 239–243 (2019). - PubMed
    1. Gnann, J. W. Jr. & Whitley, R. J. Herpes simplex encephalitis: an update. Curr. Infect. Dis. Rep.19, 13 (2017). - PubMed
    1. Bradshaw, M. J. & Venkatesan, A. Herpes simplex virus-1 encephalitis in adults: pathophysiology, diagnosis, and management. Neurotherapeutics13, 493–508 (2016). - PMC - PubMed
    1. Liu, H. et al. Proteomics analysis of HSV-1-induced alterations in mouse brain microvascular endothelial cells. J. Neurovirol.25, 525–539 (2019). - PubMed

MeSH terms

LinkOut - more resources