. 2025 Apr 18;16(1):3705.
doi: 10.1038/s41467-025-58204-8.

Covalently reactive microparticles imbibe blood to form fortified clots for rapid hemostasis and prevention of rebleeding

Affiliations

Covalently reactive microparticles imbibe blood to form fortified clots for rapid hemostasis and prevention of rebleeding

Ting Chen et al. Nat Commun. .

Abstract

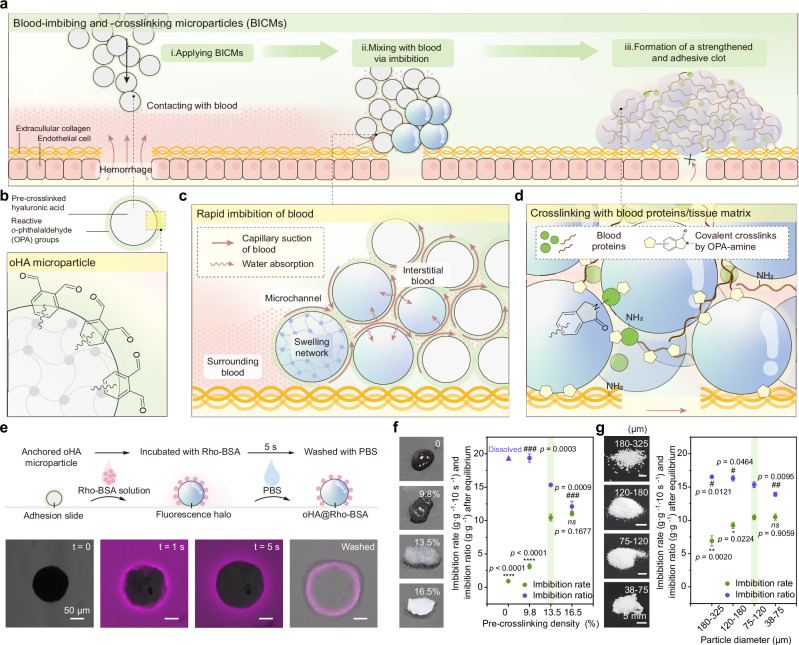
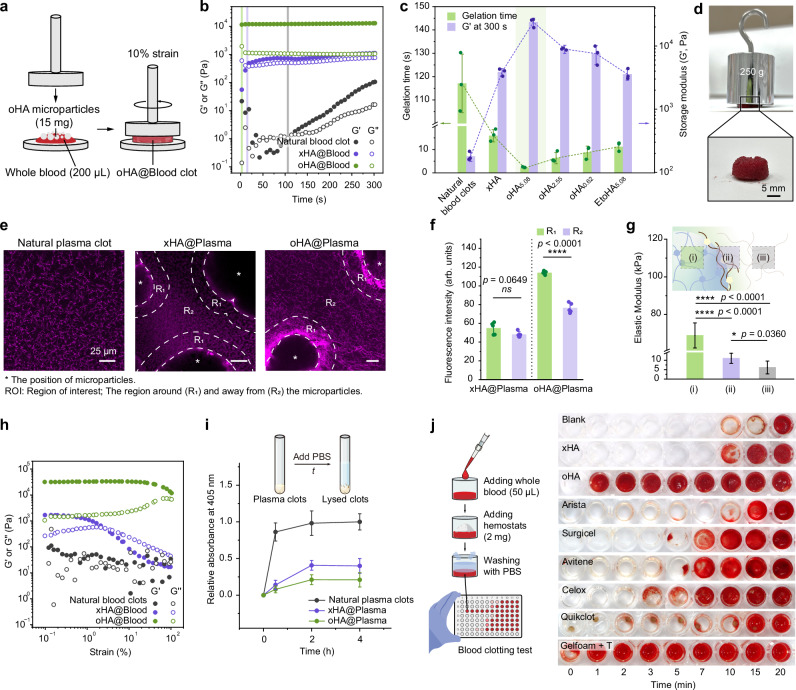
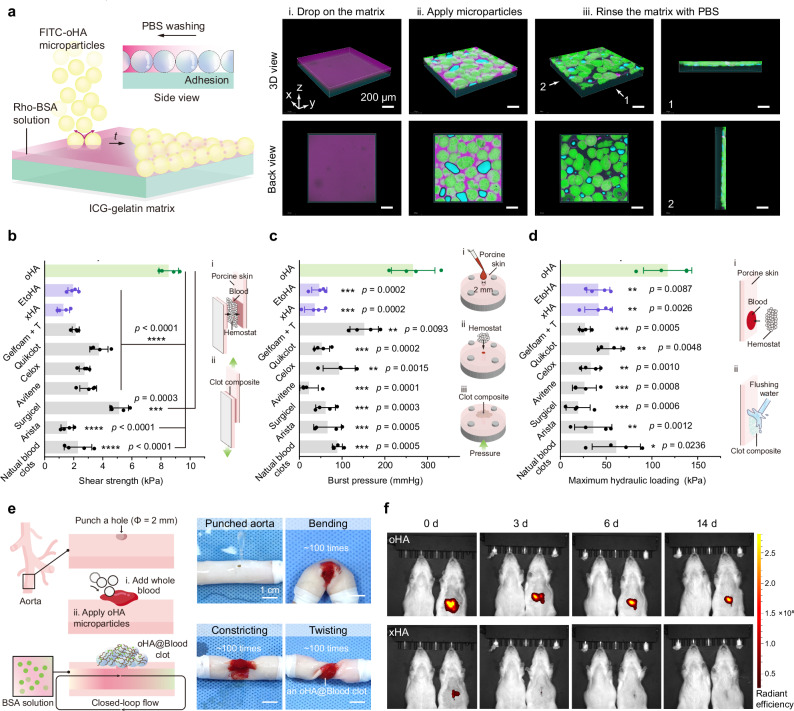
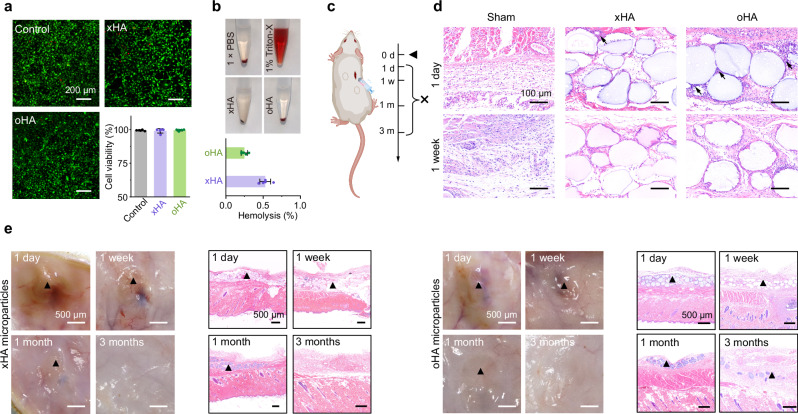
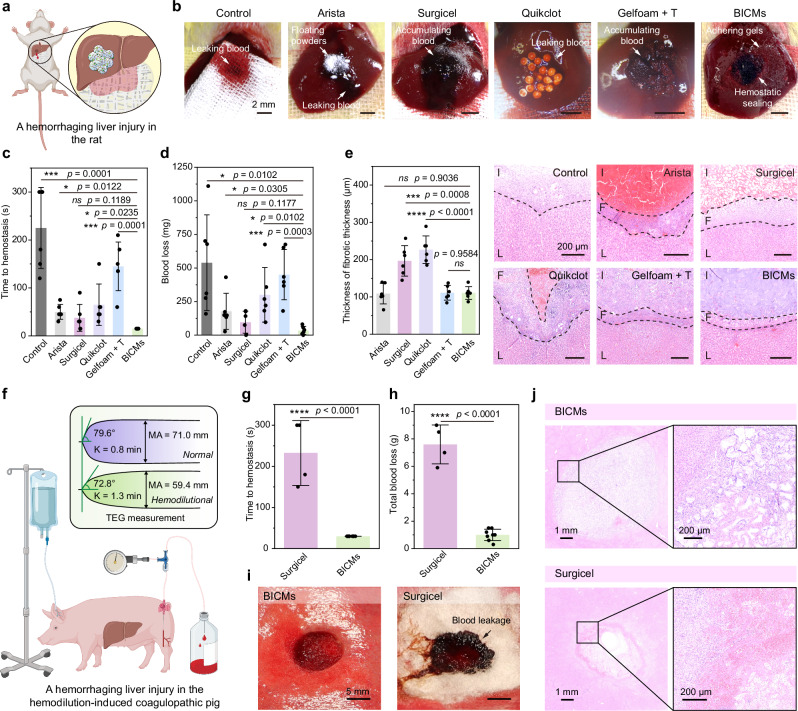
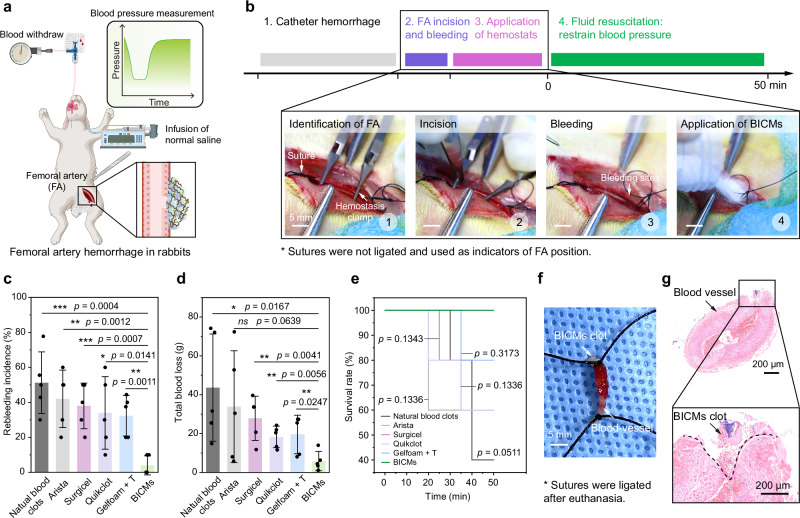
Owing to the inherently gradual nature of coagulation, the body fails in covalently crosslinking to stabilize clots rapidly, even with the aid of topical hemostats, thus inducing hemostatic failure and potential rebleeding. Although recently developed adhesives confer sealing bleeding sites independently of coagulation, interfacial blood hampers their adhesion and practical applications. Here, we report a covalently reactive hemostat based on blood-imbibing and -crosslinking microparticles. Once contacting blood, the microparticles automatically mix with blood via imbibition and covalently crosslink with blood proteins and the tissue matrix before natural coagulation operates, rapidly forming a fortified clot with enhanced mechanical strength and tissue adhesion. In contrast to commercial hemostats, the microparticles achieve rapid hemostasis (within 30 seconds) and less blood loss (approximately 35 mg and 1 g in the rat and coagulopathic pig models, respectively), while effectively preventing blood-pressure-elevation-induced rebleeding in a rabbit model. This work advances the development and clinical translation of hemostats for rapid hemostasis and rebleeding prevention.


Conflict of interest statement

Competing interests: The authors declare no competing interests.

Figures

Fig. 1
Fig. 1. Design and mechanism of the coagulation-independent blood-imbibing and -crosslinking microparticles (BICMs) for rapid hemostasis and prevention of rebleeding.
a Schematic working principle of BICMs at the bleeding site to form a fortified clot with enhanced mechanical strength and tissue adhesion. b The structure of a crosslinked hyaluronic acid microparticle modified with o-phthalaldehyde (OPA) groups (oHA). c Rapid blood imbibition by oHA microparticles via capillary suction and water absorption. d The OPA groups on the microparticle surface covalently crosslink with amines present on proteins in imbibed blood and on the tissue matrix. e Visualization of the imbibition behavior and reaction between Rhodamine-labeled bovine serum albumin (Rho-BSA, 50 mg mL−1, PBS, pH = 7.4) and oHA microparticles. The schematic illustration (top) and microscopy images (bottom) depict the procedure and results, respectively. f, g Effects of (f) pre-crosslinking density and (g) microparticle size on the imbibition rate (within 10 seconds) and imbibition ratio (after saturation) of oHA microparticles. Data are presented as means ± s.d. (n = 3 independent samples for f and g). All statistical analyses were performed using an unpaired two-tailed Student t-test. * p < 0.05, ** p < 0.01, *** p < 0.001, **** p < 0.0001 (for comparison of imbibition rate); # p < 0.05, ## p < 0.01, ### p < 0.001, #### p < 0.0001 (for comparison of imbibition ratio). Comparison was performed between pre-crosslinking densities of 0, 9.8%, or 16.5% versus 13.5%, as well as between particle size of 180–325 μm, 120–180 μm, or 38–75 μm versus 75–120 μm. Source data are provided as a Source Data file.
Fig. 2
Fig. 2. Grafting OPA groups onto microparticles accelerates clot formation and strengthens clots through covalent crosslinking.
ac Rheological analysis of blood clots with or without microparticles. Schematic illustration (a) and representative time sweeps (b) of the storage modulus (G’) and loss modulus (G”) for whole blood (200 μL), and whole blood (200 μL) with xHA (without OPA groups) or oHA (with OPA groups) microparticles (15 mg). The gelation time was defined as the time point at which G’ surpass G”. c Gelation time and G’ (measured via rheological tests) for blood clots with or without microparticles (n = 3 independent samples). The G’ was recorded at 300 s. d Digital photographs showing an oHA@Blood clot withstanding a weight of 250 g. The composite (oHA@Blood clot) was fabricated by adding 30 mg of oHA microparticles to 400 μL of whole blood within a mold (1.5 mm-diameter) and incubating at 37 °C for 300 s. eg Identification of the oHA-clot interface. e Representative confocal laser scanning microscope (CLSM) images of a natural plasma clot, an xHA@Plasma clot, and an oHA@Plasma clot. Purple fluorescence corresponds to the rhodamine-labeled plasma proteins. f Average fluorescence intensity of regions of interest (ROI, R1, and R2) in (e, n = 5 independent samples). g Average Young’s modulus of three characteristic regions in an oHA@Plasma clot, assessed by AFM tapping mode (n = 5 independent samples). h Time-dependent plots for G’ and G” versus strain rate for a natural blood clot, an xHA@Blood clot, and an oHA@Blood clot. i Fibrinolysis and anti-fibrinolysis behaviors of natural blood clots, xHA@Plasma clots, and oHA@Plasma clots, quantified by measuring the absorbance of supernatant at 405 nm (n = 5 independent samples). j Schematic illustration and dynamic clotting tests of blood with or without xHA microparticles, oHA microparticles, or commercially available hemostats (n = 3 independent samples). Data are presented as means ± s.d., and all statistical analyses were performed using an unpaired two-tailed Student t test. * p < 0.05, ** p < 0.01, *** p < 0.001, **** p < 0.0001. Source data are provided as a Source Data file.
Fig. 3
Fig. 3. Tissue adhesion of oHA@Blood clots.
a Schematic illustration and 3D CLSM images showing the adhesion behavior of oHA microparticles onto a gelatin matrix covered with a Rho-BSA solution (50 mg mL−1 in PBS, pH = 7.4). bd Quantification of the tissue adhesion. Lap shear tests (b), burst pressure tests (c), and tolerant hydraulic pressure tests (d) of natural blood clots, as well as blood clots formed using xHA, EtoHA, and oHA microparticles, and commercially available hemostats. Tests were performed after incubating the clots on fresh porcine skin for 5 minutes (n = 4 independent samples in bd). e Adhesion of an oHA@Blood clot on a fresh, punched porcine aorta, demonstrating its ability to withstood continuous fluid flow. f In vivo imaging system (IVIS) fluorescence analysis of the same rats examined on days 0, 3, 6, and 14 after applying oHA or xHA microparticles to a liver wound. The rat on the left serves as a negative control (i.e., no wound induction). Data are presented as means ± s.d., and all statistical analyses were performed using an unpaired two-tailed Student t test. * p < 0.05, ** p < 0.01, *** p < 0.001, **** p < 0.0001. The comparison was performed between each of the other hemostats versus oHA microparticles. Source data are provided as a Source Data file.
Fig. 4
Fig. 4. In vitro and in vivo biocompatibility of oHA microparticles.
a In vitro cell viability of mouse fibroblast (L929) cells assessed using a LIVE/DEAD assay after 24 h of co-incubation with or without 20 mg of xHA or oHA microparticles (n = 5 independent samples). b Hemolysis rates of xHA and oHA microparticles, along with representative digital images (n = 5 independent samples). c Timeline of the subcutaneous implantation experiment for evaluating in vivo biocompatibility and biodegradation. Created in BioRender. Chen, T. (2025) https://BioRender.com/x73e121. d Representative histology images with H&E staining on days 1 and 7 post-subcutaneous implantation. Black arrows indicate the infiltration of inflammatory cells. e Representative digital photographs and histology images with H&E staining of the subcutaneous tissue from the oHA and xHA microparticles-implanted groups at 1 day, 1 week, 1 month, and 3 months post-implantation. Black triangles indicate residual microparticles. Data are presented as means ± s.d. Source data are provided as a Source Data file.
Fig. 5
Fig. 5. In vivo hemostasis of hemorrhaging liver injury in rats and hemodilution-induced coagulopathic pigs.
a Schematic illustration of hemostasis using oHA microparticles in a rat liver injury model. Created in BioRender. Chen, T. (2025) https://BioRender.com/s64m575. bd Hemostatic performance of gauze, Arista, Surgicel, Quikclot, Gelfoam + T, and BICMs. Representative photographs (b), time to hemostasis (c), and blood loss (d) during liver bleeding or hemostasis. e Representative histological images with H&E staining of injured livers, and the thickness of the fibrotic capsule 1 week post-injury. Dashed lines indicate the boundaries between the liver tissue (L), the fibrotic capsule (F), and the injury site (I). f Schematic illustration of the hemorrhaging liver injury model in hemodilution-induced coagulopathic pigs. Created in BioRender. Chen, T. (2025) https://BioRender.com/w64h091. g, h Time to hemostasis (g) and blood loss (h) during hemostasis in the BICMs and Surgicel groups (12 injuries in three pigs, n = 8 for BICMs and n = 4 for Surgicel). Blood loss was determined as the weight gain of gauze covering the hemostats. i Representative photographs during liver bleeding or hemostasis. j Representative histology images with H&E staining of injured livers 1-day post-injury. Data are presented as means ± s.d., and all statistical analyses were performed using an unpaired two-tailed Student t test. * p < 0.05, ** p < 0.01, *** p < 0.001, **** p < 0.0001. Source data are provided as a Source Data file.
Fig. 6
Fig. 6. In vivo hemostasis in a rabbit model of femoral artery injury and fluid resuscitation.
a, b Schematic illustration (a) and workflow diagram (b) for the model of femoral artery injury and fluid resuscitation. The illustration was created in BioRender. Chen, T. (2025) https://BioRender.com/y12r125. c Incidence of rebleeding during fluid resuscitation (n = 5 independent samples). d Total blood loss during initial hemostasis and fluid resuscitation (n = 5 independent samples). e Survival curves for rabbits during initial hemostasis and fluid resuscitation (n = 5 independent samples). f, g Representative photographs (f) and histological images with H&E staining (g) of a blood vessel after hemostasis using BICMs. Data are presented as means ± s.d. Statistical analyses were performed using an unpaired two-tailed Student t test in (c) and (d) and a log-rank Mantel-Cox test in (e). * p < 0.05, ** p < 0.01, *** p < 0.001, **** p < 0.0001. Source data are provided as a Source Data file.

Similar articles

References

    1. World Health, O. World health statistics 2023: monitoring health for the SDGs, sustainable development goals. (World Health Organization, 2023).
    1. Broos, K., Feys, H. B., De Meyer, S. F., Vanhoorelbeke, K. & Deckmyn, H. Platelets at work in primary hemostasis. Blood Rev.25, 155–167 (2011). - PubMed
    1. Bailey, K., Bettelheim, F. R., Lorand, L. & Middlebrook, W. R. Action of thrombin in the clotting of fibrinogen. Nature167, 233–234 (1951). - PubMed
    1. Weisel, J. W. & Litvinov, R. I. Mechanisms of fibrin polymerization and clinical implications. Blood121, 1712–1719 (2013). - PMC - PubMed
    1. Muszbek, L., Bereczky, Z., Bagoly, Z., Komáromi, I. & Katona, É. Factor XIII: A coagulation factor with multiple plasmatic and cellular functions. Physiol. Rev.91, 931–972 (2011). - PubMed

LinkOut - more resources