Five years of high-frequency data of phytoplankton zooplankton and limnology from a temperate eutrophic lake
- PMID: 40251194
- PMCID: PMC12008225
- DOI: 10.1038/s41597-025-04988-9
Five years of high-frequency data of phytoplankton zooplankton and limnology from a temperate eutrophic lake
Abstract
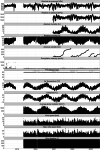
This study presents a comprehensive dataset from Lake Greifen, Switzerland, collected between April 2018 and June 2023, using high-frequency automated monitoring systems. The dataset integrates meteorological data, nutrient chemistry, water column profiles for water physics, and plankton underwater imaging, offering insights into the lake's physical and biological processes. A dual-magnification dark field underwater microscope captured hourly plankton dynamics at 3 m depth, providing size, shape, and taxonomic information. A profiler with a multiparametric probe monitored water temperature, oxygen, and other key parameters from 1 to 17 m depth, while weekly nutrient sampling complemented the measurements. Data processing involved rigorous cleaning protocols to remove technical artefacts, ensuring data quality. Our dataset showcases the utility of integrating different approaches for high-frequency monitoring to detect lake temporal processes, from phytoplankton blooms to zooplankton vertical migration and seasonal shifts in water column stability. This dataset provides a unique resource for studying limnology and plankton community ecology. All data and related processing codes are publicly available for further research, supporting interdisciplinary studies.
© 2025. The Author(s).
Conflict of interest statement
Competing interests: The authors declare no competing interests.
Figures


Similar articles
-
Underwater dual-magnification imaging for automated lake plankton monitoring.Water Res. 2021 Sep 15;203:117524. doi: 10.1016/j.watres.2021.117524. Epub 2021 Aug 6. Water Res. 2021. PMID: 34418642
-
Factors affecting annual occurrence, bioaccumulation, and biomagnification of polycyclic aromatic hydrocarbons in plankton food webs of subtropical eutrophic lakes.Water Res. 2018 Apr 1;132:1-11. doi: 10.1016/j.watres.2017.12.053. Epub 2017 Dec 26. Water Res. 2018. PMID: 29304443
-
Precipitation and temperature drive seasonal variation in bioaccumulation of polycyclic aromatic hydrocarbons in the planktonic food webs of a subtropical shallow eutrophic lake in China.Sci Total Environ. 2017 Apr 1;583:447-457. doi: 10.1016/j.scitotenv.2017.01.100. Epub 2017 Jan 19. Sci Total Environ. 2017. PMID: 28110880
-
Influence of cyanobacterial blooms and environmental variation on zooplankton and eukaryotic phytoplankton in a large, shallow, eutrophic lake in China.Sci Total Environ. 2021 Jun 15;773:145421. doi: 10.1016/j.scitotenv.2021.145421. Epub 2021 Jan 26. Sci Total Environ. 2021. PMID: 33582356
-
Ecology under lake ice.Ecol Lett. 2017 Jan;20(1):98-111. doi: 10.1111/ele.12699. Epub 2016 Nov 27. Ecol Lett. 2017. PMID: 27889953 Review.
References
-
- Williamson, C. E., Saros, J. E. & Schindler, D. W. Climate change. Sentinels of change. Science323, 887–888, 10.1126/science.1169443 (2009). - PubMed
-
- Carrer, M., Dibona, R., Prendin, A. L. & Brunetti, M. Recent waning snowpack in the Alps is unprecedented in the last six centuries. Nat. Clim. Chang. 10.1038/s41558-022-01575-3 (2023).
-
- Xu, F.-L., Tao, S., Dawson, R. W., Li, P.-G. & Cao, J. Lake ecosystem health assessment: Indicators and methods. Water Res.35, 3157–3167, 10.1016/s0043-1354(01)00040-9 (2001). - PubMed
-
- Kallis, G. The EU water framework directive: measures and implications. Water Policy3, 125–142, 10.1016/s1366-7017(01)00007-1 (2001).
Publication types
MeSH terms
Grants and funding
- 202290 & 182124/Schweizerischer Nationalfonds zur Förderung der Wissenschaftlichen Forschung (Swiss National Science Foundation)
- 182124/Schweizerischer Nationalfonds zur Förderung der Wissenschaftlichen Forschung (Swiss National Science Foundation)
- 202290/WT_/Wellcome Trust/United Kingdom
- 202290 & 182124/Schweizerischer Nationalfonds zur Förderung der Wissenschaftlichen Forschung (Swiss National Science Foundation)
- 202290 & 182124/Schweizerischer Nationalfonds zur Förderung der Wissenschaftlichen Forschung (Swiss National Science Foundation)
- 202290 & 182124/Schweizerischer Nationalfonds zur Förderung der Wissenschaftlichen Forschung (Swiss National Science Foundation)
- 412375259/Deutsche Forschungsgemeinschaft (German Research Foundation)
- 412375259/Deutsche Forschungsgemeinschaft (German Research Foundation)
- 412375259/Deutsche Forschungsgemeinschaft (German Research Foundation)
- 412375259/Deutsche Forschungsgemeinschaft (German Research Foundation)
- 412375259/Deutsche Forschungsgemeinschaft (German Research Foundation)
- 412375259/Deutsche Forschungsgemeinschaft (German Research Foundation)
- 412375259/Deutsche Forschungsgemeinschaft (German Research Foundation)
- 412375259/Deutsche Forschungsgemeinschaft (German Research Foundation)
LinkOut - more resources
Full Text Sources
Miscellaneous

