

Multiple stressors affect function rather than taxonomic structure of freshwater microbial communities
- PMID: 40251215
- PMCID: PMC12008304
- DOI: 10.1038/s41522-025-00700-2
Multiple stressors affect function rather than taxonomic structure of freshwater microbial communities
Abstract
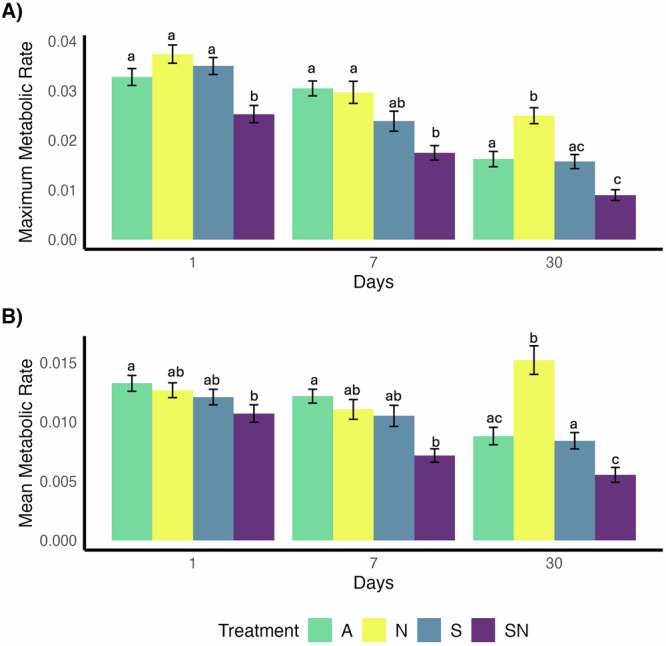
Microbial community responses to environmental stressors are often characterised by assessing changes in taxonomic structure, but such changes, or lack thereof, may not reflect functional changes that are critical to ecosystem processes. We investigated the individual and combined effects of nutrient enrichment ( + 10 mg/L N, + 1 mg/L P) and salinisation ( + 15 g/L NaCl)-key stressors in freshwater systems-on the taxonomic structure and metabolic function of benthic microbial communities using 1000 L open freshwater ponds established >10 years ago in the field. Combined stressors drove strong decreases in maximum and mean total carbon metabolic rates and shifted carbon metabolic profiles compared to either stressor individually and compared to ambient conditions. These metabolic functional changes did not recover through time and occurred without significant alterations in bacterial community taxonomic structure. These results imply that critical functions, including organic carbon release, are likely to be impaired under multiple stressors, even when taxonomic structure remains stable.
© 2025. The Author(s).
Conflict of interest statement
Competing interests: The authors declare no competing interests.
Figures


Similar articles
-
Bacterial community structure and function in soils from tidal freshwater wetlands in a Chinese delta: Potential impacts of salinity and nutrient.Sci Total Environ. 2019 Dec 15;696:134029. doi: 10.1016/j.scitotenv.2019.134029. Epub 2019 Aug 21. Sci Total Environ. 2019. PMID: 31470319
-
Estuarine Sediment Microbiomes from a Chronosequence of Restored Urban Salt Marshes.Microb Ecol. 2023 Apr;85(3):916-930. doi: 10.1007/s00248-023-02193-y. Epub 2023 Feb 24. Microb Ecol. 2023. PMID: 36826588
-
Interplay between resistance and resilience governs the stability of a freshwater microbial food web under multiple stressors.Sci Total Environ. 2019 Nov 15;691:908-918. doi: 10.1016/j.scitotenv.2019.07.173. Epub 2019 Jul 12. Sci Total Environ. 2019. PMID: 31326814
-
Iron Flocs and the Three Domains: Microbial Interactions in Freshwater Iron Mats.mBio. 2020 Dec 15;11(6):e02720-20. doi: 10.1128/mBio.02720-20. mBio. 2020. PMID: 33323508 Free PMC article. Review.
-
Temperature structuring of microbial communities on a global scale.Curr Opin Microbiol. 2024 Dec;82:102558. doi: 10.1016/j.mib.2024.102558. Epub 2024 Oct 17. Curr Opin Microbiol. 2024. PMID: 39423562 Review.
References
-
- Folke, C. et al. Regime shifts, resilience, and biodiversity in ecosystem management. Annu. Rev. Ecol. Evol. Syst.35, 557–581 (2004).
-
- Hector, A. & Bagchi, R. Biodiversity and ecosystem multifunctionality. Nature448, 188–190 (2007). - PubMed
-
- Tilman, D. & Downing, J. A. Biodiversity and stability in grasslands. Nature367, 363–365 (1994).
-
- Falkowski, P. G., Fenchel, T. & Delong, E. F. The microbial engines that drive earth’s biogeochemical cycles. Science320, 1034–1039 (2008). - PubMed
MeSH terms
Substances
Grants and funding
LinkOut - more resources
Full Text Sources
