

Characterization of mechanical damage and viscoelasticity on aortas from guinea pigs subjected to hypoxia
- PMID: 40251229
- PMCID: PMC12008416
- DOI: 10.1038/s41598-025-96086-4
Characterization of mechanical damage and viscoelasticity on aortas from guinea pigs subjected to hypoxia
Abstract
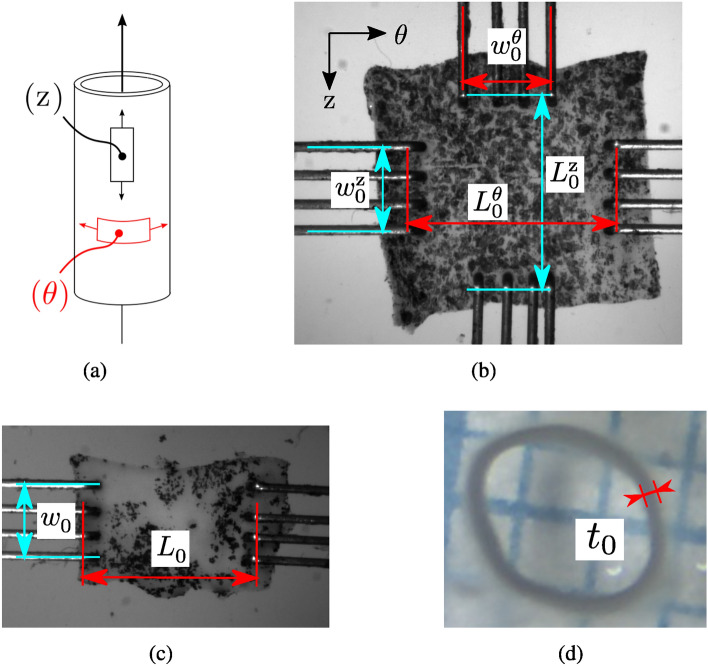
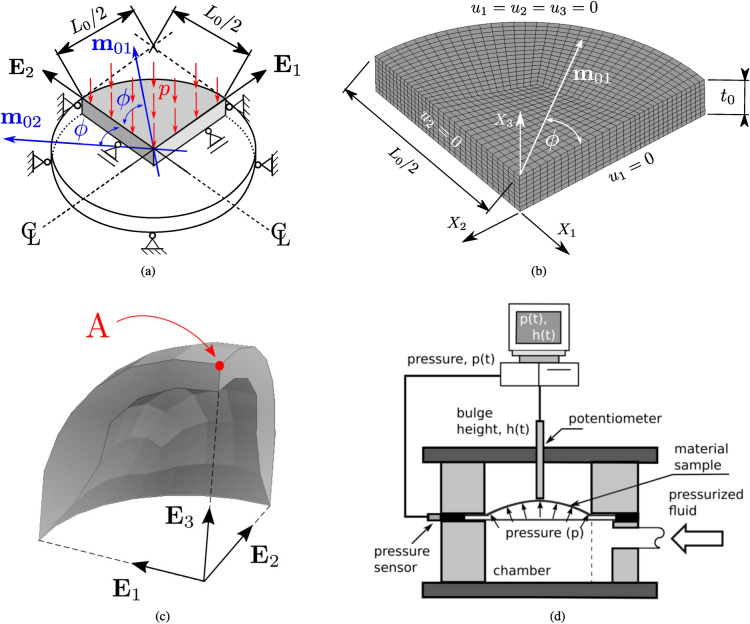
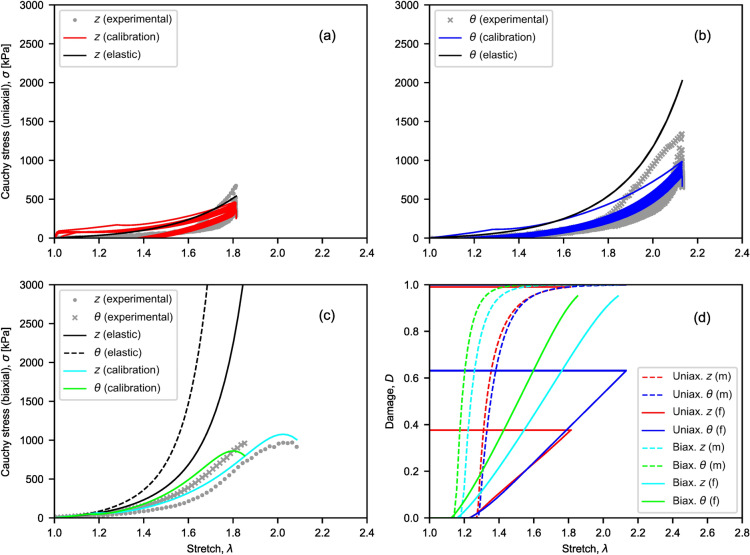
To reliably assess the rupture risk of the aorta, along with the hazardousness of cardiovascular diseases and other extreme conditions or the effect of possible treatments, it is necessary to understand the influence of damage mechanisms along with the frequency and rate of mechanical loads. In particular, hypobaric hypoxia, an oxygen deficiency in the organism due to its low atmospheric partial pressure, is reported to alter the mechanical properties of blood vessels. In this work, we characterized the passive mechanical response of the aorta, seeking to capture the influence of hypoxia on their elastic, damage, and viscoelastic properties under ex-vivo conditions. The mechanical behavior of the aortic wall is described using an anisotropic hyperelastic model including two fiber families with asymmetric dispersion, along with an anisotropic damage model and an orthotropic viscoelastic model based on a reverse multiplicative decomposition of the deformation gradient. The constitutive model was experimentally calibrated from uniaxial-relaxation and biaxial-tensile test results, previously performed on thoracic aorta samples of guinea pigs. A group of guinea pigs subjected to hypoxia was contrasted with a normoxic (control) group. Cyclic-load stages of uniaxial tests were used to assess dissipation. Once the constitutive model was implemented and calibrated, its performance was evaluated via the numerical simulation of a bulge pressurization test to estimate energy dissipation and pressure associated with the onset of damage. Results indicated that hypoxia does not alter the visco-hyperelastic or damage behavior of the aorta. Besides, the pressure delivered by bulge-test simulations at the onset of damage on collagen fibers was representative of an arterial hypertensive condition.
Keywords: Anisotropic hyperelasticity; Anisotropic mechanical damage; Aortic wall; Non-linear orthotropic viscoelasticity.
© 2025. The Author(s).
Conflict of interest statement
Declarations. Competing interests: The authors declare no competing interests.
Figures


Similar articles
-
Assessment of the passive viscoelastic response of aortic tissue from guinea pigs subjected to hypobaric hypoxia.Comput Biol Med. 2025 Aug;194:110399. doi: 10.1016/j.compbiomed.2025.110399. Epub 2025 Jun 5. Comput Biol Med. 2025. PMID: 40479792
-
Viscoelastic characterization of human descending thoracic aortas under cyclic load.Acta Biomater. 2021 Aug;130:291-307. doi: 10.1016/j.actbio.2021.05.025. Epub 2021 May 31. Acta Biomater. 2021. PMID: 34082105
-
Layer-specific hyperelastic and viscoelastic characterization of human descending thoracic aortas.J Mech Behav Biomed Mater. 2019 Nov;99:27-46. doi: 10.1016/j.jmbbm.2019.07.008. Epub 2019 Jul 15. J Mech Behav Biomed Mater. 2019. PMID: 31330442
-
Microstructural and mechanical characterization of the layers of human descending thoracic aortas.Acta Biomater. 2021 Oct 15;134:401-421. doi: 10.1016/j.actbio.2021.07.036. Epub 2021 Jul 23. Acta Biomater. 2021. PMID: 34303867
-
Biomechanical characterization of the passive response of the thoracic aorta in chronic hypoxic newborn lambs using an evolutionary strategy.Sci Rep. 2021 Jul 6;11(1):13875. doi: 10.1038/s41598-021-93267-9. Sci Rep. 2021. PMID: 34230509 Free PMC article.
References
-
- Humphrey, J. Cardiovascular Solid Mechanics: Cells, Tissues and Organs (Springer-Verlag, New York, 2002).
-
- Holzapfel, G. Nonlinear solid mechanics (John Wiley & Sons Ltd., Chichester, 2000).
-
- Tricerri, P., Dedè, L., Gambaruto, A., Quarteroni, A. & Sequeira, A. A numerical study of isotropic and anisotropic constitutive models with relevance to healthy and unhealthy cerebral arterial tissues. Int J Eng Sci. 101, 126–55. 10.1016/j.ijengsci.2016.01.002 (2016).
MeSH terms
Grants and funding
- 022416GH_Ayudante/Departamento de Investigaciones Científicas y Tecnológicas, Universidad de Santiago de Chile
- 022416GH_Ayudante/Departamento de Investigaciones Científicas y Tecnológicas, Universidad de Santiago de Chile
- 1201283/Fondo Nacional de Desarrollo Científico y Tecnológico
- 1220956/Fondo Nacional de Desarrollo Científico y Tecnológico
LinkOut - more resources
Full Text Sources
