. 2025 Sep;9(9):1403-1417.
doi: 10.1038/s41551-025-01378-9. Epub 2025 Apr 18.

High-resolution prosthetic hearing with a soft auditory brainstem implant in macaques

Affiliations

High-resolution prosthetic hearing with a soft auditory brainstem implant in macaques

Alix Trouillet et al. Nat Biomed Eng. 2025 Sep.

Abstract

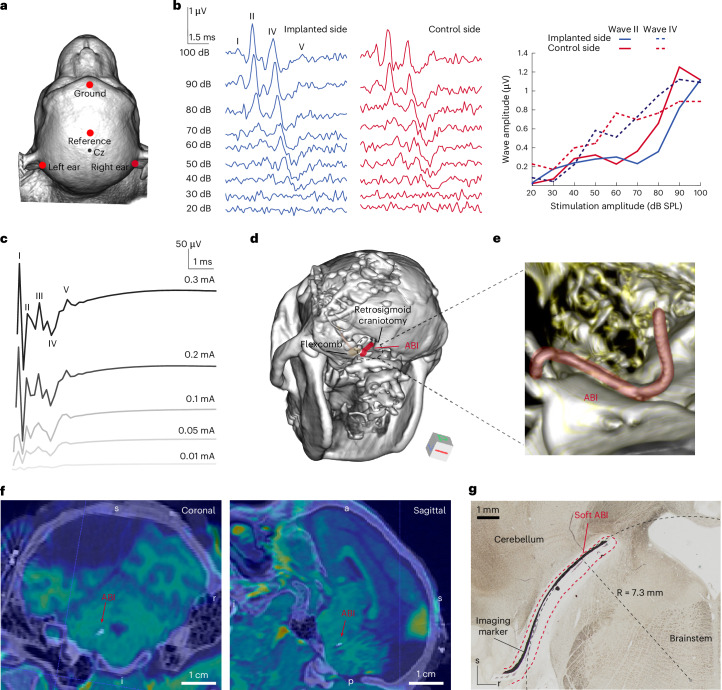
Individuals with compromised cochlear nerves are ineligible for cochlear implants and instead rely on auditory brainstem implants (ABIs). Most users of ABIs experience sound awareness, which aids in lip reading, yet not speech intelligibility. Here we engineered a dual-site (brainstem and cortex) implantable system, scaled to macaque anatomy, for the analysis of auditory perception evoked by electrical stimulation of the cochlear nucleus. A soft multichannel ABI, fabricated using thin-film processing, provided high-resolution auditory percepts, with spatially distinct stimulation sites eliciting cortical responses akin to frequency-specific tuning. Behavioural responses collected over several months were sufficiently precise to distinguish stimulations from adjacent channels. Soft multichannel ABIs may aid the rehabilitation of individuals with profound hearing loss who are ineligible for cochlear implants.


Conflict of interest statement

Competing interests: Two patents were filed related to this paper: PCT/EP2017/080876 (co-inventor: S.P.L.) and PCT/EP2019/152581 (co-inventor: S.P.L.). The other authors declare no competing interests.

Figures

Fig. 1
Fig. 1. Experimental design and devices.
a, Left: schematic of an NHP brain. The soft ABI is implanted on the cochlear nucleus; the soft ECoG records cortical responses from the auditory cortex. Right: NHP behavioural task in response to electrical or acoustic stimulation. Created with BioRender.com (https://BioRender.com/y29o453) and using a brain image from Adobe Stock. b, Photograph of the integrated soft ABI and its connectors: an Omnetics connector is embedded in a PEEK pedestal and connected to the soft ABI. An imaging marker and resorbable insertion spine are also visible. c, Integrated soft ECoG device: 29 electrodes (300-µm diameter) that record cortical signals. d, Close-up of the soft ABI: 11 electrodes (100-µm diameter). Right inset: FlexComb connector. e,f, In vitro characterization of the soft ABI (e) and EcoG (f). Left: EIS measurement, where data points represent the average and bars represent standard errors for all electrodes. Right: VT in response to a 100-µA biphasic current pulse. The thick blue line represents the average and light lines represent individual electrodes. g, Scanning electron microscopy (SEM) images of micropatterned ABI electrodes and interconnects. Top left: image of one ABI electrode and associated interconnect. Red frame, close-up of an interconnect; green frame, close-up of the electrode. Bottom right: colourized SEM of the electrode and encapsulation of the platinum layer within the polyimide dielectric layers. Source data
Fig. 2
Fig. 2. Soft ABI placement and validation both intra- and post-operatively.
a, Recording setup for ABRs and eABRs, showing the position of ground and reference electrodes. b, Post-surgery ABRs for both implanted (left) and control (right) sides. Traces show responses from 20 to 100 dB SPL. Graph displays wave II and IV amplitude depending on stimulation amplitude. c, Intra-operative eABR responses to ABI monopolar stimulation (elec1) at increasing stimulation amplitude. Waves I, II, III, IV and V are labelled. The first 1 ms of the trace was removed because of contamination with the stimulus artefact. d, 3D reconstruction based on CT images of NHP cranium. The FlexComb connector is visible on CT and highlighted in light brown. The ABI imaging marker is highlighted in red as it enters the posterior fossa craniotomy. Orientation is indicated. e, Magnified view of CT 3D reconstruction focusing on the electrode array (in red). The reconstruction shows the flexibility of the soft array. f, Co-registered CT and MRI images taken post surgery, showing the ABI artefact from the imaging marker. The bone is shown in purple colour and soft tissue of the brainstem is shown in green colour in two different imaging planes (sagittal, coronal; a, anterior; p, posterior; l, left; r, right; s, superior; i, inferior). g, Histological brainstem coronal cross-section showing the electrode array in place after 17 months of implantation. The black line is the imaging marker, and the full pad is delimited by the dashed red line. This image reveals the in situ conformability of the soft ABI at the surface of the brainstem. The radius curvature of the tip of the soft ABI in this image was measured as 7.3 mm. Source data
Fig. 3
Fig. 3. Characterization of cortical responses to soft ABI stimulation.
a, Experimental design schematic. ECoG dimension: 300-µm-diameter electrodes, 1.43 mm x-direction pitch, 1.33 mm y-direction pitch. b, eAEP recorded by the ECoG (recording channel 1) when ABI electrode e1 is stimulated (current: 0.1–1.1 mA; pulse width: 300 µs). c, Recruitment curves for each ABI electrode as a function of stimulation level (recording channel 1). In this experiment, e7 to e11 were unresponsive in the stimulated range. d, Electrical stimuli were presented to ABI electrode e1 with (STIM + WN, brown curve) and without (STIM ONLY, black curve) acoustic white noise (WN) in the background; example of response from 1 representative ECoG recording channel. e, Each dot represents a response from one ECoG channel (peak to peak amplitude, µV) generated by a given electrical stimulation current delivered by ABI e1 (same grey scale as b) with and without white noise in the background. The distribution of the responses with and without white noise does not follow the x = y line (red). f, Mean of all responses that is significantly different when white noise is applied in the background (one-tailed paired t-test, ***P < 0.001). g, Colourmaps representing the activity at the surface of the auditory cortex (eAEPs peak to peak amplitude, µV) depending on which electrode is stimulated (at a given stimulation amplitude, in this example, 0.9 mA). Each trace represents the average over 1 s. h, Linear correlation between electrodes e4 and e5, while electrodes e1 and e4 are not correlated. Each dot represents an electrode of the ECoG array at a given stimulation amplitude (single pulse ranging from 0.1 mA to 1.1 mA). Right: table showing the mean correlation coefficients from all ECoG recording channels for each ABI electrode pair. Panel a was created using brain reconstruction from refs. ,. Source data
Fig. 4
Fig. 4. Behavioural evaluation of the soft ABI.
a,b, Designs and lever release periods for the aTask (a), and the bTask (left) and eTask (right) (b). ce, Lever release distributions with 95% confidence interval (CI; shaded area) for the aUp and aNull trials (c); release times are statistically different (Mann–Whitney unpaired two-tailed t-test, ****P < 0.0001) (naUp = 747, naNull = 846); for the bUp trials (d); distribution is distinct from the aNull one (Mann–Whitney unpaired two-tailed t-test, P < 0.0001) and tends towards the aUp distribution (naNull = 726, naUp = 1102, nbUp = 879); and for the eTask with auditory trials for comparison (e) (neUp = 372, neNull = 447, naUp = 228, naNull = 226). f, Lever release median and 95% CI for different types of aUp trial (naUp_200Hz = 104, naUp_50Hz = 117, naUp_20Hz = 126, naUp_10Hz = 120, naUp_2Hz = 68). Release time for a difference of |2 Hz| is statistically different from that of aNull trials (Mann–Whitney unpaired two-tailed t-test, ****P < 0.0001), while bUp trials are not (Mann–Whitney unpaired two-tailed t-test, NS). g, bUp trials (above threshold stimulation) are statistically different from aNull trials (Mann–Whitney unpaired two-tailed t-test, ****P < 0.0001), while bUp trials (below threshold stimulation) are not (Mann–Whitney unpaired two-tailed t-test, NS) (nbUp_belowThreshold = 126). Median (centre line) and quartiles (dotted lines) are displayed. h, Lever release times are statistically different for eUp and eNull trials (Mann–Whitney unpaired two-tailed t-test, ****P < 0.0001), similarly to auditory trials. Median and quartiles are displayed. i, Performance from the electrical trials (middle panel) involving ABI pairs A/B (8-1/10-4) displays greater distribution differences than for ABI pairs A/C (8-1/9-4). The difference at the median (right panel, with 95% CI) between the respective eUp and eNull distribution is closer to 0 for pairs A/C (pair A/B neNull = 75, neUp = 46; pair A/C neNull = 40, neUp = 37). Source data

References

    1. Zeng, F.-G. Celebrating the one millionth cochlear implant. JASA Express Lett.2, 077201 (2022). - PubMed
    1. Lehmann, A., Limb, C. J. & Marozeau, J. Editorial: music and cochlear implants: recent developments and continued challenges. Front. Neurosci.15, 736772 (2021). - PMC - PubMed
    1. Naples, J. G. & Ruckenstein, M. J. Cochlear implant. Otolaryngol. Clin. North Am.53, 87–102 (2020). - PubMed
    1. Evans, D. G. NF2-related schwannomatosis. GeneReviewshttps://www.ncbi.nlm.nih.gov/sites/books/NBK1201/ (updated 20 April 2023).
    1. Deep, N., Choudhury, B. & Roland, J. Auditory brainstem implantation: an overview. J. Neurol. Surg. B80, 203–208 (2019). - PMC - PubMed

LinkOut - more resources