. 2025 Apr 18;15(1):13469.
doi: 10.1038/s41598-025-95905-y.

Transcriptomic profiling of severe and critical COVID-19 patients reveals alterations in expression, splicing and polyadenylation

Affiliations

Transcriptomic profiling of severe and critical COVID-19 patients reveals alterations in expression, splicing and polyadenylation

Marjorie Labrecque et al. Sci Rep. .

Abstract

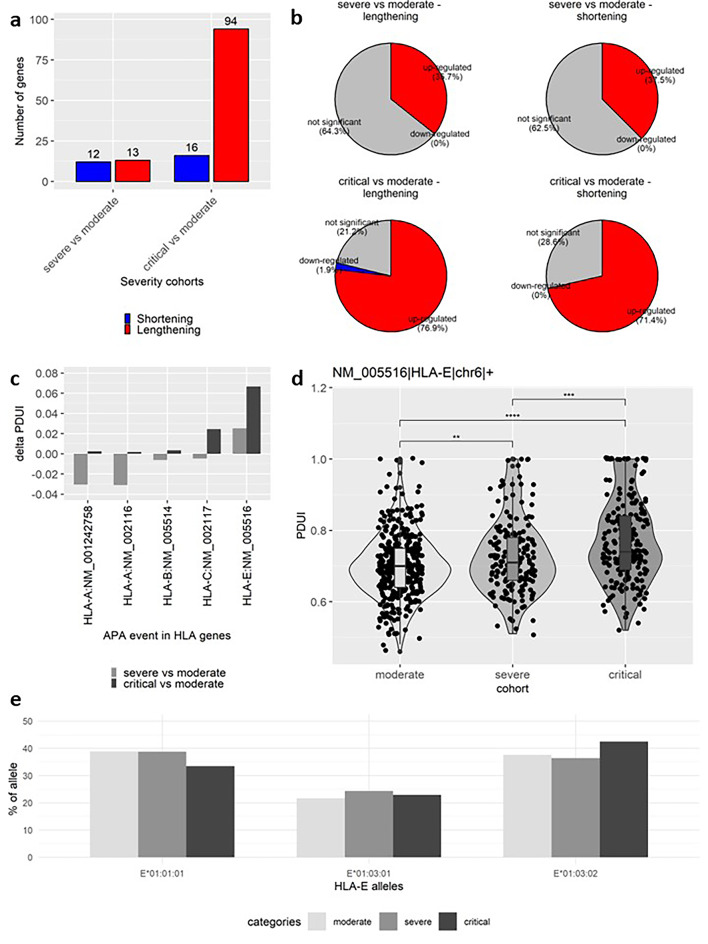
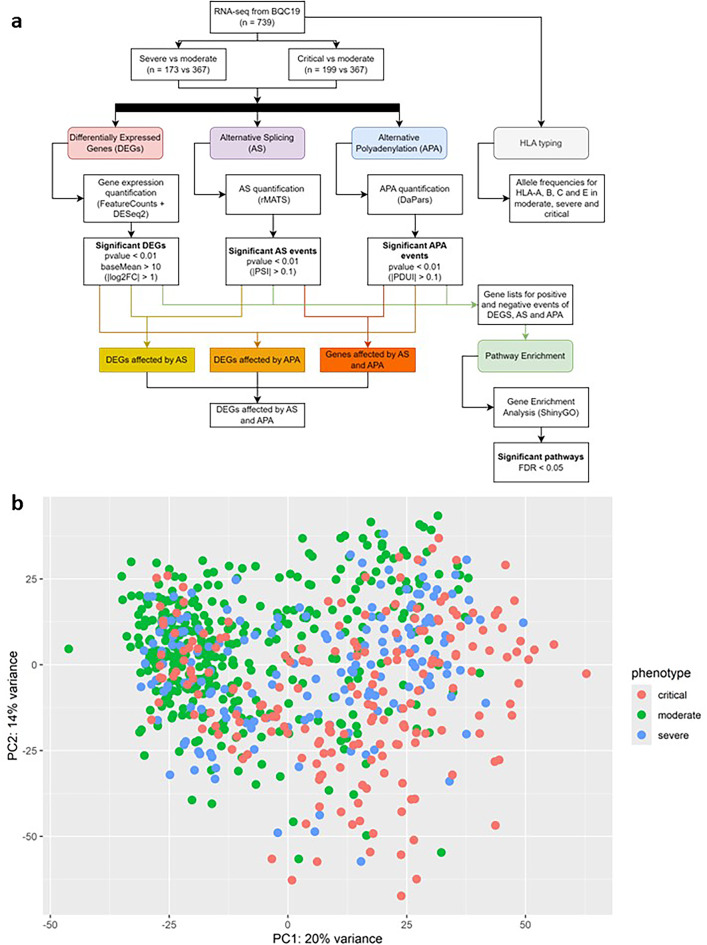
Coronavirus disease 2019 (COVID-19) is a multi-systemic illness that became a pandemic in March 2020. Although environmental factors and comorbidities can influence disease progression, there is a lack of prognostic markers to predict the severity of COVID-19 illness. Identifying these markers is crucial for improving patient outcomes and appropriately allocating scarce resources. Here, an RNA-sequencing study was conducted on blood samples from unvaccinated, hospitalized patients divided by disease severity; 367 moderate, 173 severe, and 199 critical. Using a bioinformatics approach, we identified differentially expressed genes (DEGs), alternative splicing (AS) and alternative polyadenylation (APA) events that were severity-dependent. In the severe group, we observed a higher expression of kappa immunoglobulins compared to the moderate group. In the critical cohort, a majority of AS events were mutually exclusive exons and APA genes mostly had longer 3'UTRs. Interestingly, multiple genes associated with cytoskeleton, TUBA4A, NRGN, BSG, and CD300A, were differentially expressed, alternatively spliced and polyadenylated in the critical group. Furthermore, several inflammation-related pathways were observed predominantly in critical vs. moderate. We demonstrate that integrating multiple downstream analyses of transcriptomics, from moderate, severe, and critical patients confers a significant advantage in identifying relevant dysregulated genes and pathways.

Keywords: Alternative polyadenylation; Alternative splicing; COVID-19; Differentially expressed genes; Pathway enrichment; Transcriptomics.


Conflict of interest statement

Declarations. Competing interests: The authors declare no competing interests.

Figures

Fig. 1
Fig. 1
Higher number of DEGs between critical vs. moderate when compared to severe vs. moderate. (a) Volcano plot for severe vs. moderate. All the genes shown have a baseMean > 10. The red dots are up-regulated genes with p-value < 0.01 and log2FoldChange > 1. The blue dots are down-regulated genes with p-value < 0.01 and log2FoldChange < -1. The top 10 genes are shown for up-regulated genes and the top6 genes are shown for down-regulated genes. (b) Normalized gene count for a subset of genes in the top10 of DEGs in severe vs. moderate. The expression is shown for the moderate, severe, and critical groups. (c) Volcano plot for critical vs. moderate. All the genes shown have a baseMean > 10. The red dots are up-regulated genes with p-value < 0.01 and log2FoldChange > 1. The blue dots are down-regulated genes with p-value < 0.01 and log2FoldChange < -1. The top 10 genes are shown for up- and down-regulated genes. (d) Normalized gene count for a subset of genes in the top10 of DEGs in critical vs. moderate. The expression is shown for the moderate, severe, and critical groups. (e) Upset plot (UpSetR v1.4.0 in R v4.2.1) for genes in common in the critical vs. moderate (critical) and in the severe vs. moderate (severe) comparisons. The genes are separated in three categories for each comparison, up-regulated (up; pvalue < = 0.01, log2FC > 0 and baseMean > = 10), down-regulated (down; pvalue < = 0.01, log2FC < 0 and baseMean > = 10) and not differentially expressed (nonDE; pvalue > 0.01 or baseMean < 10). All figures were made with ggplot2 (v3.4.3) in R (v4.2.1). All panels were assembled with cowplot (1.1.1) in R (v4.2.1). Statistics are from a t-test. ns: padj > 0.05; *: padj < = 0.05; **: padj < = 0.01; ***: padj < = 0.001; ****: padj < = 0.0001.
Fig. 2
Fig. 2
The majority of AS are MXE events. Upset plot for AS events with p-value < 0.01 in (a) severe vs. moderate and (b) critical vs. moderate, showing the intersection of genes affected by one or multiple AS types. Made with the upset (UpSetR v1.4.0) package in R (v4.2.1). (c) Table for number of AS events with p-value < 0.01 for each AS type with positive PSI (PSI > 0) and negative PSI (PSI < 0) for severe vs. moderate and critical vs. moderate groups. Made with ggtexttable (ggpubr v0.6.0) in R (v4.2.1). (d) AS events in critical vs. moderate and severe vs. moderate for both positive and negative PSI, separately with a p-value < 0.01 separated by type (A3SS, A5SS, MXE, RI and SE) that are also found in the DEGs. The grey bar represents the events that were not significant (baseMean < 10 or p-value > 0.01), the blue bar are down-regulated events (baseMean > 10, p-value < 0.01 and log2FoldChange < 0) and the red bar are AS events that are up-regulated (baseMean > 10, p-value < 0.01 and log2FoldChange > 0). Made with ggplot2 (v3.4.3) in R (v4.2.1). All panels were assembled with cowplot (1.1.1) in R (v4.2.1).
Fig. 3
Fig. 3
Large proportion of genes have a lengthening of the 3’UTR in critical vs. moderate. (a) Number of unique genes with p-value < 0.01 affected by shortening (PDUI < 0; in blue) or lengthening (PDUI > 0; in red) of 3’UTR in severe vs. moderate and critical vs. moderate. (b) Pie chart for APA events with p-value < 0.01 also found in DEGs for severe vs. moderate and critical vs. moderate, in percentage. Red represents the APA events up-regulated in DEGs (baseMean > 10, p-value < 0.01 and log2FoldChange > 0), blue represents down-regulated DEGs (baseMean > 10, p-value < 0.01 and log2FoldChange < 0) and grey are not significant (baseMean < 10 or p-value > 0.01). Made with ggpie (ggpubr v0.6.0) in R (v4.2.1). (c) Bar chart of HLA genes with APA events in severe vs. moderate and critical vs. moderate. The deltaPDUI score in shown for each comparison in each HLA gene and transcript. (d) Violin plot showing the PDUI score of every sample in moderate, severe, and critical groups for HLA-E for transcript NM_005516. Statistics from t-test. a), c) and d) are made with ggplot2 (v3.4.3) in R (v4.2.1). All panels were assembled with cowplot (1.1.1) in R (v4.2.1).
Fig. 4
Fig. 4
Integrating different transcriptomic analyses demonstrates differences between COVID-19 severities. Venn diagram for genes identified as DEGs (p-value < 0.01 and baseMean > 10), AS (p-value < 0.01) and APA (p-value < 0.01) in (a) severe vs. moderate and (b) critical vs. moderate. The genes in common from all analysis (middle of Venn) are shown in a table next to the Venn diagram. Made with ggvenn (v0.1.10) and ggtexttable (ggpubr v0.6.0) in R (v4.2.1). Venn diagram of pathways affected by DEGs, AS genes and APA genes in (c) severe vs. moderate and (d) critical vs. moderate. Made with ggvenn (v0.1.10). (e) Pathways identified with DEGs, AS and APA in common in severe vs. moderate and critical vs. moderate. The dot represents the severe vs. moderate group, the triangle represents the critical vs. moderate group, the size represents the Fold Enrichment of the pathway, the color scale represents the -log10(FDR), with a higher value (lighter color) meaning a more significant pathway (lower FDR). The x axis represents the Gene ratio (number of genes dysregulated divided by total number of genes implicated in the pathway), and the y axis are the pathways. Made with ggplot2 (v3.4.3) in R (v4.2.1). All panels were assembled with cowplot (1.1.1) in R (v4.2.1).
Fig. 5
Fig. 5
Study flowchart. (a) Bioinformatic pipeline for downstream analysis of RNA-seq samples. From our 739 samples, we compared two sets of groups, severe vs. moderate and critical vs. moderate. For each group, we looked at DEGs, AS and APA events, using DESeq2, rMATS and DaPars, respectively. From the significant events, we looked at pathways affected by these events. Every event and pathway were compared between groups. In parallel, we compared HLA allele frequencies between moderate, severe, and critical patients. Made with draw.io from diagrams.net (v21.6.8). (b) Principal Component Analysis of expression in moderate, severe and critical. Made with ggplot2 (v3.4.3) in R (v4.2.1).

Similar articles

References

    1. Wu, F. et al. A new coronavirus associated with human respiratory disease in China. Nature579 (7798), 265–269 (2020). - PMC - PubMed
    1. Organization, W. H. Coronavirus disease (COVID-19) pandemic 2024.
    1. Papadopoulou, G. et al. Molecular and clinical prognostic biomarkers of COVID-19 severity and persistence. Pathogens11(3). (2022). - PMC - PubMed
    1. Lee, Y. et al. Variants affecting exon skipping contribute to complex traits. PLoS Genet.8 (10), e1002998 (2012). - PMC - PubMed
    1. Wang, Y. et al. Mechanism of alternative splicing and its regulation (Review). Biomed. Rep.3 (2), 152–158 (2015). - PMC - PubMed