

Identification of unique biomarkers for proliferative diabetic retinopathy with tractional retinal detachment by proteomics profiling of vitreous humor
- PMID: 40251337
- PMCID: PMC12008405
- DOI: 10.1038/s41598-025-98327-y
Identification of unique biomarkers for proliferative diabetic retinopathy with tractional retinal detachment by proteomics profiling of vitreous humor
Abstract
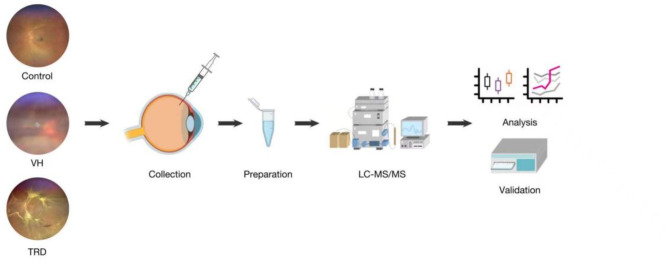
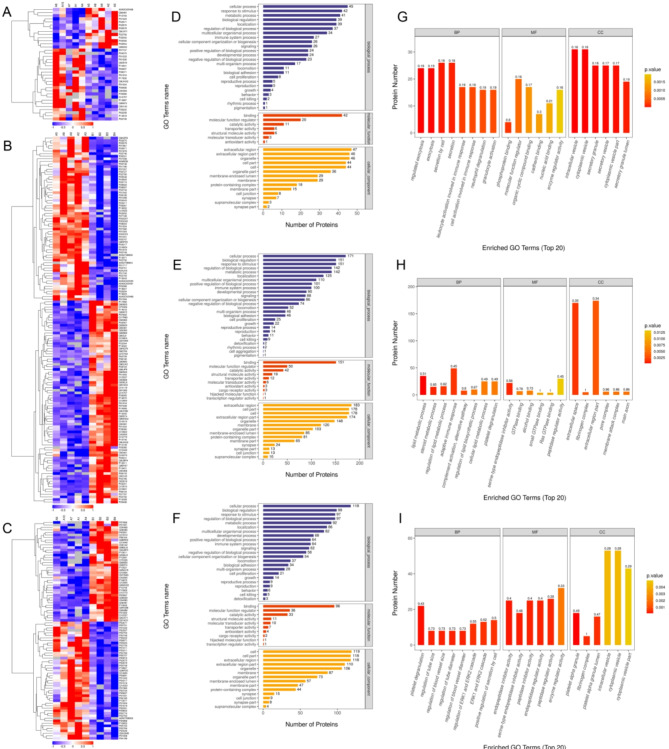
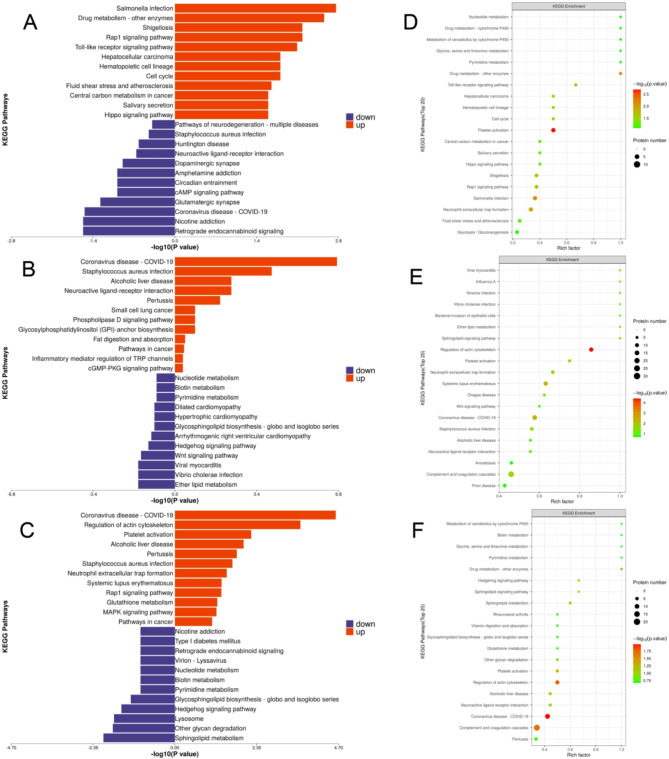
Diabetic retinopathy (DR) is one of the major complications of diabetes, resulting in severe vision loss. Traction retinal detachment (TRD) is the main factor affecting the effect of proliferative diabetic retinopathy (PDR) surgery. Liquid Chromatography with tandem mass spectrometry (LC-MS/MS) was adopted to analyze the proteomes of the vitreous in the TRD, vitreous hemorrhage (VH) and macular hole (MH) groups. By employing bioinformatics tools for GO and KEGG pathway annotation, as well as conducting protein-protein interaction(PPI) network analysis, we investigated the functional enrichment of proteins in the TRD vitreous and their associated pathways. Additionally, peptide center analysis was performed on the proteomic data to identify key differentially expressed proteins based on screening results. Bioinformatics analysis showed that DEPs is mainly enriched in the complement, the coagulation cascade systems and regulation of actin cytoskeleton. The protein interaction network analysis showed that the central proteins were mainly related to sphingolipid metabolism. APOA4, CHI3L1, LTBP2 were significantly up-regulated in TRD, which were related to the complement system, coagulation cascade and platelet activation, sphingolipid metabolism and other pathways. APOA4 and CHI3L1 protein in patients with TRD group raised significantly in the vitreous humor, shows the potential biomarkers for TRD.
Keywords: APOA4; CHI3L1; Diabetic retinopathy; Liquid chromatography with tandem mass spectrometry (LC-MS/MS); Sphingolipid metabolism; Traction retinal detachment.
© 2025. The Author(s).
Conflict of interest statement
Declarations. Competing interests: The authors declare no competing interests. Ethics statement: The study was conducted in accordance with the Declaration of Helsinki, and was approved by the Medical Ethics Committee of Tianjin Eye Hospital (Approval No.: TJYYLL-2018-01).
Figures


Similar articles
-
[New exploration of treatment target for proliferative diabetic retinopathy based on iTRAQ LC-MS/MS Proteomics].Zhonghua Yan Ke Za Zhi. 2019 Oct 11;55(10):769-776. doi: 10.3760/cma.j.issn.0412-4081.2019.10.008. Zhonghua Yan Ke Za Zhi. 2019. PMID: 31607066 Chinese.
-
Eicosanoid Profiles in the Vitreous Humor of Patients with Proliferative Diabetic Retinopathy.Int J Mol Sci. 2020 Oct 9;21(20):7451. doi: 10.3390/ijms21207451. Int J Mol Sci. 2020. PMID: 33050335 Free PMC article.
-
The Proteomic Landscape in the Vitreous of Patients With Age-Related and Diabetic Retinal Disease.Invest Ophthalmol Vis Sci. 2018 Mar 20;59(4):AMD31-AMD40. doi: 10.1167/iovs.18-24122. Invest Ophthalmol Vis Sci. 2018. PMID: 30025106
-
Surgical management of retinal diseases: proliferative diabetic retinopathy and traction retinal detachment.Dev Ophthalmol. 2014;54:196-203. doi: 10.1159/000360467. Epub 2014 Aug 26. Dev Ophthalmol. 2014. PMID: 25196770 Review.
-
Prognostic factors for the development and progression of proliferative diabetic retinopathy in people with diabetic retinopathy.Cochrane Database Syst Rev. 2023 Feb 22;2(2):CD013775. doi: 10.1002/14651858.CD013775.pub2. Cochrane Database Syst Rev. 2023. PMID: 36815723 Free PMC article. Review.
References
-
- Lechner, J., O’Leary, O. E. & Stitt, A. W. The pathology associated with diabetic retinopathy. Vis. Res.139, 7–14. 10.1016/j.visres.2017.04.003 (2017). - PubMed
-
- Fong, D. S., Ferris, F. L. 3, Davis, M. D., Chew, E. Y. & rd, & Causes of severe visual loss in the early treatment diabetic retinopathy study: ETDRS report 24. Early treatment diabetic retinopathy study research group. Am. J. Ophthalmol.127, 137–141. 10.1016/s0002-9394(98)00309-2 (1999). - PubMed
-
- Haines, N. R., Manoharan, N., Olson, J. L., D’Alessandro, A. & Reisz, J. A. Metabolomics analysis of human vitreous in diabetic retinopathy and rhegmatogenous retinal detachment. J. Proteome Res.17, 2421–2427. 10.1021/acs.jproteome.8b00169 (2018). - PubMed
-
- Barba, I. et al. Metabolic fingerprints of proliferative diabetic retinopathy: an 1H-NMR-based metabonomic approach using vitreous humor. Invest. Ophthalmol. Vis. Sci.51, 4416–4421. 10.1167/iovs.10-5348 (2010). - PubMed
MeSH terms
Substances
Grants and funding
- T J W J 2 0 2 4 M S 0 3 3/Tianjin Health Research Project
- TJYXZDXK-016A/Tianjin Key Medical Discipline (Specialty) Construction Project
- TJYXZDXK-016A/Tianjin Key Medical Discipline (Specialty) Construction Project
- TJYXZDXK-016A/Tianjin Key Medical Discipline (Specialty) Construction Project
- TJYXZDXK-016A/Tianjin Key Medical Discipline (Specialty) Construction Project
LinkOut - more resources
Full Text Sources
Medical
Miscellaneous
