

Australian birds track climate warming over decades via shifts in bill morphology
- PMID: 40251339
- PMCID: PMC12008274
- DOI: 10.1038/s42003-025-08042-7
Australian birds track climate warming over decades via shifts in bill morphology
Abstract
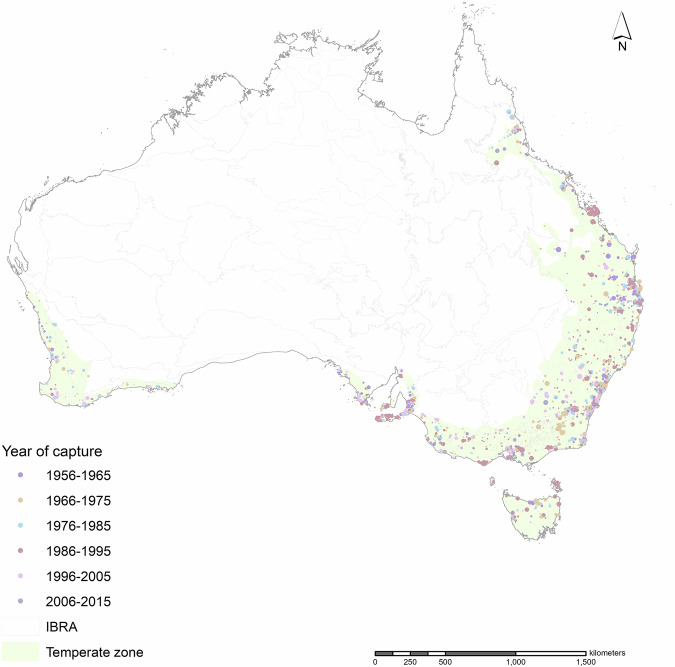
Global warming is widely predicted to drive adaptive responses in species' morphology, yet such responses have rarely been demonstrated to track changing climate through time. We investigated associations between avian bill size and changes in seasonal climate extremes using museum specimens of 57 Australian passerine species (Meliphagides). We employed location-specific climate data from the 4119 sites where specimens were collected to test whether change in the frequencies of summer (≥35 °C) and winter (<5°C) extremes over the preceding 20 years of each specimen's collection date was associated with bill size variation as predicted by thermoregulatory hypotheses. Rapid warming in summer and winter was associated with bill size variation in accordance with the bill's role in heat exchange. Our study provides critical evidence that bill size is tracking climate change through time in response to changing thermoregulatory demands. A critical future question is whether such changes facilitate species persistence.
© 2025. The Author(s).
Conflict of interest statement
Competing interests: The authors declare no competing interests.
Figures


Similar articles
-
Spatial variation in avian bill size is associated with temperature extremes in a major radiation of Australian passerines.Proc Biol Sci. 2024 Jan 31;291(2015):20232480. doi: 10.1098/rspb.2023.2480. Epub 2024 Jan 24. Proc Biol Sci. 2024. PMID: 38262606 Free PMC article.
-
Dynamic size responses to climate change: prevailing effects of rising temperature drive long-term body size increases in a semi-arid passerine.Glob Chang Biol. 2014 Jul;20(7):2062-75. doi: 10.1111/gcb.12507. Glob Chang Biol. 2014. PMID: 25602089
-
Australian songbird body size tracks climate variation: 82 species over 50 years.Proc Biol Sci. 2019 Dec 4;286(1916):20192258. doi: 10.1098/rspb.2019.2258. Epub 2019 Nov 27. Proc Biol Sci. 2019. PMID: 31771472 Free PMC article.
-
The evolution of the avian bill as a thermoregulatory organ.Biol Rev Camb Philos Soc. 2017 Aug;92(3):1630-1656. doi: 10.1111/brv.12299. Epub 2016 Oct 7. Biol Rev Camb Philos Soc. 2017. PMID: 27714923 Review.
-
Shape-shifting: changing animal morphologies as a response to climatic warming.Trends Ecol Evol. 2021 Nov;36(11):1036-1048. doi: 10.1016/j.tree.2021.07.006. Epub 2021 Sep 7. Trends Ecol Evol. 2021. PMID: 34507845 Review.
References
-
- Parmesan, C. Ecological and evolutionary responses to recent climate change. Annu. Rev. Ecol. Evol. Syst.37, 637–669 (2006).
-
- Thomas, C. D. Climate, climate change and range boundaries. Divers. Distrib.16, 488–495 (2010).
-
- Iler, A. M., CaraDonna, P. J., Forrest, J. R. K. & Post, E. Demographic consequences of phenological shifts in response to climate change. Annu. Rev. Ecol. Evol. Syst.52, 221–245 (2021).
-
- Millien, V., Lyons, S. K., Smith, F. A., Wilson, A. B. & Yom-Tov, Y. Ecotypic variation in the context of global climate change: revisiting the rules. Ecol. Lett.9, 853–869 (2006). - PubMed
-
- Gardner, J. L., Peters, A., Kearney, M. R., Joseph, L. & Heinsohn, R. Declining body size: a third universal response to warming?. Trends Ecol. Evol.26, 285–291 (2011). - PubMed
MeSH terms
Grants and funding
- FT150100139/Department of Education and Training | ARC | Centre of Excellence for Core to Crust Fluid Systems, Australian Research Council (ARC Centre of Excellence for Core to Crust Fluid Systems)
- PHD17-27/Commonwealth Scientific and Industrial Research Organisation (CSIRO)
- HDR Fee Merit Scholarship/Australian National University (ANU)
LinkOut - more resources
Full Text Sources
Medical
