. 2025 May;26(5):737-747.
doi: 10.1038/s41590-025-02136-4. Epub 2025 Apr 18.

Systemic inflammation impairs myelopoiesis and interferon type I responses in humans

Affiliations

Systemic inflammation impairs myelopoiesis and interferon type I responses in humans

Farid Keramati et al. Nat Immunol. 2025 May.

Abstract

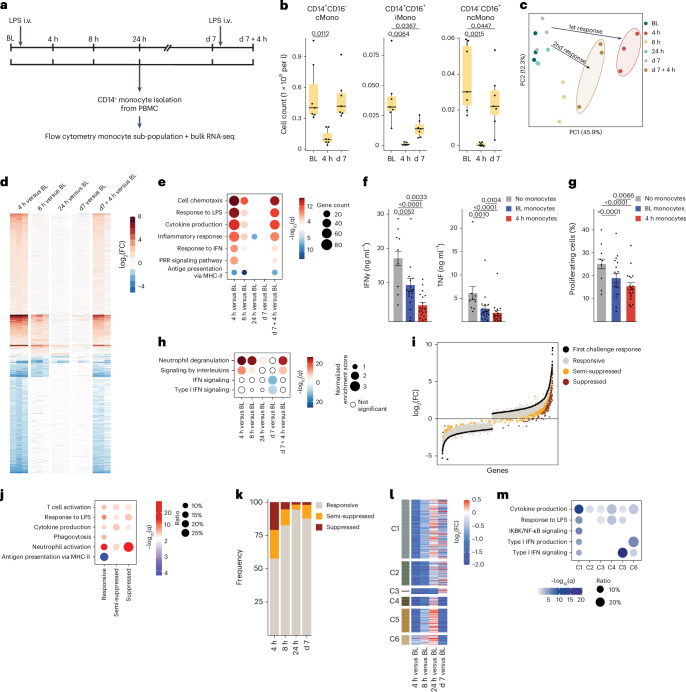
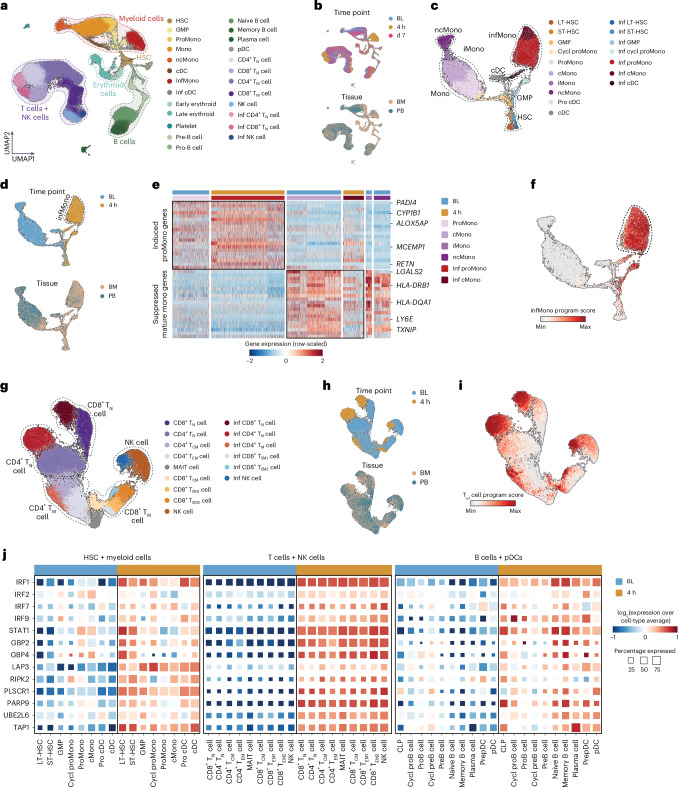
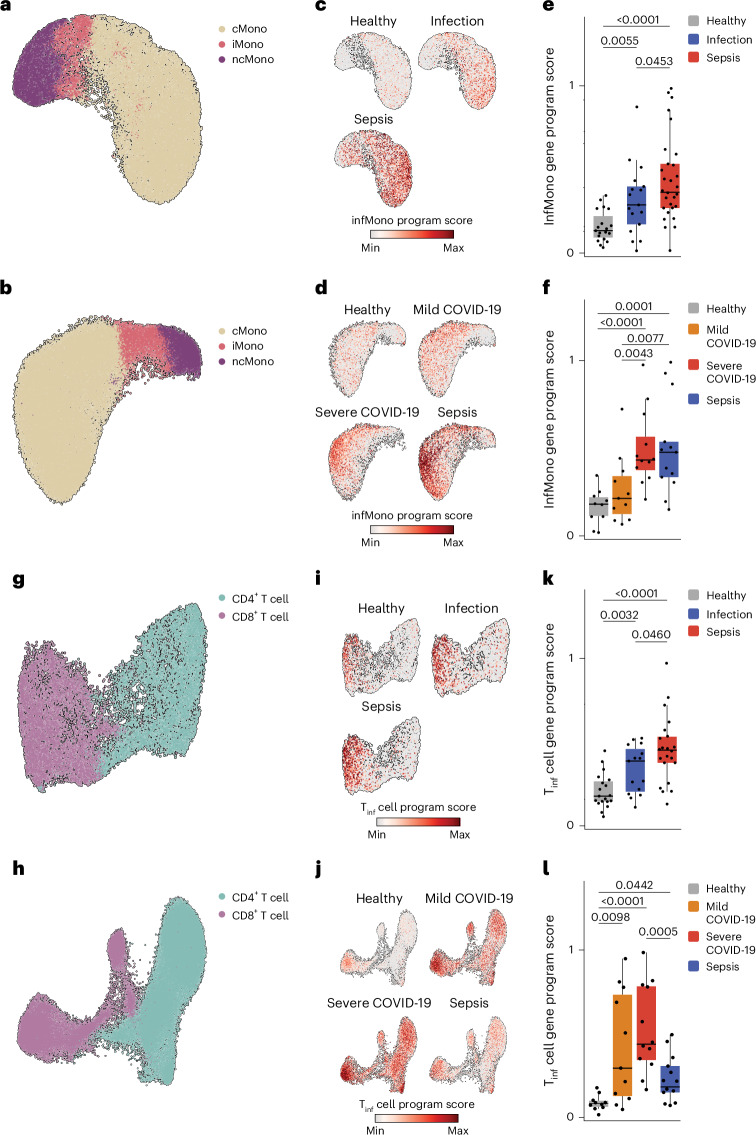
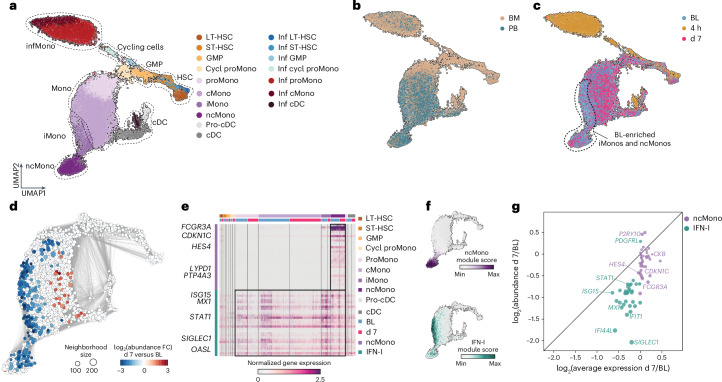
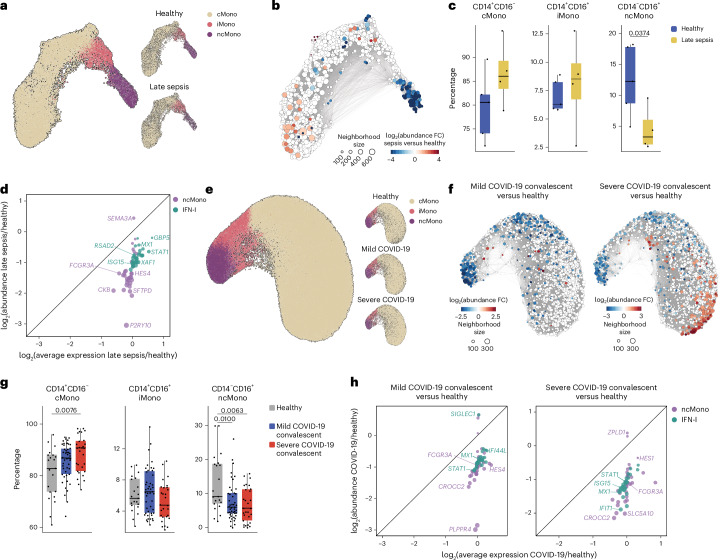
Systemic inflammatory conditions are classically characterized by an acute hyperinflammatory phase, followed by a late immunosuppressive phase that elevates the susceptibility to secondary infections. Comprehensive mechanistic understanding of these phases is largely lacking. To address this gap, we leveraged a controlled, human in vivo model of lipopolysaccharide (LPS)-induced systemic inflammation encompassing both phases. Single-cell RNA sequencing during the acute hyperinflammatory phase identified an inflammatory CD163+SLC39A8+CALR+ monocyte-like subset (infMono) at 4 h post-LPS administration. The late immunosuppressive phase was characterized by diminished expression of type I interferon (IFN)-responsive genes in monocytes, impaired myelopoiesis and a pronounced attenuation of the immune response on a secondary LPS challenge 1 week after the first. The infMono gene program and impaired myelopoiesis were also detected in patient cohorts with bacterial sepsis and coronavirus disease. IFNβ treatment restored type-I IFN responses and proinflammatory cytokine production and induced monocyte maturation, suggesting a potential treatment option for immunosuppression.


Conflict of interest statement

Competing interests: The authors declare no competing interests.

Figures

Fig. 1
Fig. 1. Impairment of IFN-I pathway in blood monocytes 1 week after LPS-induced systemic inflammation.
a, Schematic representation of the study and sample acquisition in healthy volunteers (n = 11). Seven volunteers were intravenously (i.v.) injected with LPS (2 ng kg−1) at baseline (BL, d0) and d7. Four volunteers were intravenously injected with placebo (0.9% NaCl) at BL. Peripheral blood was collected at BL, 4 h, 8 h, 24 h, d7 and d7 + 4 h. b, Box plots of absolute abundance of CD14+CD16 cMonos, CD14+CD16+ iMonos and CD14CD16+ ncMonos in blood of LPS-challenged volunteers (n = 7) at BL, 4 h and d7. c, Principal component analysis of blood CD14+ monocyte transcriptomes from LPS-challenged volunteers (n = 3) at BL, 4 h, 8 h, 24 h, d7 and d7 + 4 h. d, Heatmap representation of DEGs at 4 h, 8 h, 24 h, d7 and d7 + 4 h compared with BL as in c. e, GO term analysis of DEGs at 4 h, 8 h, 24 h, d7 and d7 + 4 h compared with BL as in c. f, Bar plots of TNF and IFNγ production in CD3+ T cells isolated from the blood of healthy donors (n = 9), activated with CD3 and CD28 antibody-coupled beads and co-cultured with cMonos obtained from LPS-challenged volunteers (n = 6) at BL and 4 h at 1:2 ratio. g, Bar plots of percentage of proliferating CD3- and CD28-activated CD3+ T cells isolated from the blood of healthy donors (n = 9), and co-cultured with cMonos obtained from LPS-challenged volunteers (n = 6) at BL and 4 h at 1:2 ratio as in f. h, GSEA of gene expression profiles at 4 h, 8 h, 24 h, d7 and d7 + 4 h compared with BL as in c. i, DEGs in blood CD14+ monocytes from LPS-challenged volunteers (n = 3) in response to both LPS challenges (first: 4 h versus BL; second: 7 d + 4 h versus 7 d) clustered into three groups: responsive (FC < 2), semi-suppressed (2 < FC < 3) and suppressed (FC > 3). j, GO term analysis of responsive, semi-suppressed and suppressed genes in CD14+ monocytes from LPS-challenged volunteers (n = 3) as in j. k, Percentage of responsive (FC < 2), semi-suppressed (2 < FC < 3) and suppressed (FC > 3) DEGs in blood CD14+ monocytes from LPS-challenged volunteers (n = 3) obtained at 4 h, 8 h, 24 h and d7 that were ex vivo stimulated with LPS (10 ng ml−1) versus CD14+ LPS-stimulated monocytes obtained at BL. l, Heatmap representation of average expression of DEGs in CD14+ restimulated monocytes from LPS-challenged volunteers (n = 3) obtained at 4 h, 8 h, 24 h and d7 based on fold-change relative to BL (n = 3) as in k. Genes were clustered (C1–C6) based on their behavior across the different time points. m, GO term analysis of genes in clusters C1–C6 defined as in l. The box plots in b show the median, first and third quartiles and the whiskers 1.5× the interquartile range (IQR). The bar plots in f and g are presented as mean values ± s.e.m. The P values were calculated using two-sided, paired Wilcoxon’s signed-rank tests.
Fig. 2
Fig. 2. Single-cell characterization of the acute hyperinflammatory response to LPS administration.
a, UMAP representation of all single cells obtained from bone marrow and peripheral blood of LPS-challenged healthy volunteers (n = 3 for each compartment at BL: bone marrow, 7 d before the LPS challenge; blood, immediately before the LPS challenge) and at 4 h and d7 post-LPS challenge, colored based on cell type. b, UMAP of all blood and bone marrow cells (n = 3) as in a, colored based on acquisition time point (top) and collected compartment (bottom). c, UMAP of blood and bone marrow HSCs and myeloid lineage cells at BL and 4 h (n = 3) as in a, colored based on cell type. d, UMAP of blood (PB) and bone marrow (BM) HSCs and myeloid lineage cells at BL and 4 h (n = 3) as in c, colored based on time point (top) and compartment (bottom). e, Heatmap representation of pro-monocyte and mature monocyte genes in myeloid cells from the bone marrow and blood of LPS-challenged healthy volunteers (n = 3) at BL and 4 h. f, NMF-inferred gene program enriched in blood and bone marrow infMonos from bone marrow and blood of LPS-challenged healthy volunteers (n = 3) as in d. g, UMAP of blood and bone marrow T and NK cells at BL and 4 h (n = 3) as in a, colored based on cell type. h, UMAP of blood and bone marrow T and NK cells at BL and 4 h (n = 3) as in g, colored based on time point (top) and compartment (bottom). i, NMF-inferred gene program enriched in Tinf cells from bone marrow and blood of LPS-challenged healthy volunteers (n = 3) as in h. j, Normalized expression profile of several IFN pathway genes in blood and bone marrow HSCs and myeloid lineage cells, T cells and NK cells, and B cells and pDCs of LPS-challenged healthy volunteers at BL and 4 h (n = 3). Max, maximum; min, minimum; Cycl, cycling; TN, naive T cell; TCM, central memory T cell; TEM, effector memory T cell; MAIT, mucosal-associated invariant T cell.
Fig. 3
Fig. 3. LPS-induced gene programs in sepsis and COVID-19.
a, UMAP representation of LYZ+ blood monocytes from patients with early sepsis (n = 29) and early nonseptic infection (n = 17) and healthy controls (n = 19). b, UMAP representation of LYZ+ blood monocytes from patients with early stage mild (n = 11) and severe (n = 12) COVID-19 and sepsis (n = 13) and healthy controls (n = 10). c, Enrichment of NMF-inferred infMono gene program in LYZ+ blood monocytes from patients with early sepsis and nonseptic infection and healthy controls as in a. d, Enrichment of the NMF-inferred infMono gene program in LYZ+ blood monocytes from patients with early stage mild and severe COVID-19 and sepsis and healthy controls as in b. e, Box plots of infMono gene program enrichment in LYZ+ blood monocytes from patients with early sepsis and nonseptic infection and healthy controls as in a. f, Box plots of infMono gene program enrichment in LYZ+ blood monocytes from patients with early stage mild and severe COVID-19 and sepsis and healthy controls as in b. g, UMAP representation of CD3+ blood T cells from patients with early sepsis and early nonseptic infection and healthy controls as in a. h, UMAP representation of CD3+ blood T cells from patients with early stage mild and severe COVID-19 and sepsis and healthy controls as in b. i, Enrichment of NMF-inferred Tinf cell gene program in CD3+ blood T cells from patients with early sepsis and early nonseptic infection and healthy controls as in g. j, Enrichment of NMF-inferred Tinf cell gene program in CD3+ blood T cells from patients with early stage mild and severe COVID-19 and sepsis and healthy controls as in h. k, Box plots of the Tinf cell gene program enrichment in CD3+ blood T cells from patients with early sepsis and nonseptic infection and healthy controls as in g. l, Box plots of Tinf cell gene program enrichment in in CD3+ blood T cells from patients with early stage mild and severe COVID-19 and sepsis and healthy controls as in h. The box plots in e, f, k and l show the median, first and third quartiles and the whiskers 1.5× the IQR. The P values were calculated using two-sided, unpaired Wilcoxon’s signed-rank tests.
Fig. 4
Fig. 4. Impairment of monocyte maturation in the late immunosuppressive phase after LPS administration.
a, UMAP representation of HSCs and myeloid lineage cells from bone marrow and peripheral blood of LPS-challenged healthy volunteers (n = 3 for each compartment) at BL (bone marrow, 7 d before the LPS challenge; blood, immediately before the LPS challenge) and at 4 h and d7 post-LPS challenge, colored based on cell type. b, UMAP of all blood and bone marrow cells (n = 3) as in a, colored based on compartment. c, UMAP of all blood and bone marrow cells (n = 3) as in a, colored based on time point. d, Nearest neighbor graph-based, differential abundance analysis between BL and d7 of HSCs and myeloid cells from bone marrow and blood of LPS-challenged healthy volunteers (n = 3 for each compartment). The blue circles represent significantly reduced neighborhoods on d7. e, Heatmap representation of NMF-inferred genes highly expressed in iMonos and ncMonos in cells as in d (n = 3 for each compartment). f, UMAP representation of enrichment of ncMono and IFN-I gene programs in cells as in d. g, Dot plot representation of log2(abundance change) versus log2(average expression change) of ncMono and IFN-I gene programs on d7 versus BL in cells as in d.
Fig. 5
Fig. 5. Impaired monocyte maturation in patients with sepsis and COVID-19.
a, Combined (left) and separated (right) UMAP representations of LYZ+ blood monocytes from patients with late-stage sepsis (n = 4) and healthy controls (n = 5), colored based on monocyte subset. b, Nearest neighbor graph-based differential abundance analysis between LYZ+ blood monocytes from healthy participants and patients with late sepsis as in a. The blue circles represent significantly reduced neighborhoods in late sepsis versus healthy samples. c, Box plots depicting percentages of different monocyte subsets in the blood of patients with late sepsis (n = 4) and healthy controls (n = 5). d, Dot plot representation of log2(abundance change) versus log2(average expression change) of ncMono-enriched and IFN-I genes in LYZ+ blood monocytes of patients with late sepsis (n = 4) versus healthy controls (n = 5). e, Combined (left) and separated (right) UMAP representations of LYZ+ blood monocytes from patients who recovered from mild (n = 46) and severe (n = 29) COVID-19, as well as healthy controls (n = 20), colored based on monocyte subset. f, Nearest neighbor graph-based, differential abundance analysis between LYZ+ blood monocytes from healthy participants and patients who recovered from COVID-19 as in e. The blue circles represent significantly reduced neighborhoods in convalescent COVID-19 samples versus healthy ones. g, Box plots depicting percentages of different monocyte subsets in the blood of patients who recovered from mild (n = 46) and severe (n = 29) COVID-19, as well as healthy controls (n = 20). h, Dot plot representation of log2(abundance change) versus log2(average expression change) of ncMono-enriched and IFN-I genes in LYZ+ blood monocytes of blood of patients who recovered from mild (n = 46) and severe (n = 29) COVID-19 versus healthy controls (n = 20). Box plots in c and g show the median, first and third quartiles and the whiskers 1.5× the IQR. The P values were calculated using unpaired, one-sided Wilcoxon’s signed-rank tests.
Fig. 6
Fig. 6. IFNβ treatment reverses LPS-induced immunosuppression.
a, Box plots of log2(fold-change) in TNF (left) and IL-6 (right) production by cMonos obtained from LPS-challenged volunteers (n = 6) on BL and d7 who were stimulated with LPS (10 ng ml−1) in the presence or absence of IFNβ (100, 250, 500 U ml−1) for 24 h. b, Comparison of expression of inflammatory and ISGs between cMonos obtained from LPS-challenged volunteers (n = 3) at BL and d7 who were stimulated with 10 ng ml−1 of LPS in the presence or absence of IFNβ (100 U ml−1) for 4 h. Data were normalized to the response of BL cMonos. c, Flow plots of a representative example of CD14 and CD16 expression of cMonos obtained from a healthy donor immediately after isolation (BL) and after 3 d of incubation with or without 100 U ml−1 of IFNβ in the presence or absence of an anti-IFNAR Ab (10 μg ml−1). The experiment was repeated in six donors (see d). d, Bar plots of percentages of monocyte subsets in the blood of healthy donors (n = 6) immediately after cMono isolation (BL) and at d3 of incubation of cMonos with or without 100 U ml−1 of IFNβ in the presence or absence of IFNAR Ab (10 μg ml−1). The box plots in a show the median and first and third quartiles and the whiskers 1.5× the IQR. Bar plots in d are presented as mean values ± s.e.m. The P values were calculated using two-sided, paired Student’s t-tests.
Extended Data Fig. 1
Extended Data Fig. 1. Characterization of LPS-induced systemic inflammation.
a, Box plots of flu-like symptoms, body temperature, and heart rate following intravenous injection of placebo (0.9% NaCl, blue, n = 4) or LPS (2 ng kg−1, red, n = 7) in healthy volunteers. b, Heatmap of log2(fold-change) blood concentrations of cytokines TNF, IL-10, CCL4, CCL3, IL-6, CXCL8, CCL2, IL-1RN following intravenous injection of placebo (0.9% NaCl, n = 4) or LPS (2 ng kg−1, n = 7) compared with baseline (timepoint 0) in healthy volunteers. c, Box plots of absolute number of blood leukocytes, monocytes, lymphocytes and neutrophils following intravenous injection of placebo (0.9% NaCl, blue, n = 4) or LPS (2 ng kg−1, red, n = 7) in healthy volunteers. d, Representative example of flow cytometric analysis of different blood monocyte subsets before (baseline) and at 4 h and d7 following LPS administration (2 ng kg−1). Box plots in a, c shows median, first and third quartiles; whiskers show 1.5x the interquartile range.
Extended Data Fig. 2
Extended Data Fig. 2. IFN signaling impairment in blood monocytes in the late immunosuppressive phase following LPS administration.
a, Scatterplot of gene expression in blood CD14+ monocytes at 4 h, 8 h, 24 h, d7, and d7 + 4 h following LPS administration (y-axis) versus baseline (before LPS administration, x-axis) in healthy volunteers. Dots represent the average expression of n = 3 replicates. Red dots indicate significantly up-regulated genes (fold-change > 2 & q value < 0.05), while blue dots depict significantly down-regulated genes (fold-change < 0.5 & q value < 0.05). b, log2(normalized expression) of MHC class II (HLA-II) genes in blood CD14+ monocytes at baseline (BL, before LPS administration) and at 4 h, 8 h, 24 h, d7, and d7 + 4 h following LPS administration in healthy volunteers (n = 3). c, Gene set enrichment analysis of interferon signaling genes in blood CD14+ monocytes of LPS-challenged healthy volunteers (n = 3, based on the d7 vs. BL comparison). d, log2(relative normalized expression) of interferon signaling genes in blood CD14+ monocytes of LPS-challenged healthy volunteers (n = 3, ordered and colored based on relative expression of d7 vs. BL).
Extended Data Fig. 3
Extended Data Fig. 3. Immunosuppression in the late immunosuppressive phase following LPS administration.
a, Heatmap of changes in flu-like symptoms, body temperature, and heart rate after the first and second intravenous challenge with 2 ng kg−1 LPS in healthy volunteers (n = 7). b, Heatmap of differences in log2(fold-change) blood concentrations of cytokines TNF, IL-10, CCL4, CCL3, IL-6, CXCL8, CCL2, IL-1RN between the first and second intravenous challenge with 2 ng kg−1 LPS in healthy volunteers (n = 7). c, Heatmap of changes in blood leukocyte (subtypes) after the first and second intravenous challenge with 2 ng kg−1 LPS in healthy volunteers (n = 7). d, Scatterplot of mean normalized gene expression profiles of blood CD14+ monocytes from LPS-challenged volunteers (n = 3) obtained at 4 h, 8 h, 24 h, and d7 that were ex vivo stimulated with LPS (10 ng mL−1) vs. CD14+ LPS-stimulated monocytes obtained at BL. Orange dots indicate semi-suppressed genes (-1>log2[fold-change]>-2) and red dots indicate suppressed genes (-2>log2[fold-change]). e, Heatmap of average log2(fold-change) difference in cytokine (TNF, IL6, IL1β, CCL4, IL10, IL1RN) production by blood CD14+CD16 classical monocytes (cMonos) obtained at 4 h and d7 after LPS administration in healthy volunteers (n = 7) that were ex vivo stimulated with Pam3Cys, Poly:IC, LPS, Flagelline, R848, E. coli, S. aureus, P. aeruginosa, C. albicans, and A. fumigatus compared with cytokine production of cMonos obtained from the same subjects at baseline (before LPS administration) stimulated with the same ligands. f, violin plot of log2(fold-change) difference in gene expression of blood CD14+ monocytes from LPS-challenged volunteers (n = 3) obtained at 4 h, 8 h, 24 h, and d7 that were ex vivo stimulated with LPS (10 ng mL−1) vs. CD14+ LPS-stimulated monocytes obtained at BL. Genes are clustered based on their dynamics over time (see main text and Fig. 1l). g, Scatterplot of log2(normalized expression) of IFN-I signaling pathway genes in blood CD14+ monocytes from LPS-challenged volunteers obtained at d7 that were ex vivo stimulated with LPS (10 ng mL−1, y-axis, mean expression of n = 3) compared to LPS-stimulated CD14+ monocytes form the same volunteers obtained at baseline (x-axis, mean expression of n = 3). h, Schematic representation of ex vivo BST2 flow cytometry experiments in immunosuppressed pan monocytes (containing all subsets) i, Representative example of flow cytometric analysis of monocyte subsets immediately after isolation, and after 24 h of incubation with or without LPS (10 ng mL−1). j, Overlay of BST2 mean fluorescence intensity (MFI) in cMonos obtained at baseline and at d7 after 24 h of ex vivo stimulation with LPS (10 ng mL−1). k, Bar plot of BST2 MFI in cMonos (n = 3) obtained at baseline and at d7 after 24 h of ex vivo stimulation with LPS (10 ng mL−1). Bar plot in k presented as mean values +/− SEM. The P value calculated using a paired two-sided t-test.
Extended Data Fig. 4
Extended Data Fig. 4. Single-cell characterization of the acute hyperinflammatory response to LPS administration in peripheral blood and bone marrow cells.
a, Violin plot of marker genes of all mononuclear immune cell types identified in peripheral blood and bone marrow obtained from LPS-challenged healthy volunteers (n = 3 for each compartment) at baseline (BL, before the LPS challenge) and at 4 h and d7 post-LPS challenge. b, Sample composition (in percentage) for each cell type depicted for each donor and timepoint as in a. c, Overlayed and separated UMAP of all cells in blood and bone marrow obtained from LPS-challenged healthy volunteers (n = 3 for each compartment) at BL, and at 4 h and d7 post-LPS challenge, colored based on acquisition time point (upper) and compartment (bottom). d, Violin plot of marker genes HSCs and myeloid cell types identified in blood and bone marrow obtained from LPS-challenged healthy volunteers (n = 3 for each compartment) at BL and at 4 h and d7 post-LPS challenge. e, Overlayed and separated UMAP of HSCs and myeloid cells in blood and bone marrow obtained from LPS-challenged healthy volunteers (n = 3 for each compartment) at BL, and at 4 h post-LPS challenge, colored based on acquisition time point (upper) and compartment (bottom). f, Percentage of each monocytic cell type in blood and bone marrow obtained from LPS-challenged healthy volunteers (n = 3 for each compartment) at BL and 4 h post-LPS, separated based on compartment.
Extended Data Fig. 5
Extended Data Fig. 5. Single-cell characterization of the acute hyperinflammatory response to LPS administration in peripheral blood and bone marrow HSC & myeloid cells.
a, Scatterplot of normalized overall gene expression profiles of peripheral blood (x-axis) and bone marrow (y-axis) monocytes obtained from healthy volunteers (n = 3) at baseline (before LPS administration). b, Scatterplot of normalized baseline monocytic genes (genes highly expressed in monocytes) in blood (x-axis) and bone marrow (y-axis) monocytes obtained from healthy volunteers (n = 3) at baseline (before LPS administration). c, Percentage of each monocytic cell type in blood and bone marrow obtained from healthy volunteers (n = 3) at baseline (before LPS administration), colored based on compartment. d, Normalized expression of differentially expressed genes in blood and bone marrow monocytes obtained from healthy volunteers (n = 3) at 4 h post-LPS vs. baseline (BL). e, Scatterplot of logn(fold change) in differentially expressed genes in blood (x-axis) and bone marrow (y-axis) monocytes obtained from healthy volunteers (n = 3) at 4 h post-LPS vs. baseline. f, UMAP representation of identified 5 gene sets in blood and bone marrow HSC & myeloid cells of LPS-challenged healthy volunteers (n = 3 for each compartment) at baseline and at 4 h post-LPS challenge, with relative enrichment on single cell level. g, Heatmap of average enrichment of 5 identified gene sets in blood and bone marrow HSC & myeloid cells of LPS-challenged healthy volunteers (n = 3 for each compartment) at baseline and at 4 h post-LPS challenge per cell type and timepoint. h. Heatmap representation of infMono genes in myeloid cells of LPS-challenged healthy volunteers (n = 3 for each compartment) at baseline and at 4 h post-LPS challenge. i, UMAP representation of neutrophils from a publicly available healthy subjects peripheral blood neutrophil dataset. j, Violin plot of gene expression profiles of neutrophil-enriched genes in blood and bone marrow HSC & myeloid cells of LPS-challenged healthy volunteers (n = 3 for each compartment) at baseline and at 4 h post-LPS challenge.
Extended Data Fig. 6
Extended Data Fig. 6. Single-cell characterization of the acute hyperinflammatory response to LPS administration in peripheral blood and bone marrow lymphoid T, B and NK cells.
a, Violin plot of marker genes of different T and NK cell types identified in samples obtained from LPS-challenged healthy volunteers (n = 3 for each compartment) at baseline (BL, before the LPS challenge) and at 4 h post-LPS challenge. b, Overlayed and separated UMAP of lymphoid T and NK cells in blood and bone marrow obtained from LPS-challenged healthy volunteers (n = 3 for each compartment) at BL, and at 4 h post-LPS challenge, colored based on acquisition time point (upper) and compartment (bottom). c, UMAP representation of identified 3 gene sets in T and NK cells of LPS-challenged healthy volunteers (n = 3 for each compartment) at baseline and at 4 h post-LPS challenge, with relative enrichment on single cell level. d, Heatmap of average enrichment of 3 identified gene sets as in c, per cell type and timepoint. e, Scatterplot of normalized overall gene expression profiles of peripheral blood (x-axis) and bone marrow (y-axis) T and NK cells obtained from healthy volunteers (n = 3) at baseline (before LPS administration). f, Scatterplot of normalized T and NK cell genes (genes highly expressed in T and NK cells) in blood (x-axis) and bone marrow (y-axis) T and NK cells obtained from healthy volunteers (n = 3) at baseline (before LPS administration). g, Scatterplot of logn(fold change) in differentially expressed genes in blood (x-axis) and bone marrow (y-axis) T and NK cells obtained from healthy volunteers (n = 3) at 4 h post-LPS vs. baseline. h, Percentage of each T and NK cell type in blood and bone marrow samples as in b (n = 3 for each compartment) at BL and 4 h post-LPS, separated based on compartment. i, UMAP of B cells and pDCs in blood and bone marrow obtained from LPS-challenged healthy volunteers (n = 3 for each compartment) at BL, and at 4 h post-LPS challenge, colored by cell type. j, Overlayed and separated UMAP of lymphoid B and pDC cells in blood and bone marrow obtained from LPS-challenged healthy volunteers (n = 3 for each compartment) at BL, and at 4 h post-LPS challenge, colored based on acquisition time point (left) and compartment (right). k, Violin plot of marker genes of different lymphoid B and pDC cells identified in peripheral blood and bone marrow obtained from LPS-challenged healthy volunteers (n = 3 for each compartment) at baseline and at 4 h and d7 post-LPS challenge. l, UMAP representation of identified 4 gene sets in blood and bone marrow lymphoid B and pDC cells of LPS-challenged healthy volunteers (n = 3 for each compartment) at baseline and at 4 h post-LPS challenge, with relative enrichment on single cell level. m, Heatmap of average enrichment of 4 identified gene sets in blood and bone marrow lymphoid B and pDC cells of LPS-challenged healthy volunteers (n = 3 for each compartment) at baseline and at 4 h post-LPS challenge per cell type and timepoint.
Extended Data Fig. 7
Extended Data Fig. 7. LPS-induced gene programs in patients with early sepsis and impaired monocyte maturation in the late immunosuppressive phase following LPS administration.
a, UMAP representation of enrichment of sepsis specific MS1 (MDSC) gene signature defined in LYZ+ monocytes of patients with early sepsis (left panel) and in HSCs and myeloid cells in blood and bone marrow obtained from LPS-challenged healthy volunteers (n = 3 for each compartment) at baseline (before LPS administration) and at 4 h post-LPS challenge (right panel). b, Overlayed and separated UMAP of HSCs and myeloid cells in peripheral blood and bone marrow obtained from LPS-challenged healthy volunteers (n = 3 for each compartment) at BL, and at 4 h and d7 post-LPS challenge, colored based on compartment (left panels) and acquisition time point (right panels). c, Cell type proportion (percentage) of HSC and myeloid lineage cells in peripheral blood and bone marrow obtained from LPS-challenged healthy volunteers (n = 3 for each compartment) at BL and at d7 post-LPS challenge. d, Bar plot of log2(relative abundance [percentage] of each cell type) change in HSC and myeloid lineage cells in peripheral blood and bone marrow obtained from LPS-challenged healthy volunteers (n = 3 for each compartment) at BL and at d7 post-LPS challenge. e, UMAP of intermediate and non-classical monocytes in HSC and myeloid lineage cells in peripheral blood and bone marrow obtained from LPS-challenged healthy volunteers (n = 3 for each compartment) at baseline and at d7 post-LPS challenge. f, UMAP representation of normalized single-cell gene expression of several IFN-I signaling pathway and NCM-enriched genes in HSC and myeloid lineage cells in peripheral blood and bone marrow obtained from LPS-challenged healthy volunteers (n = 3 for each compartment) at baseline and at d7 post-LPS challenge.
Extended Data Fig. 8
Extended Data Fig. 8. IFNβ treatment reverses LPS-induced immunosuppression and promotes monocyte maturation.
a, Schematic representation of in vitro reversal experiments with IFNβ in LPS-immunosuppressed CD14+CD16 classical monocytes (cMonos). b, Box plots of TNF (left panel) and IL-6 (right panel) production by cMonos obtained from healthy donors (n = 8) that were incubated in the presence or absence of 1 ng mL−1 LPS for 24 h and restimulated after 6 d with 10 ng mL−1 LPS in the presence or absence of various concentration of IFNβ (100, 250, 500 U mL−1). The log2fold changes are over medium control (RPMI)-cultured cells that were stimulated with LPS on day 6. c, schematic representation of ex vivo BST2 flow cytometry experiments in immunosuppressed pan monocytes (containing all subsets) d, Representative example of flow cytometric analysis of monocyte subsets in Cmonos obtained at baseline and at d7 post-LPS that were ex vivo stimulated for 24 h with LPS (10 ng mL−1) in the presence and absence of IFNβ (250 U mL−1). e, Overlay of BST2 mean fluorescence intensity (MFI) in Cmonos obtained at baseline and at d7 post-LPS that were ex vivo stimulated for 24 h with LPS (10 ng mL−1) in the presence and absence of IFNβ (250 U mL−1). f, Bar plot of BST2 MFI in cMonos (n = 3) obtained at baseline and at d7 after 24 h of ex vivo stimulation with LPS (10 ng mL−1) in the presence and absence of IFNβ (250 U mL−1). g, Representative flow cytometry profiles of monocyte subsets in pan monocytes obtained from healthy donors (n = 4) immediately after isolation and following 24 h of incubation with or without IFNβ (250 U mL−1) in the presence and absence of IFNAR antibody (IFNAR Ab, 10 μg mL−1). h, Overlay of BST2 MFI on cMonos and CD14+CD16+ intermediate monocytes (iMonos) following 24 h of incubation with or without IFNβ (250 U mL−1) in the presence and absence of IFNAR Ab (10 μg mL−1). i, Bar plot of BST2 MFI on cMonos and iMonos following 24 h of incubation with or without IFNβ (250 U mL−1) in the presence and absence of IFNAR Ab (10 μg mL−1). Box plots in b show median, first and third quartiles; whiskers show 1.5x the interquartile range. Bar plots in f, i presented as mean values +/− SEM. The P values were calculated using paired two-sided t-tests.
Extended Data Fig. 9
Extended Data Fig. 9. Gating strategy to analyze monocyte subsets in peripheral blood.
a, Gating strategy used to identify three monocyte subsets in peripheral blood of LPS-challenged volunteers by flow cytometry. CM: classical monocyte (cMono); IM: intermediate monocyte (iMono); NCM: non classical monocyte (ncMono).

References

    1. Brun-Buisson, C. The epidemiology of the systemic inflammatory response. Intensive Care Med.26, S64–74 (2000). - PMC - PubMed
    1. Vincent, J.-L. et al. Assessment of the worldwide burden of critical illness: the Intensive Care Over Nations (ICON) audit. Lancet Respir. Med.2, 380–386 (2014). - PubMed
    1. Fleischmann, C. et al. Assessment of global incidence and mortality of hospital-treated depsis. Current estimates and limitations. Am. J. Respir. Crit. Care Med.193, 259–272 (2016). - PubMed
    1. Rudd, K. E. et al. Global, regional, and national sepsis incidence and mortality, 1990–2017: analysis for the Global Burden of Disease Study. Lancet395, 200–211 (2020). - PMC - PubMed
    1. Stortz, J. A. et al. Evidence for persistent immune suppression in patients who develop chronic critical illness after sepsis. Shock49, 249–258 (2018). - PMC - PubMed

LinkOut - more resources