

Network control energy reductions under DMT relate to serotonin receptors, signal diversity, and subjective experience
- PMID: 40251353
- PMCID: PMC12008288
- DOI: 10.1038/s42003-025-08078-9
Network control energy reductions under DMT relate to serotonin receptors, signal diversity, and subjective experience
Abstract
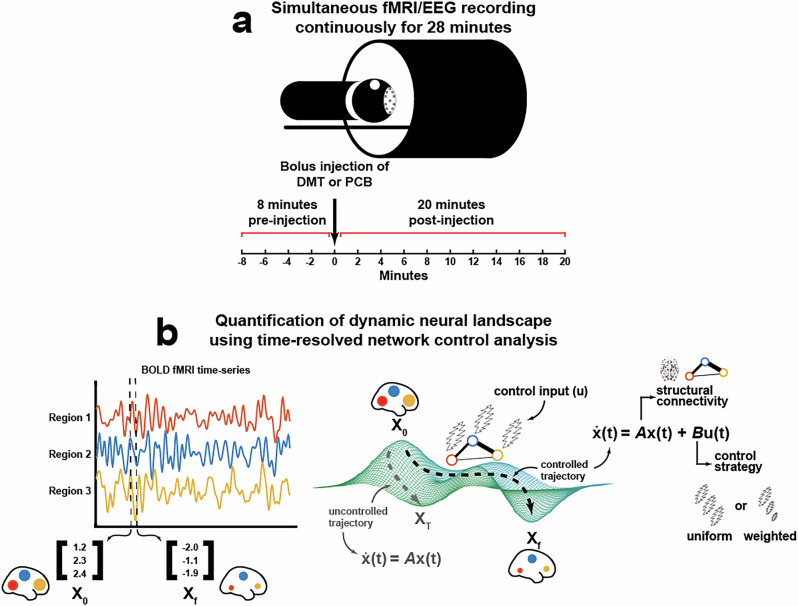
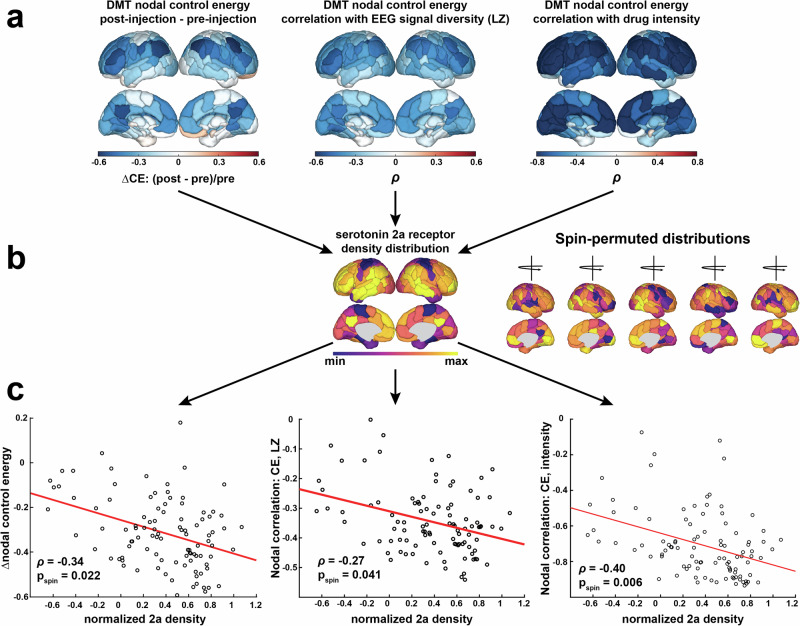
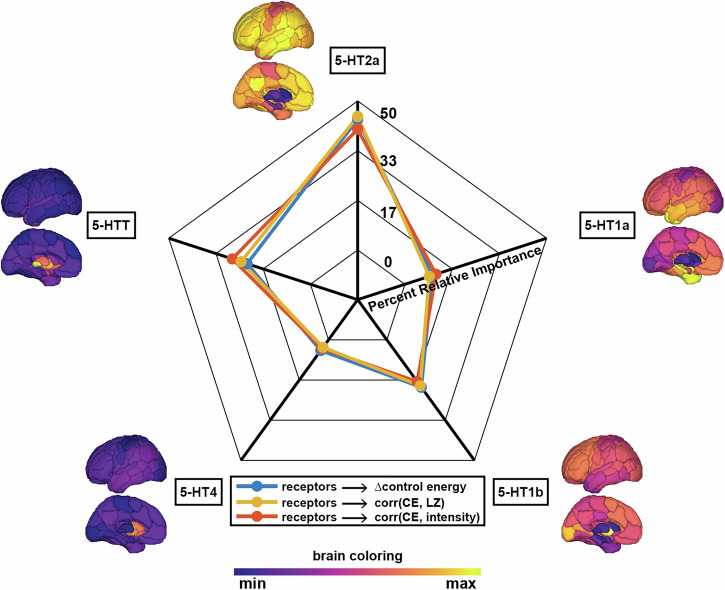
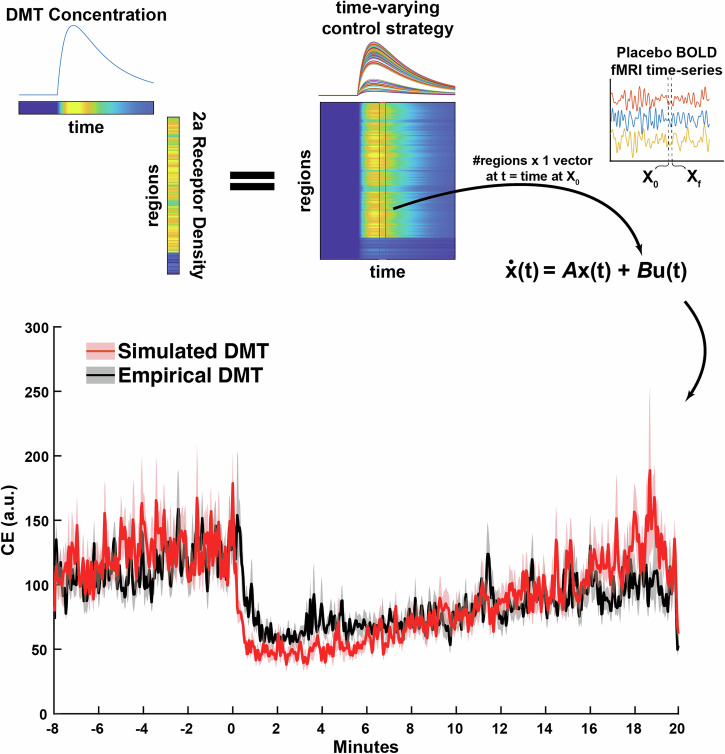
Psychedelics offer a profound window into the human brain through their robust effects on perception, subjective experience, and brain activity patterns. The serotonergic psychedelic N,N-dimethyltryptamine (DMT) induces a profoundly immersive altered state of consciousness lasting under 20 min, allowing the entire experience to be captured during a single functional magnetic resonance imaging (fMRI) scan. Using network control theory, we map energy trajectories of 14 individuals undergoing fMRI during DMT and placebo. We find that global control energy is reduced after DMT injection compared to placebo. Longitudinal trajectories of global control energy correlate with longitudinal trajectories of electroencephalography (EEG) signal diversity (a measure of entropy) and subjective drug intensity ratings. At the regional level, spatial patterns of DMT's effects on these metrics correlate with serotonin 2a receptor density from positron emission tomography (PET) data. Using receptor distribution and pharmacokinetic information, we recapitulate DMT's effects on global control energy trajectories, demonstrating control models can predict pharmacological effects on brain dynamics.
© 2025. The Author(s).
Conflict of interest statement
Competing interests: RLC-H is a scientific advisor to TRYP Therapeutics, Usona Institute, Journey Collab, Osmind, Maya Health, Beckley Psytech, Anuma, MindState, and Entheos Labs. All other authors have no conflicts of interest to declare.
Figures

Update of
-
Time-resolved network control analysis links reduced control energy under DMT with the serotonin 2a receptor, signal diversity, and subjective experience.bioRxiv [Preprint]. 2023 May 12:2023.05.11.540409. doi: 10.1101/2023.05.11.540409. bioRxiv. 2023. Update in: Commun Biol. 2025 Apr 18;8(1):631. doi: 10.1038/s42003-025-08078-9. PMID: 37214949 Free PMC article. Updated. Preprint.
Similar articles
-
Time-resolved network control analysis links reduced control energy under DMT with the serotonin 2a receptor, signal diversity, and subjective experience.bioRxiv [Preprint]. 2023 May 12:2023.05.11.540409. doi: 10.1101/2023.05.11.540409. bioRxiv. 2023. Update in: Commun Biol. 2025 Apr 18;8(1):631. doi: 10.1038/s42003-025-08078-9. PMID: 37214949 Free PMC article. Updated. Preprint.
-
Human brain effects of DMT assessed via EEG-fMRI.Proc Natl Acad Sci U S A. 2023 Mar 28;120(13):e2218949120. doi: 10.1073/pnas.2218949120. Epub 2023 Mar 20. Proc Natl Acad Sci U S A. 2023. PMID: 36940333 Free PMC article.
-
Neural correlates of the DMT experience assessed with multivariate EEG.Sci Rep. 2019 Nov 19;9(1):16324. doi: 10.1038/s41598-019-51974-4. Sci Rep. 2019. PMID: 31745107 Free PMC article.
-
Significance of mammalian N, N-dimethyltryptamine (DMT): A 60-year-old debate.J Psychopharmacol. 2022 Aug;36(8):905-919. doi: 10.1177/02698811221104054. Epub 2022 Jun 13. J Psychopharmacol. 2022. PMID: 35695604 Review.
-
N, N-dimethyltryptamine (DMT) in rodent brain: Concentrations, distribution, and recent pharmacological data.Prog Neuropsychopharmacol Biol Psychiatry. 2025 Mar 20;137:111259. doi: 10.1016/j.pnpbp.2025.111259. Epub 2025 Jan 19. Prog Neuropsychopharmacol Biol Psychiatry. 2025. PMID: 39832749 Review.
Cited by
-
Spatiotemporal asymmetries on brain energy landscape uncover system entrapment related to depression severity.Res Sq [Preprint]. 2025 Aug 19:rs.3.rs-7312306. doi: 10.21203/rs.3.rs-7312306/v1. Res Sq. 2025. PMID: 40894024 Free PMC article. Preprint.
-
What fMRI studies say about the nature of the psychedelic effect: a scoping review.Front Neurosci. 2025 Jul 1;19:1606798. doi: 10.3389/fnins.2025.1606798. eCollection 2025. Front Neurosci. 2025. PMID: 40666257 Free PMC article.
References
-
- Nichols, D. E. Hallucinogens. Pharmacol. Ther.101, 131–181 (2004). - PubMed
-
- Shulgin, A. T. & Shulgin, A. Tihkal: The Continuation (Transform Press, Berkeley, CA, 1997).
-
- Andersen, K. A. A., Carhart-Harris, R., Nutt, D. J. & Erritzoe, D. Therapeutic effects of classic serotonergic psychedelics: a systematic review of modern-era clinical studies. Acta Psychiatr. Scand.143, 101–118 (2021). - PubMed
-
- Metzner, R. Sacred Vine of Spirits: Ayahuasca (Inner Traditions / Bear & Co, 2005).
MeSH terms
Substances
Grants and funding
LinkOut - more resources
Full Text Sources
