Clinical Trial
. 2025 May;6(5):786-800.
doi: 10.1038/s43018-025-00940-3. Epub 2025 Apr 18.

Safety and feasibility of 4-1BB co-stimulated CD19-specific CAR-NK cell therapy in refractory/relapsed large B cell lymphoma: a phase 1 trial

Affiliations
Clinical Trial

Safety and feasibility of 4-1BB co-stimulated CD19-specific CAR-NK cell therapy in refractory/relapsed large B cell lymphoma: a phase 1 trial

Wen Lei et al. Nat Cancer. 2025 May.

Erratum in

Abstract

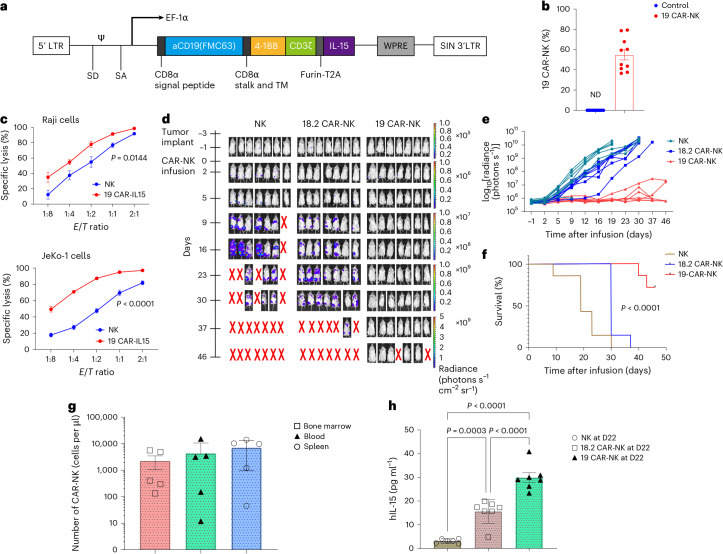
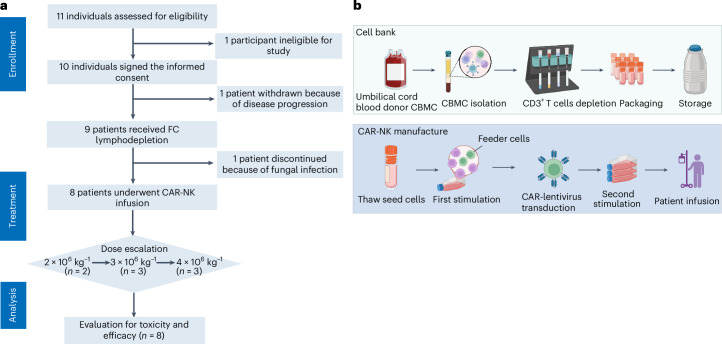
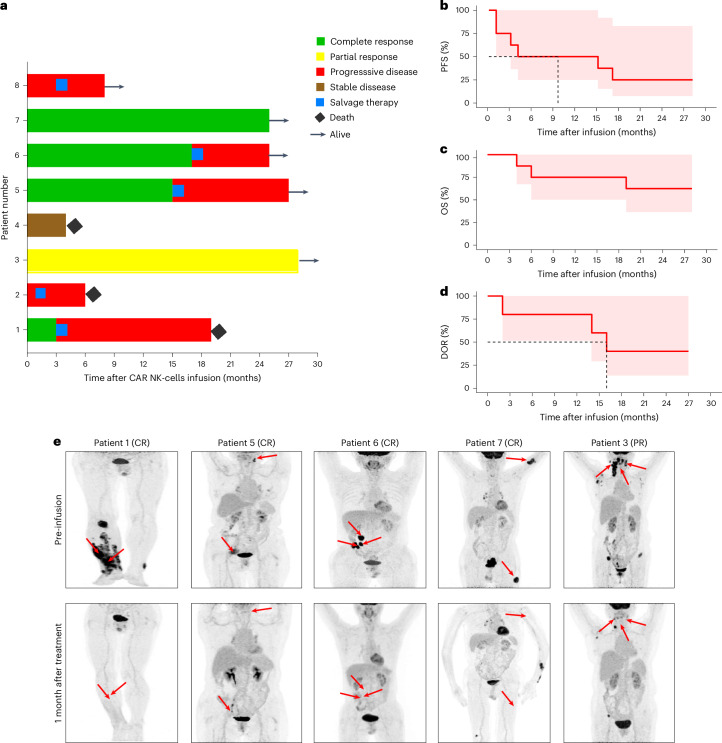
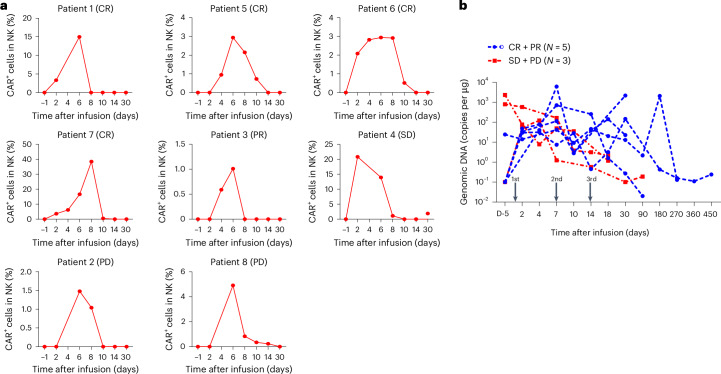
Chimeric antigen receptor (CAR)-modified NK (CAR-NK) cells are candidates for next-generation cancer immunotherapies. Here we generated CD19-specific CAR-NK cells with 4-1BB and CD3ζ signaling endo-domains (CD19-BBz CAR-NK) by transduction of cord blood-derived NK cells using baboon envelope pseudotyped lentiviral vectors and demonstrated their antitumor activity in preclinical B cell lymphoma models in female mice. We next conducted a phase 1 dose-escalation trial involving repetitive administration of CAR-NK cells in 8 patients with relapsed/refractory large B cell lymphoma (NCT05472558). Primary end points were safety, maximum tolerated dose, and overall response rate. Secondary end points included duration of response, overall survival, and progression-free survival. No dose-limiting toxicities occurred, and the maximum tolerated dose was not reached. No cases of cytokine release syndrome, neurotoxicity, or graft-versus-host disease were observed. Results showed an overall response rate of 62.5% at day 30, with 4 patients (50%) achieving complete response. The median progression-free survival was 9.5 months, and the median overall survival was not reached. A post hoc exploratory single-cell RNA sequencing analysis revealed molecular features of CAR-NK cells associated with therapeutic efficacy and efficacy-related immune cell interaction networks. This study met the pre-specified end points. In conclusion, CD19-BBz CAR-NK cells were feasible and therapeutically safe, capable of inducing durable response in patients with B cell lymphoma.


Conflict of interest statement

Competing interests: The authors declare no competing interests.

Figures

Fig. 1
Fig. 1. CD19-BBz CAR-NK cells showed strong antitumor activity.
a, Schematic representation of CD19-BBz CAR lentiviral vector, including a CD8 signal peptide, anti-CD19 scFv, CD8a stalk 4-1BB co-stimulatory, and CD3ζ domain. A sIL-15 followed the CAR via T2A. LTR, long terminal repeat; TM, transmembrane. Ψ, RNA packaging signal; EF-1α, elongation factor 1-alpha 1; SD, splice donor; SA, splice acceptor; WPRE, woodchuck hepatitis virus post-transcriptional regulatory element; SIN, self-inactivating. b, CAR+ NK cells frequency from 10 independent cord blood units as measured by flow cytometry. Data are expressed as mean ± s.e.m. (n = 10). ND, not detected. CD56+CAR+ NK cells were gated in the hCD45+ cells listed in Supplementary Fig. 1a (upper panel). c, Cytotoxicity of CD19-BBz CAR-NK cells compared with un-transfected NK cells on Raji or JeKo-1 cells at the indicated E/T ratios as measured by luciferase-based cytotoxicity assay. Data are expressed as mean ± s.e.m. (n = 4 biologically independent experiments). Two-way repeated measures analysis of variance (ANOVA) (Bonferroni posttest) was used. d,e, Antitumor abilities of CD19-BBz CAR-NK in JeKo-1-Luc cell-inoculated NSG mice model. Tumor burden was measured by bioluminescence imaging (d, n = 7) and total flux (e, n = 7) within 46 days. Tumor cells were implanted on day −3, and CAR-NK cells were administered on day 0. f, Survival of JeKo-1-bearing mice in each group (n = 7) was analyzed by Kaplan–Meier by the log-rank test. g, Absolute numbers of CAR+ NK cells in blood, spleen, and bone marrow measured by flow cytometry at day 46. Data are presented as mean ± s.e.m. (n = 5 mice). Gating strategies are presented in Supplementary Fig. 1b. GFP+ cells represent the tumor cells. CD56+ CAR+ NK cells were gated in the mCD45hCD45+GFP cells. h, IL-15 secretion from mice plasma at day 22 after CAR-NK infusion (n = 6 in NK group, n = 7 in 18.2-BBz CAR-NK and CD19-BBz CAR-NK group). One-way ANOVA test was used. Data are presented as mean ± s.e.m. Source data
Fig. 2
Fig. 2. Flow diagram of the clinical trial and the process of CAR-NK manufacture.
a, Consolidated Standards of Reporting Trials flow chart summarizing the number of participants screened, enrolled, treated, and followed in the study. b, CBMCs were isolated from the umbilical cord blood by Ficoll density gradient centrifugation, and CD3+ T cells were depleted using CD3 microbeads. CD3 CBMCs were stored as seed cells. When CAR-NK cells were manufactured, CD3 CBMC seed cells were thawed and underwent two-cycle feed-cell stimulation and CAR transduction before infusion. FC represents fludarabine combined with cyclophosphamide.
Fig. 3
Fig. 3. Efficacy profiles of CD19-BBz CAR-NK cell therapy.
a, Swimmer plot (n = 8), in which each bar represents an individual patient. Responses evaluated at month 1 are designated by color. bd, Kaplan–Meier analyses for PFS (n = 8) (b), overall survival (OS, n = 8) (c), and DOR (d) in the patients who achieved CR and partial response (n = 5). The red line represents Kaplan–Meier curves for PFS (b), OS (c), and DOR (d), and the dashed line indicates median PFS (b) and DOR (d), respectively. The red shading represents the 95% confidence interval. e, PET–CT scans of 5 patients who achieved a response before and after CAR-NK cell treatment. The red arrows indicate tumor locations. Source data
Fig. 4
Fig. 4. Proliferation and persistence of CD19-BBz CAR-NK cells.
a, CAR+ NK cell counts in peripheral blood of 8 patients after infusions were assessed by flow cytometry. CAR+ NK cells were identified as CD56+CAR+ cells in CD3CD56+ NK cells gated on the CD45+ lymphocyte population. The gate strategies are listed in Supplementary Fig. 1c. Myeloid cells were excluded by gating on the CD33 and CD14 positive cells. CD56+CAR+ cells were gated in CD3CD56+ NK cells from the CD45+CD33/CD14 lymphocyte population. b, Kinetics of genetically modified NK cells in peripheral blood were determined by ddPCR. The arrow indicates times of CAR-NK cell infusion. Source data
Fig. 5
Fig. 5. Single-cell transcriptome of CD19-BBz CAR-NK products.
a, UMAP of 89,658 NK cells from 7 CAR-NK products, showing the formation of 6 subclusters shown in different colors, of which 2 products were linked to CR, 2 products were linked to PD, and 3 products (fCAR-NK) were analyzed after cryopreservation and revival. b, Top five DEGs in each identified subcluster. c, The fractions of each subcluster in each sample. d, UMAP showing the cell differentiation potential of each subcluster calculated using the CytoTRACE v2 algorithm. e, Expression distribution of gene sets related to cell proliferation and DNA replication using the UCell algorithm. The dashed circles in a, d and e highlight immune cell subtypes exhibiting significant differences in proportions between groups. f, Gene set enrichment analysis of DEGs in cluster NK0 and NK4 and mapping to UMAP for illustration (UCell scores were standardized by z-score). P value was calculated from empirical phenotype-based permutation test. NES, normalized enrichment score. g, Heat map of DEGs between CR, PD, and fCAR-NK groups, and mulberry plots showing their KEGG enrichment terms. P value was calculated from Fisher exact test. h, Evaluation models related to in vitro and in vivo efficacy. Source data
Fig. 6
Fig. 6. Single-cell transcriptomic landscape of peripheral immune cells.
a, UMAP visualization of transcriptomic profiles of 51,068 cells in PBMC samples obtained from 5 patients (3 from CR and 2 from PD). Fifteen distinct clusters were identified. The dashed circles highlight immune cell subtypes exhibiting significant differences in proportions between groups. b, Distribution of each cluster between the CR and PD groups. c, Volcano diagram of DEGs between CR and PD groups in each subcluster of antigen-presenting related cells, CD4-T cells, and cytotoxic cells. d, GSVA score differences (CR versus PD, median of delta GSVA score, mean ± s.e.m.) across five gene sets (above the red dashed line indicates enrichment in CR, while below the blue dashed line indicates enrichment in PD). Dot plots represent ten subclusters which were classified into three cell types. e, Pearson correlation analyses of “CBLB-ubiquitination” gene set with antigen presentation, immunosuppression, and cytotoxicity gene sets in two different cell types. Each scatter point represents GSVA score of a subcluster of the same cell types from five samples. Correlation coefficient P value was calculated. f, Quantitative reverse transcription PCR validation of CBLB mRNA expression in patients’ PBMCs. Data are expressed as mean ± s.e.m. (n = 5 versus 4). Two-sided Student’s t-test was used. g,h, Analysis of communication among immune cells in patients with CR and patients with PD regarding TGFβ signaling (g) and MHC-II signaling (h). Source data
Extended Data Fig. 1
Extended Data Fig. 1. The characteristics of CD19-specific CAR-NK cells generated by BaEV-LV.
a, Transduction efficiency of BaEV-LV was analyzed in comparison to the VSV-G-pseudotyped lentivirus vector (VSV-G), measured as percentage of Venus in NK92MI cells by flow cytometry. The gate strategies were showed in Supplementary Fig. 1d. Multiplicity of infection (MOI) was defined based on the titration measurement performed on Jurkat cells using serial vector dilutions. Representative data from 2 independent experiments are shown. b, Representative fluorescent confocal microscopy images of CD19-BBz CAR-NK cells interacting with Raji cells. Raji cells were transduced to express GFP fused firefly luciferase (in green), and NK cells were labeled with anti-mouse FMC63 scFv antibody (Alexa Fluor 647, in red). The data are representative of four biologically independent experiments. c, Correlation between the amount of secretory interleukin (IL)-15 in the culture medium and CD19-BBz CAR-NK cell percentage in total NK cells (n = 23, Spearman’s coefficient r = 0.5137, P = 0.0122). Spearman correlation analysis was used. d, Cytotoxicity of CD19-BBz CAR-NK cells was measured in real-time, against the target cells NIH/3T3-CD19 at 1:1 or 1:3 effector-to-target (E: T) ratios at day 4 by Real Time Cellular Analysis (RTCA) platform. Assay performed in quadruplicate. Representative data from 2 biologically independent experiments are presented. Source data
Extended Data Fig. 2
Extended Data Fig. 2. Hematopoietic toxicity of CAR-NK cell therapy.
Absolute neutrophil counts and platelet counts are shown for patients receiving lymphodepletion chemotherapy at the indicated times post CAR-NK cell infusion (n = 8). Dashed red lines represent normal neutrophil counts, and dashed blue lines represent normal platelet counts. Source data
Extended Data Fig. 3
Extended Data Fig. 3. The association between the percentages of CAR+ cells of therapeutic product and clinical efficacy.
The percentages of CAR+ cells in therapeutic products for 8 patients were detected by flow cytometry. The correlation between the percentages of CAR+ cells and responses were analyzed (n = 8, Spearman’s coefficient r = 0.02554, P = 0.9690). Spearman correlation analysis was used. Source data
Extended Data Fig. 4
Extended Data Fig. 4. Kinetics of genetically modified NK cells in peripheral blood of patients were determined by ddPCR.
The times of CAR-NK cell infusion are marked by black arrows (n = 8). Source data
Extended Data Fig. 5
Extended Data Fig. 5. The changes of the cytokine and marker of inflammation and coagulopathy in serums obtained from the patients.
a, Serum kinetics of cytokines of eotaxin, IL-18, IL-1RA, IL-7, IP-10, MCP-1, MIP1α, MIP1β, RANTES, and SDF-1ɑ in 8 patients who received infusions with CAR-NK cells. b, Heatmap of a panel of other cytokines detected in the serum from 8 patients at pre- or post-infusion of CAR-NK cells. c, Serum levels of CRP, LDH, Fibrinogen, D-dimer, and Ferritin in 8 patients before and after CAR-NK cell infusion. Source data
Extended Data Fig. 6
Extended Data Fig. 6. Functional analysis of various clusters of CD19-BBz CAR-NK products.
a, Scatter plot (showing median and extremum) illustrating intergroup differences in subclusters (n = 2 for CR, 2 for PD, 3 for fCAR-NK). b, Differences were compared between CR + PD (n = 4) and fCAR-NK (n = 3). Data were illustrated as mean ± SEM. A two-sided student’s t-test was used. P = 0.035 (NK1), P = 0.004 (NK2), P = 0.0001 (NK3). c, Scatter plot (showing mean ± SEM) illustrating differences between CAR-NK products derived from male (XIST-, n = 3) and female (XIST + , n = 4). P values were calculated using a two-sided student t-test. P = 0.018. d, GSVA analysis based on gene expression levels of each subcluster, data source from Hallmarker (n = 2 for CR, 2 for PD, and 3 for fCAR-NK). e, Bar plot of KEGG enrichment analysis of DEGs of each subcluster (n = 2 for CR, 2 for PD, and 3 for fCAR-NK). Source data
Extended Data Fig. 7
Extended Data Fig. 7. Functional analysis between CD19-BBz CAR-NK product groups.
a, Heatmap of representative “exhaustion,” “cytotoxicity,” and “immune potential”-related gene sets across CR, PD, and fCAR-NK group, boxplots of these three gene sets mean scores of each product (centre of box mean median, bounds of box means upper and lower quartiles, whisker means maximum and minimum, n = 2 for CR, 2 for PD, 3 for fCAR-NK), and violin plot of these gene set scores of each single cell (showing median, quartiles and extremum, n = 23644 cells from 2 CR samples, 27826 cells from 2 PD samples, 38188 cells from 3 fCAR-NK samples) and visualization on UMAP. A two-sided student’s t-test was used for every two groups. P < 0.0001. b, Module-trait relationship based on WGCNA analysis, and gene Ontology (GO) and KEGG pathway analysis of each module from WGCNA. c, The cytotoxic activities of CD19-BBz CAR-NK cells for CR + PR patients (n = 5) compared to those from SD + PD patients (n = 3) on Raji cells at the indicated effector-to-target (E/T) ratios by measured using Luciferase-based cytotoxicity assays. Data are expressed as median and quartiles (each dot plot represents 3 independent experiments and 4 technical repeats for each CAR-NK product). Two-way ANOVA (Bonferroni posttest) was used between groups. P = 0.1223. d, Cytotoxic activities of fresh CAR-NK cells compared to cryopreserved CAR-NK cells on Raji cells at the indicated effector-to-target (E/T) ratios as measured by Luciferase-based cytotoxicity assays. Data represent 3 independent experiments and 4 technical repeats, and are expressed as mean ± SEM. Two-way ANOVA (Bonferroni posttest) was used. P = 0.0012. Representative data from 1 independent experiment with 4 technical replicates. Source data
Extended Data Fig. 8
Extended Data Fig. 8. Differences of PBMCs clusters between groups.
a, Bubble plot indicating the expression of marker genes across all subclusters. b, Bars chart showing the fractions of each subcluster in each sample. c, Scatter plot displaying cell subpopulations with stable differences between groups (data are presented as median and extremum). n = 3 for CR, 2 for PD in a, b and c. Source data
Extended Data Fig. 9
Extended Data Fig. 9. Functional analysis between groups.
a, GSVA analysis based on gene expression levels of CR and PD, data source from Hallmarker (above) and KEGG (below). The pathways with differences between groups are divided into five gene sets based on biological functions (n = 3 for CR,2 for PD). b, Pearson correlation heatmap of five gene sets in antigen-presenting related cells, CD4 + T cells, and cytotoxic cells (n = 3 for CR,2 for PD). c, Distribution of XIST in two male patients’ PBMCs (CR3 and PD2), and the proportion of injected XIST+ cells to total NK plus Pro. NKT cells. d, Log copy numbers of CAR gene at 7 days (n = 6) and 14-30 days (n = 3) after administration. Data are expressed as mean ± SEM. A two-sided student’s t-test was used for each condition. P = 0.244 (Day 7), P = 0.044 (Day 14-30). e, Module-trait relationship based on WGCNA analysis of sc-RNA-seq of XIST+ (donor cells) and XIST- (recipient cells) in NK plus Pro. NKT populations of CR3 and PD2 samples, gene Ontology (GO), and KEGG pathway analysis of each module are presented. Source data
Extended Data Fig. 10
Extended Data Fig. 10. The differences before and after cryopreservation of the same CAR-NK product revealed by sc-RNA-seq.
a, UMAP, and subcluster ratio of CR1 and fCR1. b, Changes of 6 subclusters in various functional gene sets before and after cryopreservation. A two-sided paired t-test was used (n = 6). P = 0.008, 0.003, 0.33, and 0.023, respectively. c, UCell scores of MHC class I related genes among groups (n = 2 for CR, 2 for PD,3 for fCAR-NK). All data (b-c) were shown as median, quartiles, and extremum (centre of box means median, bounds of box means upper and lower quartiles, whisker means maximum and minimum). Source data

References

    1. Chong, E. A., Ruella, M., Schuster, S. J. & Lymphoma Program Investigators at the University of Pennsylvania Five-year outcomes for refractory B-cell lymphomas with CAR T-cell therapy. N. Engl. J. Med.384, 673–674 (2021). - PubMed
    1. Park, J. H. et al. Long-term follow-up of CD19 CAR therapy in acute lymphoblastic leukemia. N. Engl. J. Med.378, 449–459 (2018). - PMC - PubMed
    1. Xu, J. et al. Exploratory trial of a biepitopic CAR T-targeting B cell maturation antigen in relapsed/refractory multiple myeloma. Proc. Natl Acad. Sci. USA116, 9543–9551 (2019). - PMC - PubMed
    1. Qi, C. et al. Claudin18.2-specific CAR T cells in gastrointestinal cancers: phase 1 trial interim results. Nat. Med.28, 1189–1198 (2022). - PMC - PubMed
    1. Cappell, K. M. & Kochenderfer, J. N. Long-term outcomes following CAR T cell therapy: what we know so far. Nat. Rev. Clin. Oncol.20, 359–371 (2023). - PMC - PubMed

Publication types

MeSH terms

Substances

LinkOut - more resources