. 2025 May;10(5):1067-1083.
doi: 10.1038/s41564-025-01981-1. Epub 2025 Apr 18.

Phollow reveals in situ phage transmission dynamics in the zebrafish gut microbiome at single-virion resolution

Affiliations

Phollow reveals in situ phage transmission dynamics in the zebrafish gut microbiome at single-virion resolution

Lizett Ortiz de Ora et al. Nat Microbiol. 2025 May.

Abstract

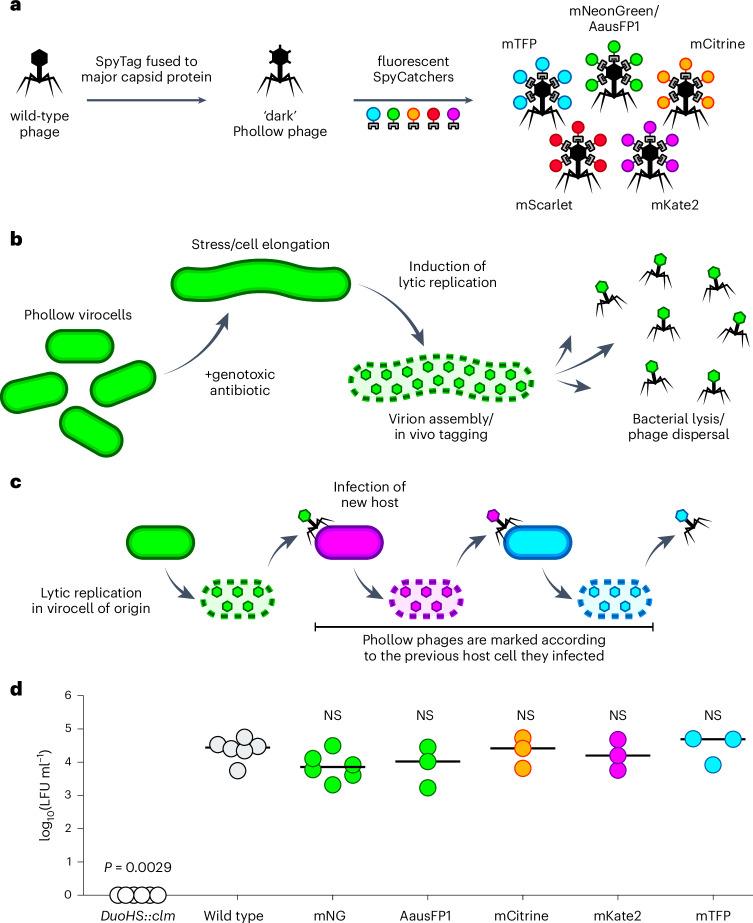
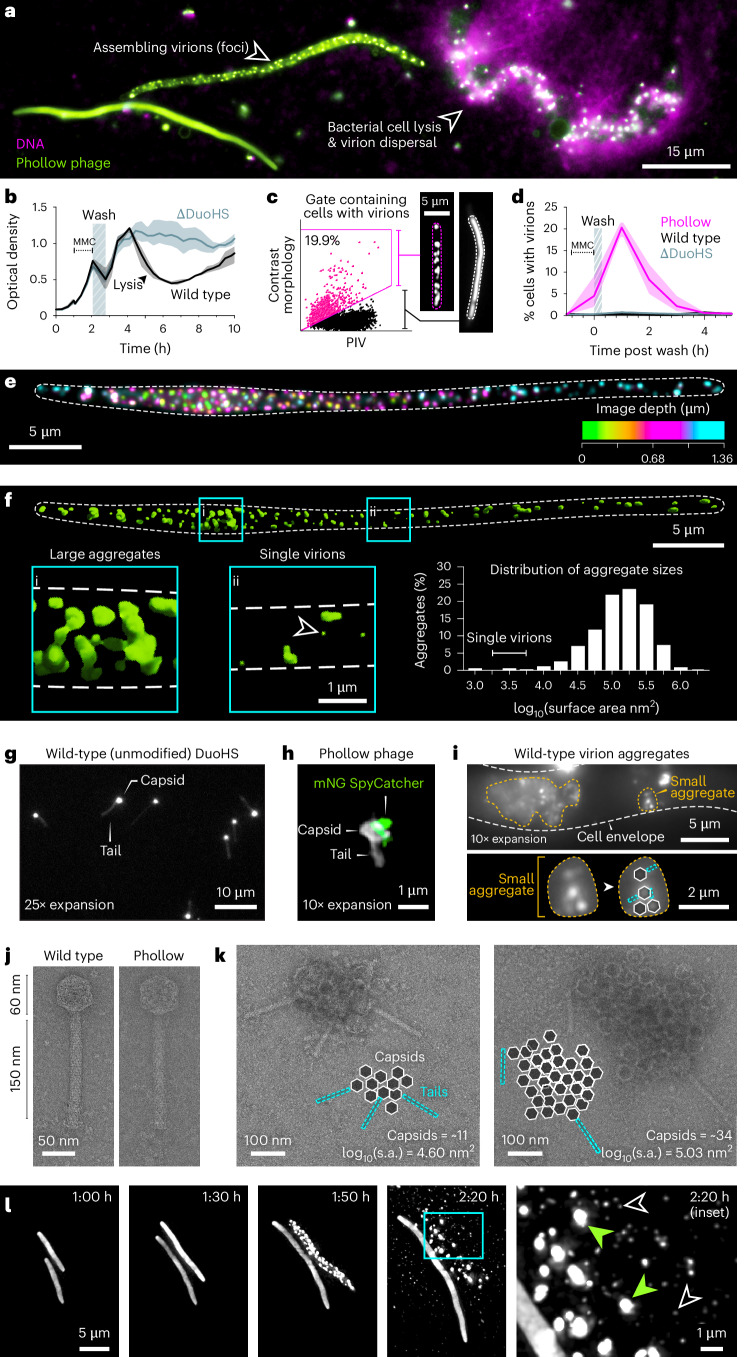
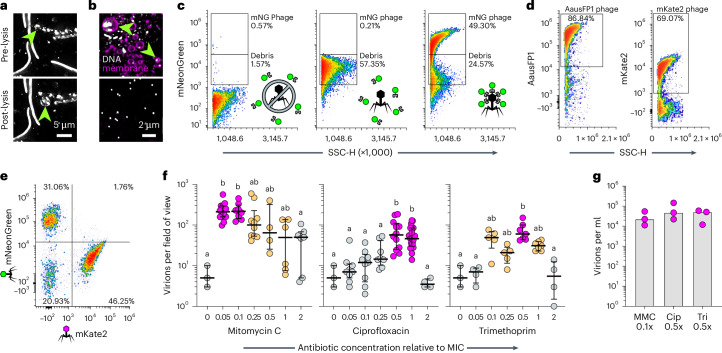
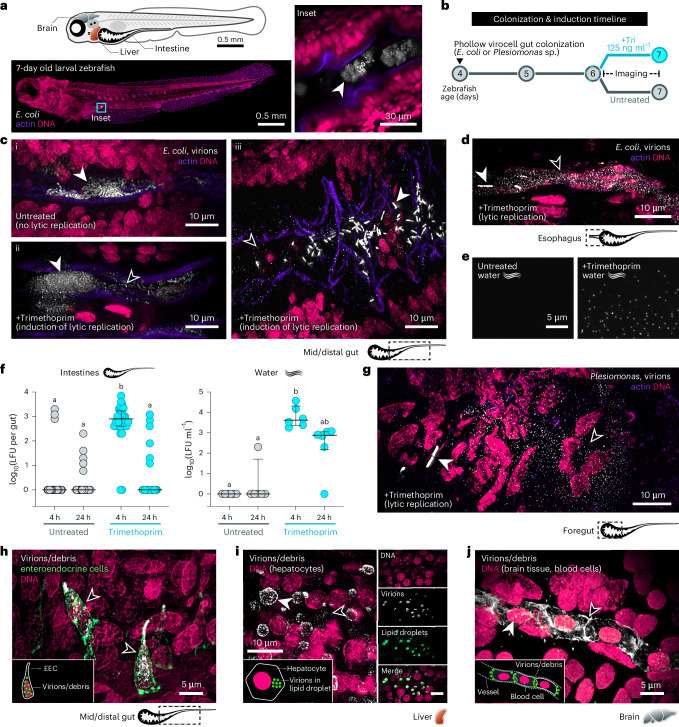
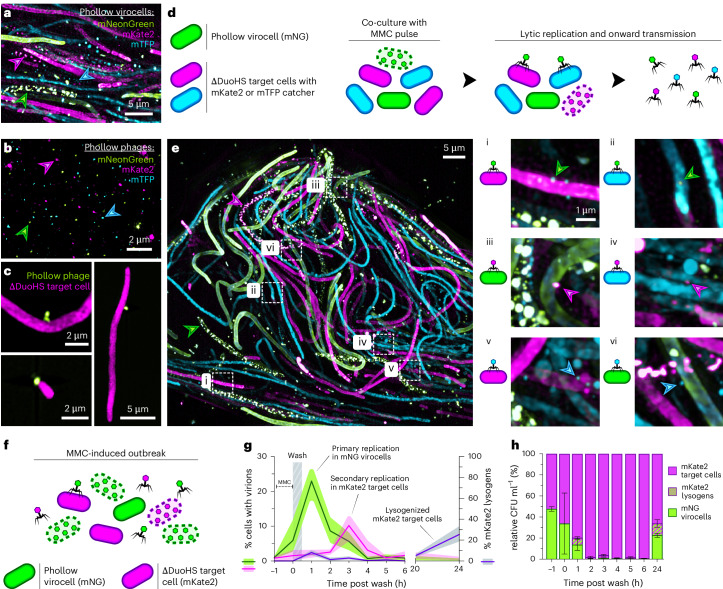
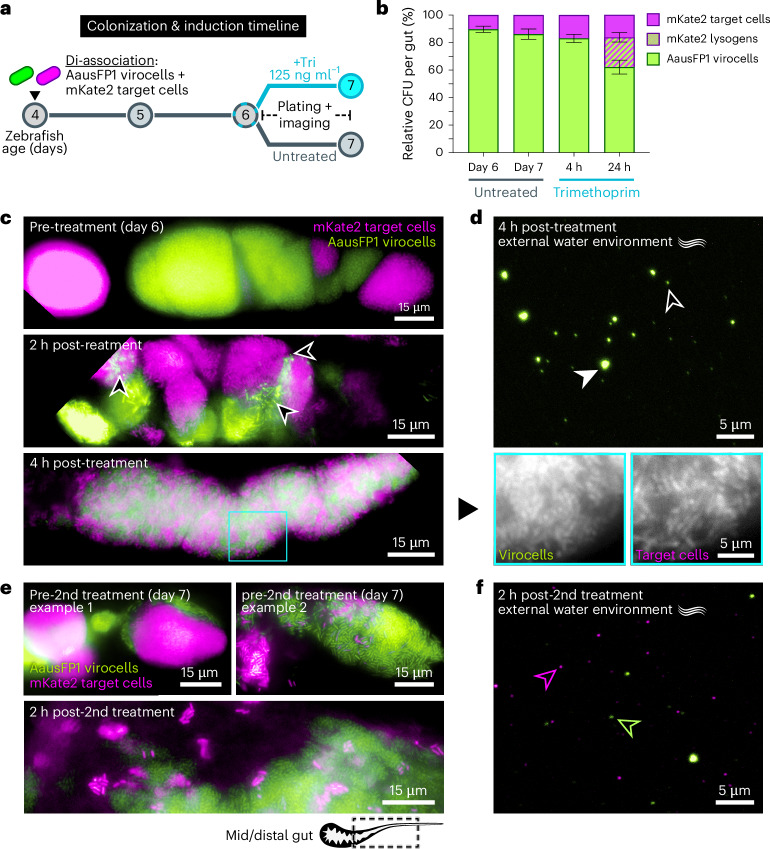
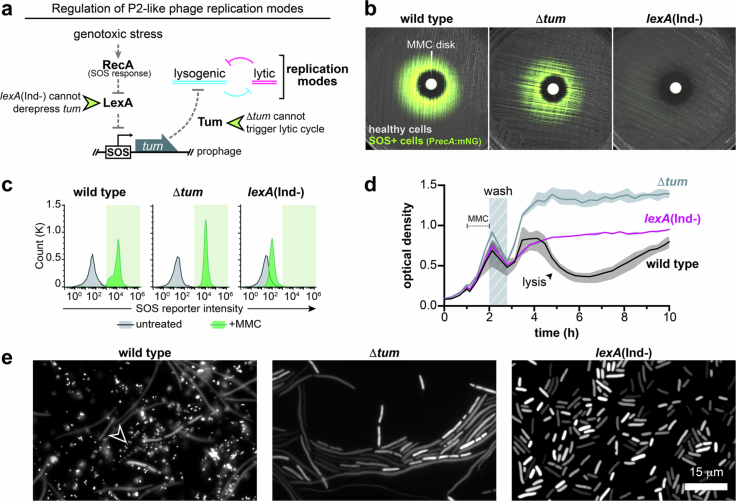
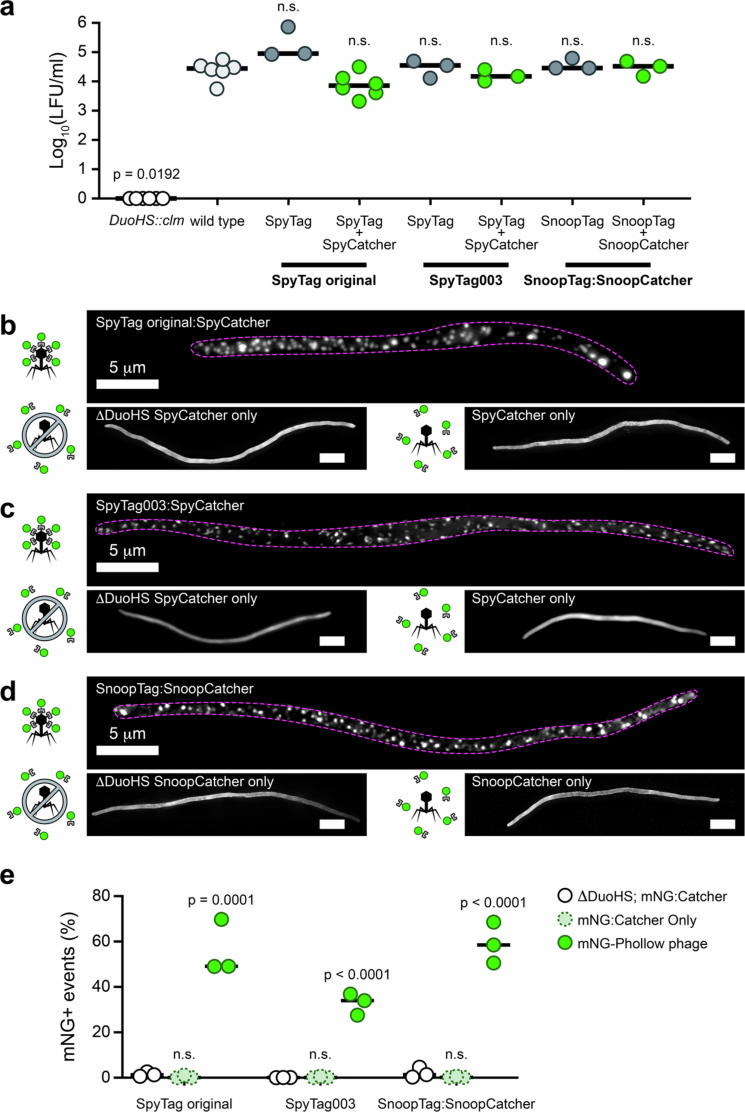
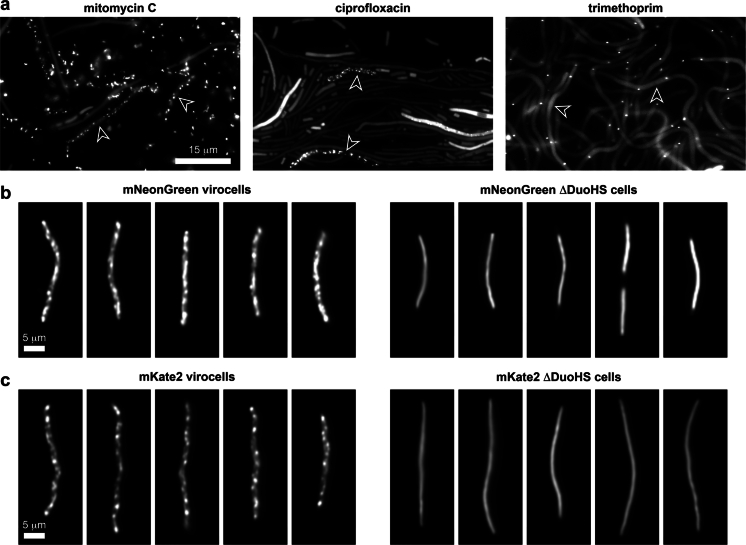
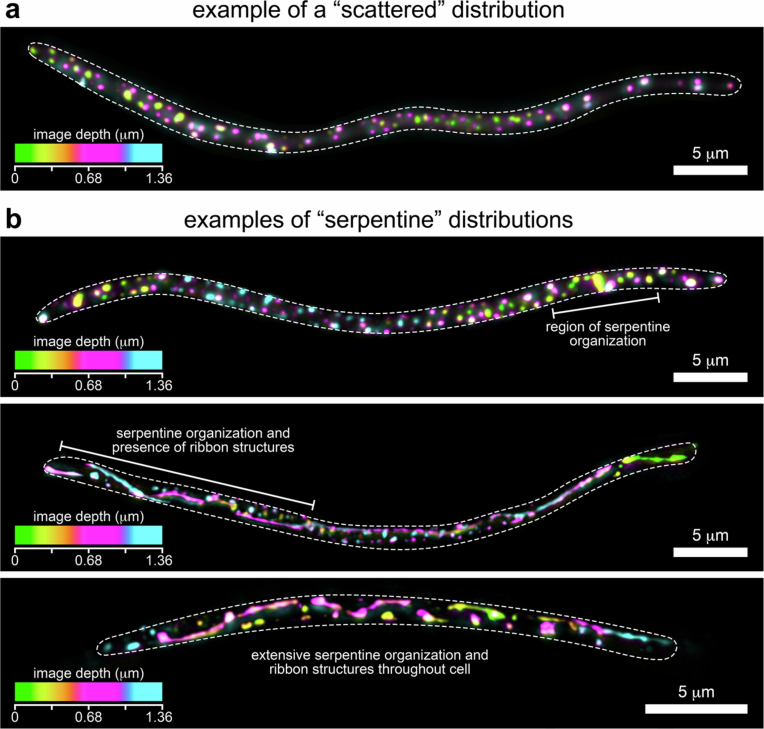
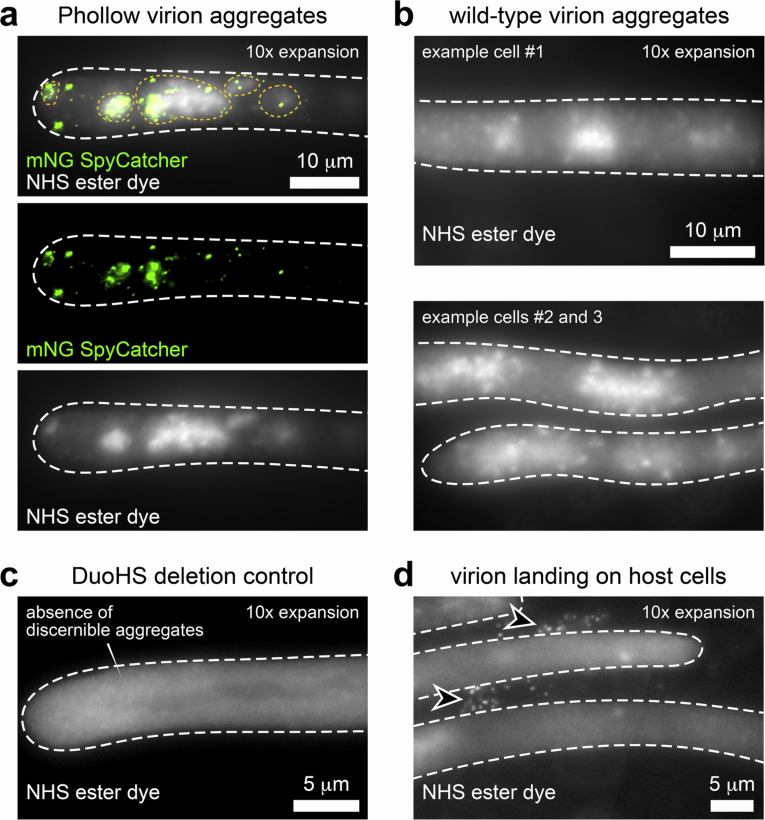
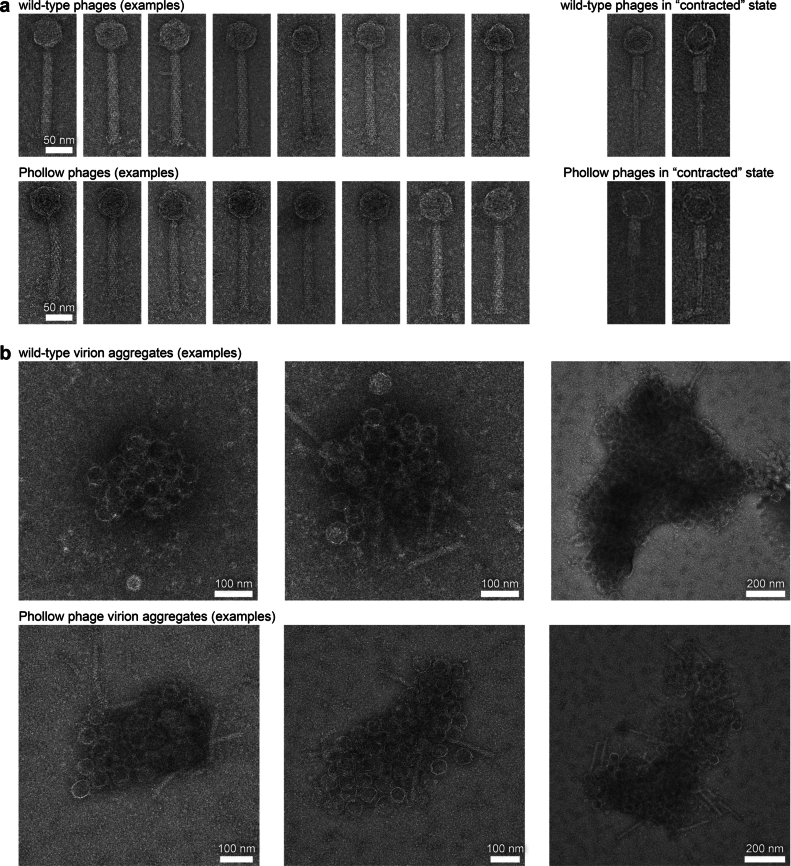
Bacteriophages show promise for microbiome engineering, but studying their transmission dynamics in multimember communities and animal hosts is technically challenging. We therefore created 'Phollow', a live imaging-based approach for tracking phage replication and spread in situ with single-virion resolution. Following interbacterial phage transmission is achieved by marking virions with distinct fluorescent proteins during assembly in newly infected cells. In vitro cell virology studies revealed clouds of phage virions dispersing upon bacterial lysis, leading to rampant transmission. Combining Phollow with optically transparent zebrafish, we visualized phage outbreaks within the vertebrate gut. We observed that virions from a zebrafish-derived Plesiomonas strain, but not a human-derived E. coli, rapidly disseminate systemically to the liver and brain. Moreover, antibiotics triggered waves of interbacterial transmission and sudden shifts in gut community ecology. Phollow ultimately empowers multiscale investigations of phage transmission and transkingdom interactions that have the potential to open new avenues for phage-based microbiome therapies.


Conflict of interest statement

Competing interests: The authors declare no competing interests.

Figures

Fig. 1
Fig. 1. Design, construction and infectivity of Phollow phages.
a, Design overview of Phollow phages using the SpyTag:SpyCatcher system. b, Cartoon schematic of phage tagging in vivo using Phollow. Phollow virocells treated with genotoxic antibiotics to induce lytic replication display hallmark morphological changes upon activation of the DNA damage ‘SOS’ response, namely, cell filamentation. As phage gene activation and replication proceed, fluorescent SpyCatcher proteins redistribute from the cytosol to sites of capsid assembly. Upon lysis, fluorescently tagged Phollow phage virions are released. c, Cartoon schematic of combinatorial Phollow tagging to track interbacterial phage transmission. d, Phollow phages display similar levels of infectivity compared to a wild-type DuoHS phage. The infectivity of wild-type and differentially marked Phollow phages was assessed by measuring lysogen-forming units (LFUs) generated from infection of an E. coli target cell. Lysogeny was monitored using prophages carrying a chloramphenicol resistance gene. DuoHS::clm is an E. coli HS strain that carries a chloramphenicol resistance marker in place of the DuoHS prophage genome and is used to control for phage-independent transfer of chloramphenicol resistance. Bars denote medians and circles represent independent biological replicates (DuoHS::clm, wild type, mNG: n = 6 each; AausFP1, mCitrine, mKate2, mTFP: n = 3 each). Significant differences compared to ‘wild type’ were determined using Kruskal–Wallis and Dunn’s multiple comparisons test (P < 0.05; NS, not significant).
Fig. 2
Fig. 2. Investigating the cell biology of phage lytic replication.
a, E. coli Phollow virocells in different phases of lytic replication: cell filamentation (left), virion assembly (middle), and cell lysis and release of viral particles (right). DNA from the lysing cell is labelled with the cell-impermeable DNA dye EthD-III (magenta). b, Representative induction curve of DuoHS phage lytic replication in E. coli HS. Shown are changes in optical density of cultures containing wild-type (black line) or a DuoHS prophage-cured strain (∆DuoHS, grey line). Lines represent averages and shaded regions represent the minimum and maximum of 3 technical replicates. c, Imaging flow cytometry gating scheme for quantifying cells harbouring lytically replicating Phollow phages (marked by magenta box and hashed line). PIV, pixel intensity variance. d, Imaging flow cytometry-based quantification of lytic replication over time. Lines represent averages and shaded regions represent minimum and maximum of 3 biological replicates. e, Z-projected image of a bacterial cell harbouring viral foci, pseudo-coloured according to z-depth. White dashed line marks the cell perimeter. f, 3D rendering of the cell shown in e. (i) large virion aggregates. (ii) single virions (arrowhead). Histogram shows aggregate sizes based on 2D surface areas (n = 357 aggregates from 5 cells). g, ExM image of unmodified wild-type DuoHS virions. h, ExM image of a DuoHS Phollow virion labelled with an mNeonGreen (mNG) SpyCatcher peptide. i, Top: ExM image of an E. coli cell containing unmodified lytically replicating wild-type DuoHS phage. Amber dashed outlines indicate virion aggregates. Bottom: an enlarged image of the small virion aggregate, highlighting virion morphologies. j, Representative TEM micrographs of unmodified wild-type (left) and Phollow phage (right) virions. This experiment was independently replicated at least twice with similar results. k, TEM micrographs of 2 example extracellular virion aggregates of unmodified wild-type DuoHS phages. Cartoons diagram capsid and tail components within each aggregate. The surface area (s.a.) of each aggregate was estimated on the basis of the area encompassing discernible capsid structures. This experiment was independently replicated at least twice with similar results. l, Time-lapse images showing the induction, assembly and dispersal of virions and aggregates upon cell lysis. Right inset: black arrowheads mark single virions and small aggregates; green arrowheads mark large virion aggregates.
Fig. 3
Fig. 3. Monitoring virion dispersal by fluorescence microscopy and flow virometry.
a, Maximum intensity projection image of MMC-induced Phollow virocells before (top) and after a lysis (bottom). Green arrowheads indicate cells that give rise to membrane vesicles containing virion aggregates and cytosolic SpyCatcher protein. b, Top: MMC-induced cultures of E. coli carrying ‘dark’ Phollow phages. Membrane and DNA staining reveals numerous membrane vesicles that frequently contain DNA (green arrowheads). Bottom: purified lysates show fewer vesicles and contain discernible virion-sized DNA-positive puncta. c, Gating strategy for quantifying Phollow phage virions in purified lysates by flow virometry. d, Representative flow virometry plots showing gates for AausFP1 (left) and mKate2 (right) Phollow phage virions. e, Representative flow virometry plot showing the quantification of Phollow phage virions from a mixed lysate. f, Fluorescence microscopy-based quantification of Phollow phage virion production in response to treatment with the genotoxic antibiotics mitomycin C (left), ciprofloxacin (middle) or trimethoprim (right). Antibiotic concentrations are given relative to each antibiotic’s MIC against wild-type E. coli HS. Bars indicate medians and interquartile ranges. Circles represent distinct and non-overlapping fields of view; data were pooled from 3 biological replicates. Data for the ‘0’ concentration is the same for all plots and sets a statistical baseline. Statistical groupings (denoted by letters and colour coding) in each plot were determined using Kruskal–Wallis and Dunn’s multiple comparisons test (P= 0.0001). g, Flow virometry-based quantification of Phollow phage virion production induced by mitomycin C (MMC, 0.1× MIC), ciprofloxacin (Cip, 0.5× MIC) or trimethoprim (Tri, 0.5× MIC). Bars indicate medians derived from 3 biological replicates (circles). No statistical differences were found using Kruskal–Wallis and Dunn’s multiple comparisons test (P= 0.8286).
Fig. 4
Fig. 4. Visualizing outbreaks of phage lytic replication within the vertebrate gut.
a, Top: larval zebrafish schematic. Bottom: maximum intensity projection of a larval zebrafish colonized by E. coli. Inset: image showing luminal E. coli aggregates (arrowhead). DNA (magenta) and actin (purple) highlight intestinal structure. b, Bacterial colonization and antibiotic induction timeline. ‘Tri’, trimethoprim. c, (i) Maximum intensity projection image of untreated E. coli Phollow virocells within the gut (white arrowhead). (ii,iii) Maximum intensity projection images of trimethoprim-treated E. coli Phollow virocell populations. White arrowheads mark bacterial aggregates and single cells; black arrowheads mark viral particles. d, Maximum intensity projection image showing viral particles in the oesophageal region. White arrowhead marks a single cell; black arrowhead marks viral particles. e, Fluorescence microscopy images of water samples from untreated (left) or trimethoprim-treated (right) zebrafish. f, Quantification of infectious virions from intestinal tissues (left) and water (right) post-trimethoprim treatment (cyan circles). Infectious virions from untreated samples are in grey. Bars indicate medians and interquartile ranges. Statistical groupings (denoted by letters) determined using Kruskal–Wallis and Dunn’s multiple comparisons test (intestines: P = 0.0001; water: P = 0.0002). g, Maximum intensity projection image showing viral particles derived from Plesiomonas Phollow virocells within the intestine. White arrowhead marks a single cell; black arrowhead marks viral particles. h, Maximum intensity projection image showing viral particles within enteroendocrine cells (EEC, green). Black arrowheads mark EECs containing viral particles or debris. Inset: cartoon representation of viral particles associating with an EEC. i, Left: maximum intensity projection image showing viral particles associating with hepatocytes. White arrowhead marks virions within a vesicle-like structure; black arrowhead marks a virion aggregate or single phage. Inset: cartoon representation of viral particles associating with hepatocytes. Right: montage shows liver tissue from a separate fish stained to highlight lipid droplets (green). j, Maximum intensity projection image showing viral particles within a blood vessel in the brain. White arrowhead marks a nucleated red blood cell; black arrowhead marks virions or phage debris associating with the surface of blood cells. Inset: cartoon representation of viral particles associating with red blood cells.
Fig. 5
Fig. 5. Tracing interbacterial phage transmission in vitro.
a, Maximum intensity projection image of a mixed culture containing mNeonGreen, mKate2 and mTFP E. coli Phollow virocells treated with MMC. Green (mNeonGreen), magenta (mKate2) and cyan (mTFP) arrowheads indicate cells harbouring lytically replicating Phollow phage. b, Maximum intensity projection image of purified mNeonGreen, mKate2 and mTFP Phollow phage virions. Green (mNeonGreen), magenta (mKate2) and cyan (mTFP) arrowheads indicate each of the Phollow phage types. c, Maximum intensity projection images of mNeonGreen Phollow phage virions binding to mKate2 ∆DuoHS E. coli target cells. d, Diagram of three-member community (left) and MMC induction scheme (right) for imaging interbacterial phage transmission. e, Left: maximum intensity projection image of the three-member community diagrammed in d following MMC treatment. Green and magenta arrowheads indicate Phollow virocells harbouring lytically replicating phage. Right: insets showing mNG (i,ii), mKate2 (iii,iv) and mTFP (v,vi) Phollow phage landing on each bacterial community member. f, Diagram of two-member community for tracing interbacterial phage transmission dynamics. g, Left y axis: quantification of lytic replication in mNG virocells (green line) and mKate2 target cells (magenta line) by imaging flow cytometry. Right y axis: enumeration of lysogenized mKate2 target cells (purple line). Line represents the average and shaded regions indicate minimum and maximum of 3 biological replicates. h, Enumeration of community composition from g by differential plating. Data are presented as average relative abundances; bars indicate s.e.m. of 3 biological replicates.
Fig. 6
Fig. 6. Mapping spatiotemporal dynamics of phage replication regimes within the gut.
a, Bacterial colonization and antibiotic induction timeline. b, Enumeration of community composition by differential plating. Data are presented as average relative abundances; bars indicate s.e.m. of 3 biological replicates comprising 30 total fish at each timepoint and condition. c, Fluorescence microscopy images of AausFP1 virocell/mKate2 target cell gut communities at pre (top), 2 h post (middle) and 4 h post-trimethoprim treatment. Each image was taken from different zebrafish hosts. Black arrowheads in the middle image indicate areas containing lytically replicating phage. Due to how intestinal tissues were oriented during acquisition, images have been rotated to face anterior–posterior positions, cropped and placed on a black background, creating clipped edges in some panels. Bottom insets: AausFP1 virocell and mKate2 target cell channels shown separately to highlight degree of community mixing. d, Representative fluorescence microscopy image of a water sample at 4 h post-trimethoprim treatment. White arrowhead indicates a virion aggregate; black arrowhead indicates a single viral particle. e, Fluorescence microscopy images of AausFP1 virocell/mKate2 target cell gut communities before (top) and 2 h after (bottom) a second post-trimethoprim treatment. Each image is from different zebrafish hosts. f, Representative fluorescence microscopy image of a water sample 2 h after a second trimethoprim treatment. Magenta arrowhead indicates an mKate2 Phollow phage virion; green arrowhead indicates an AausFP1 Phollow phage virion.
Extended Data Fig. 1
Extended Data Fig. 1. Regulation of P2-like phage DuoHS replication modes.
(a) Pathway controlling DuoHS replication modes in response to genotoxic stress. DNA damage activates RecA, which mediates the cleavage of the LexA repressor protein. LexA controls the expression of genes within the SOS regulon by binding to operator sequences known as SOS boxes. The LexA-controlled tum gene becomes derepressed, which toggles lytic replication by inhibiting pro-lysogenic regulators. Bacterial mutants encoding a non-cleavable lexA allele (lexA(Ind-)) or lacking tum (∆tum) are unable to trigger lytic replication. (b) Disk diffusion tests visualizing SOS reporter activity across E. coli HS strains in response by MMC. MMC generated a zone of inhibition around the assay disk for each strain. However, only the wild-type and ∆tum strains displayed SOS reporter activity in cells adjacent to the zone of inhibition. The lexA(Ind-) mutant strain did not display SOS reporter activation. (c) Quantification of SOS reporter activity following a MMC pulse via flow cytometry. Histograms display the distribution of SOS reporter intensity in untreated (gray) and MMC-treated (green) cultures, with the green shaded area indicating strong reporter activity. The MMC pulse effectively induced SOS reporter activity in wild-type and ∆tum strains, but not the lexA(Ind-) mutant. (d) Representative induction (or ‘lysis’) curve of DuoHS lytic replication in E. coli HS. The optical density of cultures (at 600 nm) containing either wild-type (black line), ∆tum (gray line) or lexA(Ind-) (purple line) are shown. Lines represent the average and shaded regions represent the minimum and maximum from three technical replicates. MMC was washed from cultures at 2 h (hashed bar), which prevents interference of phage lytic replication. An abrupt drop in optical density of the wild-type culture at 4 h marks widespread lysis, which is not observed in ∆tum or lexA(Ind-) cultures. (e) Fluorescence microscopy images of wild-type, ∆tum, and lexA(Ind-) Phollow virocell strains 1 h post-MMC treatment. Wild-type cells show extensive filamentation and formation of viral foci (arrowhead), which are not displayed by ∆tum and lexA(Ind-) mutant strains. lexA(Ind-) cells do not exhibit cell filamentation due to an impaired SOS response.
Extended Data Fig. 2
Extended Data Fig. 2. Characterization of Phollow phage tagging variants.
(a) The infectivity of wild-type and different Phollow phage variants was assessed by measuring lysogen-forming units (LFU) generated from infection of an E. coli HS target cell cured of its resident DuoHS prophage. Lysogeny was monitored using prophages carrying a chloramphenicol resistance gene. DuoHS::clm is an E. coli HS strain that carries a chloramphenicol resistance marker in place of the DuoHS prophage genome and is used to control for phage-independent transfer of chloramphenicol resistance. Bars denote medians and each circle represents an independent biological replicate. Significant differences compared to ‘wild type’ were determined using a Kruskal-Wallis and Dunn’s multiple comparisons test (p < 0.05; n.s. = not significant). (b-d) Comparison of viral foci production and organization across Phollow phage variants: (b) SpyTag original:SpyCatcher; (c) SpyTag0003:SpyCatcher; (d) SnoopTag:SnoopCatcher. The top of each panel shows a representative maximum intensity projection image of viral foci organization within Phollow virocells capable of generating fully tagged Phollow phages (a dashed magenta line highlights the cell perimeter). The bottom left of each panel shows a representative maximum intensity projection image of Spy- or SnoopCatcher-based fluorescence in the absence of a DuoHS prophage (∆DuoHS). The bottom right of each panel shows a representative maximum intensity projection image of Spy- or SnoopCatcher-based fluorescence in the presence of a lytically replicating DuoHS that lacks a Spy- or SnoopTag, which is thus unlabeled. No viral foci form in the absence of a fully tagged Phollow phage. (e) Plot shows the functionality of each Phollow phage variant to be used for flow virometry. Data are presented as the percentage of mNeonGreen (mNG) positive events. Bars denote medians and statistical differences compared to the ‘∆DuoHS; mNG:catcher’ control strain within each variant group were determined by an ordinary one-way ANOVA using a Dunn’s multiple comparisons test (SpyTag original: p = 0.0001; SpyTag003: p = 0.0001; SnoopTag: p = 0.0001; n.s. = not significant; 3 biological replicates are shown for each condition).
Extended Data Fig. 3
Extended Data Fig. 3. Genotoxic antibiotics induce similar but distinct patterns of bacterial cell filamentation and viral foci production.
(a) Fluorescence microscopy images of mNeonGreen E. coli Phollow virocells treated with (left) mitomycin C, (middle) ciprofloxacin, or (right) trimethoprim. Widespread cell filamentation, a common response to genotoxic antibiotics, is seen in each condition along with the production of viral foci. However, each antibiotic induces different degrees of filamentation and frequencies of viral foci formation. Arrowheads in each image indicate examples of filamented cells containing viral foci. The image shown for mitomycin C was taken from a different field of view of the sample shown in Extended Data Fig. 1e ‘wild type’, and is shown for comparison. (b,c) Example flow cytometry images of (b) mNeonGreen or (c) mKate2 virocells containing viral foci induced by mitomycin C. Shown on the right of each panel are example flow cytometry images of ΔDuoHS control cells expressing each respective fluorescent Catcher peptide, which have also been treated with mitomycin C.
Extended Data Fig. 4
Extended Data Fig. 4. Examples of intracellular Phollow phage organization.
(a-b) Z-projected images of bacterial cells harboring viral foci. Images highlight two patterns of virion organization throughout the intracellular space: (a) a scattered distribution and (b) a serpentine pattern with the presence of ribbon structures. Images are pseudo-colored according to z-depth, representing a total of 1.36 μm. A white dashed line marks the cell perimeter.
Extended Data Fig. 5
Extended Data Fig. 5. Expansion microscopy (ExM) of intracellular virion aggregates.
(a) ExM image showing a single E. coli Phollow virocell containing lytically replicating mNeonGreen (mNG) Phollow phage. A white dashed line in each image marks the bacterial cell envelope. The top image is a merge of the mNG (phage capsid, green) and N-Hydroxysuccinimide (NHS) ester dye (protein, grayscale) channels. The middle and bottom images show each individual channel. Amber dashed outlines in the top image indicate putative multi-virion aggregates. (b) ExM images showing additional examples of E. coli cells containing lytically replicating unmodified wild-type DuoHS phage. White dashed lines in each image mark the bacterial cell envelope. (c) ExM image showing an E. coli cell in which the DuoHS prophage has been deleted. The cell was treated with mitomycin C to simulate induction of lytic replication. The cell does not display virion aggregate-like structures. A white dashed line marks the bacterial cell envelope. (d) ExM image showing unmodified wild-type DuoHS virions landing on the surface of E. coli cells. White dashed lines mark the bacterial cell envelope.
Extended Data Fig. 6
Extended Data Fig. 6. Transmission electron microscopy (TEM) of negatively stained DuoHS virions and virion aggregates.
(a) Representative TEM micrographs of unmodified wild-type (top) and mNeonGreen Phollow phage virions (bottom). Also included are example virions of each phage with contracted tail sheaths, which is further evidence that Phollow phage virions are functional and competent for infection. Experiment was independently replicated at least twice with similar results. (b) TEM micrographs of extracellular virion aggregates from unmodified wild-type DuoHS (top) and mNeonGreen Phollow phage (bottom). Experiment was independently replicated at least twice with similar results.
Extended Data Fig. 7
Extended Data Fig. 7. Determination of minimum inhibitory concentrations of genotoxic antibiotics for E. coli HS.
(a-c) Optical density at 600 nm measurements of E. coli HS cultures in response to various concentrations of (a) MMC, (b) ciprofloxacin, and (c) trimethoprim. Data represent the average of three independent endpoint measurements after 24 hours of incubation at 37 °C, plotted as heatmaps. Arrowheads in each panel indicate the minimum inhibitory concentration (MIC), defined as the minimum concentration required to significantly impair bacterial growth without complete eradication.
Extended Data Fig. 8
Extended Data Fig. 8. Characterization of phage outbreaks within the vertebrate gut.
(a) Maximum intensity projection image showing viral particles derived from untreated E. coli HS Phollow virocells undergoing spontaneous phage lytic replication within the intestine. White arrowhead marks bacterial cells; black arrowhead marks viral particles. (b) Representative fluorescent microscopy images of AausFP1 E. coli HS Phollow virocell in zebrafish embryo media (EM) in the absence of fish. Bacteria were separated from fish immediately before the experiment to allow for the diffusion of fish-derived nutrients and other factors. Subsequently, bacteria were treated with trimethoprim (left) or trimethoprim and tricaine (right) and incubated at 28.5 °C for 4 h. Bacterial cells under these conditions do not display viral foci or signs of phage lytic replication (white arrowheads). Experiment was independently replicated at least four times with similar results. (c) Maximum intensity projection images of MMC-induced Plesiomonas Phollow virocells. Each panel shows a representative image of fluorescent viral foci production and organization, which are similar to those in E. coli Phollow virocells. Magenta dashed lines mark the cell perimeter. (d) Alignment between P2-like prophage genomes of Plesiomonas (top) and E. coli HS (bottom). Regions of homology between the two genomes are based on percent amino acid identity (vertical gray bars), with an average genome-wide identity of 59%. The gene encoding the major capsid protein GpN, which was modified in each prophage with a Spy- or SnoopTag, is highlighted in amber. ‘Moron’ accessory regions are also indicated; ‘moron 2’ (magenta arrow) is the site where a chloramphenicol resistance gene was inserted to enable quantification of lysogen-forming units.
Extended Data Fig. 9
Extended Data Fig. 9. Plesiomonas SpyCatcher control strains do not produce viral-like particles that accumulate within EECs or extraintestinal tissues.
Plesiomonas SpyCatcher control strains were used to colonize germ-free larval zebrafish and treated with trimethoprim as diagrammed in Fig. 4b. At 4 h post-treatment, (a) EECs, (b) livers, and (c) brains were imaged as in Fig. 4h–i. For each cell/tissue, four examples are shown from different animals. In (a) and (c), fluorescent SpyCatcher signal is not found within EECs or the brain, respectively. In (b), much of the SpyCatcher signal is from autofluorescent structures in the liver but may also reflect some translocation of SpyCatcher protein from the gut.
Extended Data Fig. 10
Extended Data Fig. 10. Characterization of interbacterial interactions and community spatial organization during antibiotic-induced phage outbreaks within the gut.
(a) Determination of possible fitness tradeoffs resulting from the expression of mKate2 or AausFP1 catcher peptides. Two-member gut communities comprising wild-type E. coli HS virocells and ΔDuoHS E. coli HS target cells were assembled as diagrammed in Fig. 6a. The community represented by the plot on the left contains AausFP1 virocells and mKate2 target cells and was established and quantified as in Fig. 6b ‘Day 6, untreated’. The community represented by the plot on the right contains mKate2 virocells and AausFP1 target cells. Data are presented as average relative abundances; bars indicate standard error of the mean (SEM) from 2 biological replicates comprising 20 total fish in each condition. (b) Three-member communities containing differentially tagged wild-type E. coli HS virocells (left) or ΔDuoHS E. coli HS target cells (right) show the intrinsic spatial organization of bacteria within the larval zebrafish gut. Bacterial strains in each panel were engineered to constitutively express either mNG, mKate2, or mTFP. Animals were colonized with each community for two days starting on day 4-post fertilization prior to imaging. (c,d) Fluorescent microscopy images of two-member virocell (c) or target cell (d) gut communities prior to and 4 h post-trimethoprim treatment. A single representative image is shown for the pre-treatment time point and three example images from different zebrafish hosts are shown for the 4 h time point. Due to how intestinal tissues were oriented during acquisition, images have been rotated, cropped, and placed on a black background, creating clipped edges in some panels.

Similar articles

References

    1. Breitbart, M., Bonnain, C., Malki, K. & Sawaya, N. A. Phage puppet masters of the marine microbial realm. Nat. Microbiol.3, 754–766 (2018). - PubMed
    1. Chevallereau, A., Pons, B. J., van Houte, S. & Westra, E. R. Interactions between bacterial and phage communities in natural environments. Nat. Rev. Microbiol.20, 49–62 (2022). - PubMed
    1. Dion, M. B., Oechslin, F. & Moineau, S. Phage diversity, genomics and phylogeny. Nat. Rev. Microbiol.18, 125–138 (2020). - PubMed
    1. Correa, A. M. S. et al. Revisiting the rules of life for viruses of microorganisms. Nat. Rev. Microbiol.19, 501–513 (2021). - PubMed
    1. Howard-Varona, C., Hargreaves, K. R., Abedon, S. T. & Sullivan, M. B. Lysogeny in nature: mechanisms, impact and ecology of temperate phages. ISME J.11, 1511–1520 (2017). - PMC - PubMed