

A molecular brain atlas reveals cellular shifts during the repair phase of stroke
- PMID: 40251566
- PMCID: PMC12008922
- DOI: 10.1186/s12974-025-03437-z
A molecular brain atlas reveals cellular shifts during the repair phase of stroke
Abstract
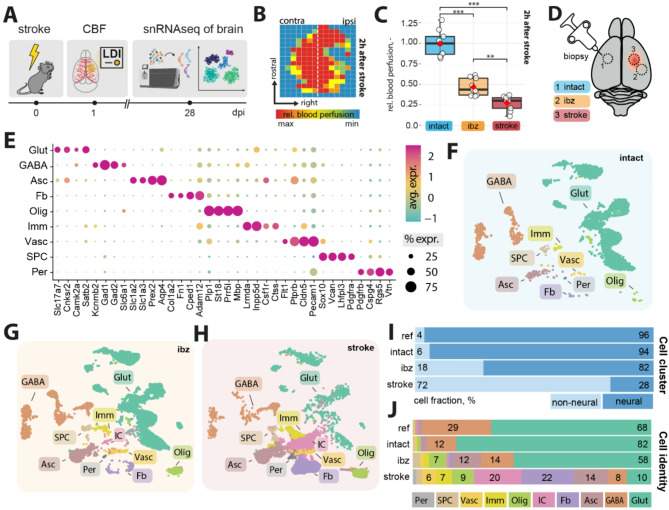
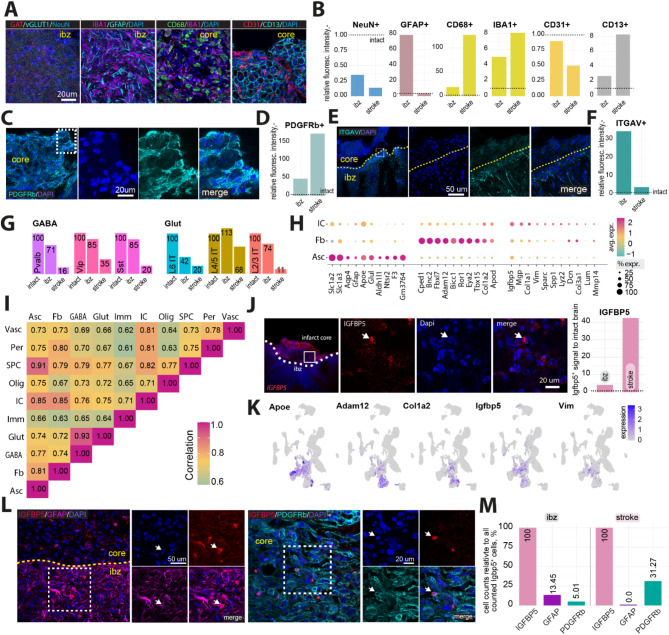
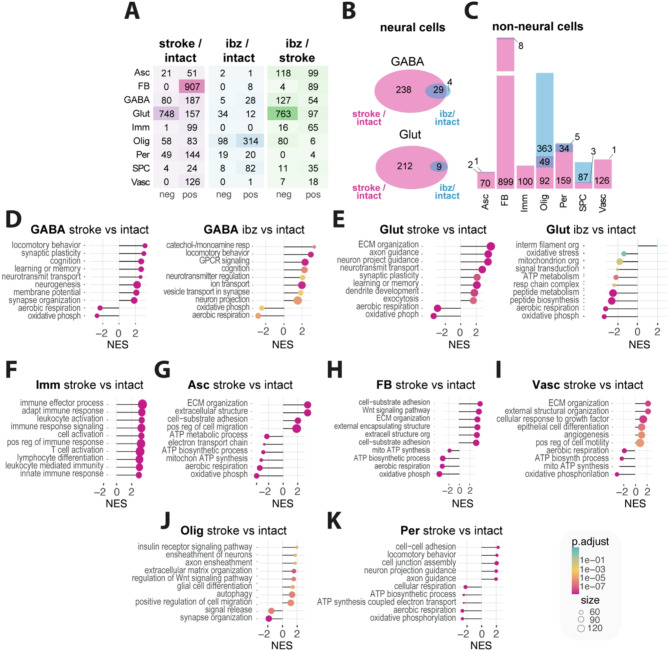
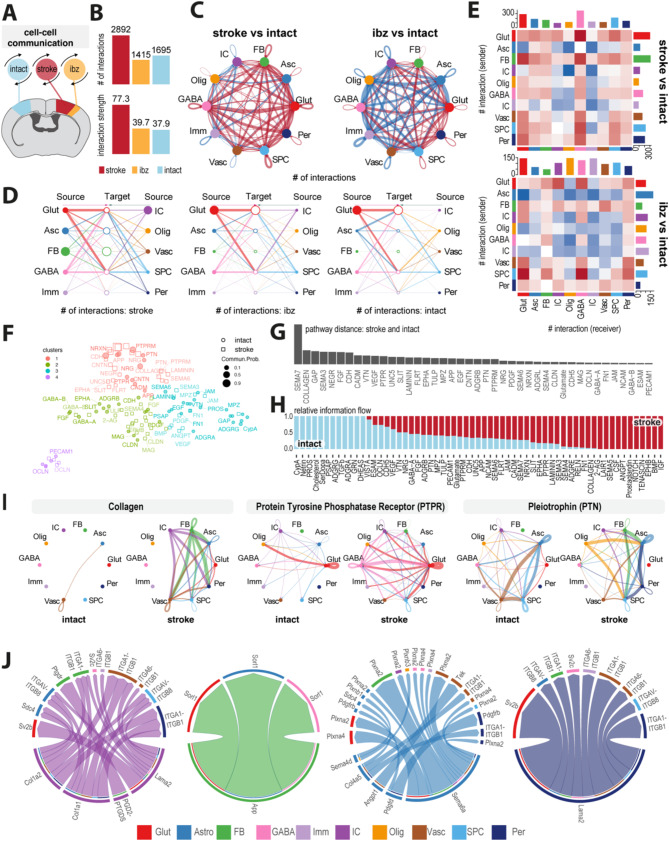
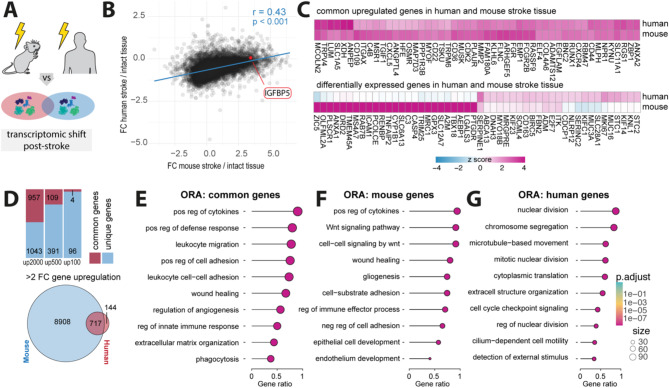
Ischemic stroke triggers a cascade of pathological events that affect multiple cell types and often lead to incomplete functional recovery. Despite advances in single-cell technologies, the molecular and cellular responses that contribute to long-term post-stroke impairment remain poorly understood. To gain better insight into the underlying mechanisms, we generated a single-cell transcriptomic atlas from distinct brain regions using a mouse model of permanent focal ischemia at one month post-injury. Our findings reveal cell- and region-specific changes within the stroke-injured and peri-infarct brain tissue. For instance, GABAergic and glutamatergic neurons exhibited upregulated genes in signaling pathways involved in axon guidance and synaptic plasticity, and downregulated pathways associated with aerobic metabolism. Using cell-cell communication analysis, we identified increased strength in predicted interactions within stroke tissue among both neural and non-neural cells via signaling pathways such as those involving collagen, protein tyrosine phosphatase receptor, neuronal growth regulator, laminin, and several cell adhesion molecules. Furthermore, we found a strong correlation between mouse transcriptome responses after stroke and those observed in human nonfatal brain stroke lesions. Common molecular features were linked to inflammatory responses, extracellular matrix organization, and angiogenesis. Our findings provide a detailed resource for advancing our molecular understanding of stroke pathology and for discovering therapeutic targets in the repair phase of stroke recovery.
© 2025. The Author(s).
Conflict of interest statement
Declarations. Ethics approval and consent to participate: All in vivo experiments were performed at the Laboratory Animal Services Center (LASC) in Schlieren, Switzerland according to the local guidelines for animal experiments and were approved by the Veterinary Office of the Canton Zurich in Switzerland (Protocol number 209/2019). Competing interests: The authors declare no competing interests.
Figures
Update of
-
A molecular brain atlas reveals cellular shifts during the repair phase of stroke.bioRxiv [Preprint]. 2024 Aug 22:2024.08.21.608971. doi: 10.1101/2024.08.21.608971. bioRxiv. 2024. Update in: J Neuroinflammation. 2025 Apr 18;22(1):112. doi: 10.1186/s12974-025-03437-z. PMID: 39229128 Free PMC article. Updated. Preprint.
Similar articles
-
A molecular brain atlas reveals cellular shifts during the repair phase of stroke.bioRxiv [Preprint]. 2024 Aug 22:2024.08.21.608971. doi: 10.1101/2024.08.21.608971. bioRxiv. 2024. Update in: J Neuroinflammation. 2025 Apr 18;22(1):112. doi: 10.1186/s12974-025-03437-z. PMID: 39229128 Free PMC article. Updated. Preprint.
-
EphB2-dependent signaling promotes neuronal excitotoxicity and inflammation in the acute phase of ischemic stroke.Acta Neuropathol Commun. 2019 Feb 5;7(1):15. doi: 10.1186/s40478-019-0669-7. Acta Neuropathol Commun. 2019. PMID: 30722785 Free PMC article.
-
Optogenetic stimulation of glutamatergic neuronal activity in the striatum enhances neurogenesis in the subventricular zone of normal and stroke mice.Neurobiol Dis. 2017 Feb;98:9-24. doi: 10.1016/j.nbd.2016.11.005. Epub 2016 Nov 21. Neurobiol Dis. 2017. PMID: 27884724 Free PMC article.
-
Activation of endothelial ras-related C3 botulinum toxin substrate 1 (Rac1) improves post-stroke recovery and angiogenesis via activating Pak1 in mice.Exp Neurol. 2019 Dec;322:113059. doi: 10.1016/j.expneurol.2019.113059. Epub 2019 Sep 6. Exp Neurol. 2019. PMID: 31499064 Free PMC article. Review.
-
Reactive astrogliosis in stroke: Contributions of astrocytes to recovery of neurological function.Neurochem Int. 2017 Jul;107:88-103. doi: 10.1016/j.neuint.2016.12.016. Epub 2017 Jan 3. Neurochem Int. 2017. PMID: 28057555 Review.
Cited by
-
The blood-brain barrier: a help and a hindrance.Brain. 2025 Jul 7;148(7):2262-2282. doi: 10.1093/brain/awaf068. Brain. 2025. PMID: 39969549 Free PMC article. Review.
-
Angiogenic Cell Precursors and Neural Cell Precursors in Service to the Brain-Computer Interface.Cells. 2025 Jul 29;14(15):1163. doi: 10.3390/cells14151163. Cells. 2025. PMID: 40801596 Free PMC article. Review.
-
How neural stem cell therapy promotes brain repair after stroke.Stem Cell Reports. 2025 Jun 10;20(6):102507. doi: 10.1016/j.stemcr.2025.102507. Epub 2025 May 22. Stem Cell Reports. 2025. PMID: 40409262 Free PMC article. Review.
References
-
- Tsao CW, et al. Heart Disease and Stroke Statistics-2023 Update: A Report From the American Heart Association. Circulation. 2023;147:e93–621. - PubMed
MeSH terms
Grants and funding
LinkOut - more resources
Full Text Sources
Medical
