. 2025 Apr 18;31(1):142.
doi: 10.1186/s10020-025-01201-w.

HLA-F regulates the proliferation of trophoblast via PKM2-dependent glycolysis in the pathogenesis of preeclampsia

Affiliations

HLA-F regulates the proliferation of trophoblast via PKM2-dependent glycolysis in the pathogenesis of preeclampsia

Ruiling Xu et al. Mol Med. .

Abstract

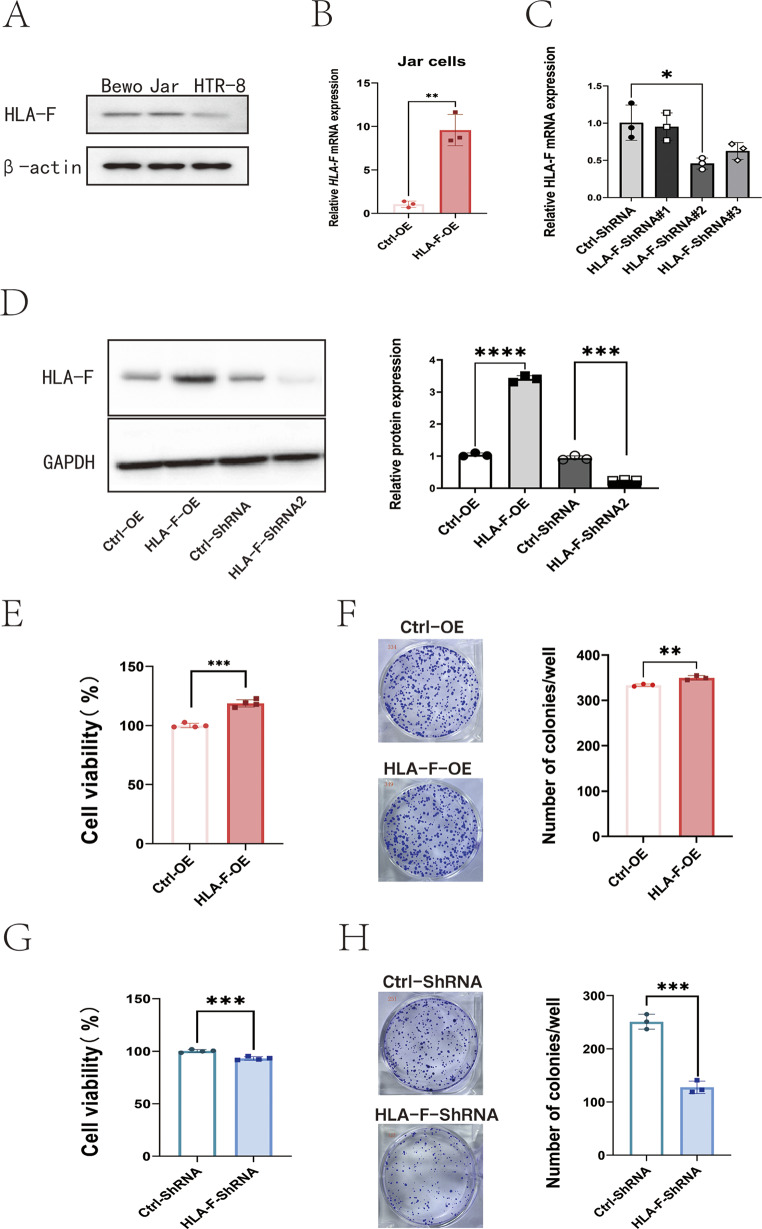
Background: The regulatory molecule Human Leukocyte Antigen F (HLA-F) has been implicated in trophoblast proliferation during pregnancy, and reduced levels of this antigen have been identified in trophoblast cells of patients with preeclampsia. This study aimed to analyze the effect and mechanism of HLA-F on the proliferation of trophoblast and the underlying mechanism of reduced HLA-F involved in preeclampsia.

Methods: q-PCR, Western blot (WB), and Immunohistochemistry (IHC) were used to detect the expression of HLA-F and Pyruvate Kinase Muscle isoform 2 (PKM2) in placenta tissues. Jar cells were transfected with overexpression lentivirus, specific siRNA, and shRNA to regulate corresponding genes. Immunofluorescence was used to analyze the expression and distribution of HLA-F and PKM2. Extracellular and intracellular lactate, pyruvate, and enzymatic activity of PKM2 were measured using the corresponding assay kits. Cell proliferation was measured by CCK8, MTT, colony formation assay, and Mini patient-derived xenograft (Mini-PDX). Chromatin Immunoprecipitation and deep sequencing (ChIP-seq) and 4-dimensional label-free quantitative proteomics (4D-LFQP-LA) were used to analyze the HLA-F-binding DNA sequences and the differential lactylation proteins in HLA-F-overexpression Jar and its control.

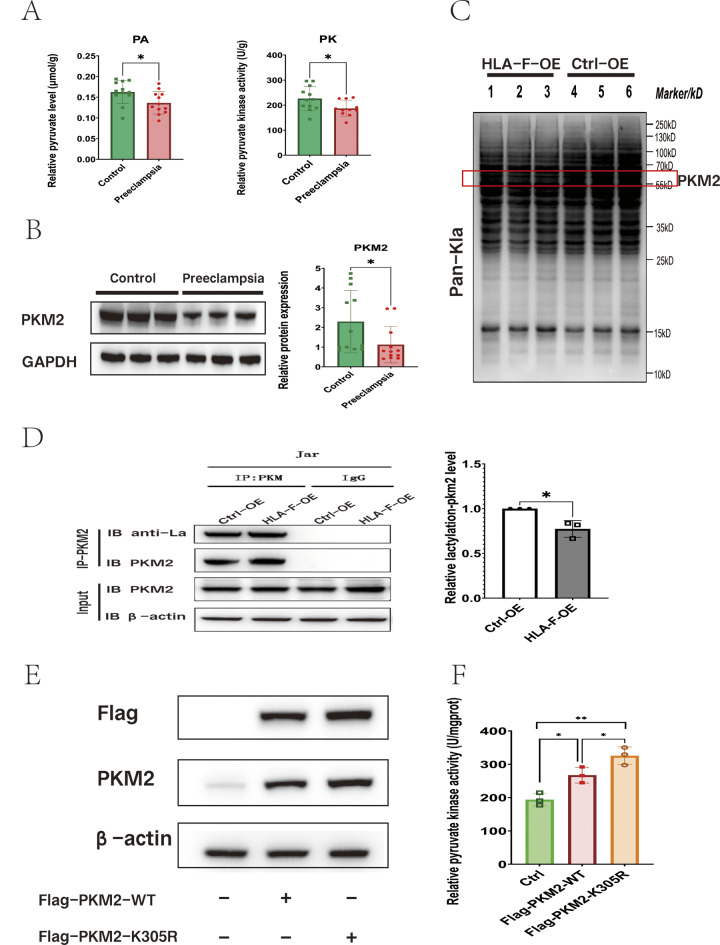
Results: The expression of HLA-F is reduced in extravillous trophoblast and villous cytotrophoblast from patients with preeclampsia. Over-expression of HLA-F promoted proliferation while under-expression inhibited it. Further experiments demonstrated that over-expression of HLA-F promoted expression of the PKM2 protein and its enzymatic activity, resulting in enhanced glycolysis in Jar cells. Specifically, we determined that HLA-F regulated the expression of PKM2 by binding the promoter of PKM, and promoted PKM2 enzyme activity by down-regulating the lactylation of residue K305. Moreover, silencing PKM2 with siRNA reduced HLA-F-mediated glycolysis and proliferation in HLA-F-overexpressing Jar cells. Finally, we corroborated these results using a MiniPDX model, with which we confirmed that the PKM2 agonist TEPP-46 promoted the proliferation of ShHLA-F Jar cells.

Conclusions: The reduced expression of HLA-F in placental trophoblast cells resulted in the downregulation of both PKM2 transcription and protein expression. Concurrently, the relative upregulation of lactylation at PKM2 K305 contributed to a decline in enzyme activity, further exacerbating glycolysis dysfunction. Collectively, these alterations led to a suppression of trophoblast proliferation capacity and involvement in the pathogenesis of preeclampsia.

Keywords: HLA-F; Lactylation; PKM2; Preeclampsia; Proliferation; Trophoblast.


Conflict of interest statement

Declarations. Ethics approval and participation consent: The study protocol was approved by the Ethics Committee of Sichuan Provincial People’s Hospital (No. 2022 − 311). All participants signed the informed consent. Consent for publication: All authors provided consent for publication. Competing interests: The authors declare no competing interests.

Figures

Fig. 1
Fig. 1
The expression of HLA-F was lower in trophoblast cells from the placenta of patients with preeclampsia. (A) HLA-F immunostaining of EVT of the placenta bed from tissues taken from patients with preeclampsia (n = 12) and normal term controls (n = 12). Three EVT cells were randomly selected by investigators blinded to the patient group, and Image-J software was used to measure the %Area value of the cells. The mean value of %Area of 3 EVT cells was used to represent the staining intensity of HLA-F expression in the sample EVT. Statistical analysis showed that HLA-F expression was lower in EVT in the preeclampsia group compared to controls. (B) qPCR confirmed that the relative mRNA expression of HLA-F in the placenta of preeclampsia patients (n = 12) was significantly lower than in normal term controls (n = 12). (C) Western blot analysis demonstrated that the relative protein expression of HLA-F in the placenta of preeclampsia patients (n = 12) was significantly lower than in normal term control (n = 12). Asterisks indicate significant differences (ns: no significance, *p < 0.05, **p < 0.01, ***p < 0.001)
Fig. 2
Fig. 2
HLA-F promotes Jar cell proliferation. (A) Western blot showing the protein expression of HLA-F in BeWo, Jar, and Htr8/SVneo cell lines. (B) qPCR confirmed that the relative expression of HLA-F mRNA was significantly higher in Jar cells transfected with an HLA-F–overexpressing lentivirus (HLA-F-OE) compared to cells transfected with the control lentivirus (Ctrl-OE). (C) Western blot demonstrated that the relative protein expression was also significantly up-regulated in the HLA-F-OE group. (D) MTT assay indicated that the viability of Jar cells in the HLA-F-OE group was significantly higher than in the Ctrl-OE group. (E) Colony formation assay revealed that the number of colonies was significantly higher in the HLA-F-OE group than in the Ctrl-OE group. (F) Jar cells were transfected with either ctrl-siRNA or HLA-F-siRNA, and the relative expression of HLA-F mRNA was assessed by qPCR. Transfection with the #2 HLA-F siRNA target gene sequence significantly decreased expression of HLA-F mRNA. (G) Western blot confirmed that HLA-F protein expression was significantly suppressed in Jar cells transfected with the #2 HLA-F siRNA target gene sequence. (H) MTT assay demonstrated that the viability of Jar cells in the siRNA-HLA-F group was significantly lower than in the siRNA-Ctrl group. (I) Colony formation assay showed that the number of colonies was significantly lower in the siRNA-HLA-F group than in the siRNA-Ctrl group. Three replicates were used for each experiment. Data are expressed as mean ± SD. A line connects the pairs of groups that were significantly different from each other, and T-tests were used for comparison between the two groups. Asterisks indicate significant differences (ns: no significance, *p < 0.05, **p < 0.01, ***p < 0.001)
Fig. 3
Fig. 3
Upregulated expression of HLA-F results in enhanced glycolysis and PKM2 enzyme activity in Jar cells. (A) Immunofluorescence staining revealed the cytoplasmic and nuclear distribution of PKM2 in HLA-F–overexpressing Jar cells (HLA-F-OE group) and control Jar cells (Ctrl group) under normal oxygen culture. The nuclei were stained with DAPI (blue) and the PKM2 was labeled and visualized using a green fluorescent marker. The line charts represent fluorescence intensity (gray value), corresponding to the green signal (PKM2) and the blue signal (DAPI) were measured and plotted along the designated distance from α to γ. (B) Analysis of mean fluorescence intensity (MFI) of HLA-F and PKM2 protein expression in Jar cells from the HLA-F-OE group and Ctrl group under normoxic conditions at 24 and 72 h. After 24 h of normal oxygen culture, the expression of HLA-F and PKM2 proteins was significantly higher in the HLA-F-OE group than in the Ctrl group. **p < 0.05. (C) MFI of HLA-F and PKM2 protein expression in the two groups of Jar cells at 24 and 72 h under hypoxic conditions; HLA-F and PKM2 protein expression was significantly higher in the HLA-F-OE group than in the Ctrl group after 24 and 72 h of hypoxic culture. (D) A line chart depicting the cytoplasmic and nuclear distribution of PKM2 in the HLA-F-OE group and Ctrl group under hypoxic culture. The line charts represent fluorescence intensity (gray value), presenting the distance from α to γ. (E) A PK enzyme activity assay kit was used to assess the intracellular PKM enzyme activity of HLA-F-OE and Ctrl (NC) Jar cells after 24 h, 48 h, and 72 h of normoxic and hypoxic culture. Intracellular PKM enzyme activity was significantly higher in the HLA-F-OE group than in the Ctrl (NC) group. (F-G) Intracellular and extracellular content of lactic acid and pyruvate in HLA-F-OE and NC Jar cells as detected by ELISA after 24 h, 48 h, and 72 h of culture under normoxic and hypoxic conditions. Three replicates were used for each experiment. Data are expressed as mean ± SD. A line connects pairs of groups that were significantly different from each other, and T-tests were used for comparisons between the two groups. Asterisks indicate significant differences (ns: no significance, *p < 0.05, **p < 0.01, ***p < 0.001)
Fig. 4
Fig. 4
HLA-F induces PKM2 protein expression in Jar cells. (A) Western blot was used to detect the expression of PKM2 and HK2 proteins in Jar cells transfected with an HLA-F–overexpression lentivirus and/or HLA-F–interferon siRNA. PKM2 and HK2 protein expression were both significantly higher in the HLA-F-OE group than in the Ctrl-OE group, and both were significantly lower in the HLA-F–siRNA group than in the Ctrl-siRNA group. (B) In the ChIP-seq analysis of transcription factors with Input and IP, we used Input as the background and Macs2 for IP peak calling in narrow peak mode. The peak chart shows HLA-F_ peak reads in the PKM promoter region. (C) qPCR verified that PKM mRNA expression was significantly higher in Jar cells that overexpressed HLA-F and significantly lower in Jar cells in which HLA-F expression was suppressed. (D) Electrophoretic images of qPCR products generated from the chromatin precipitation from ChIP analyses (left). The %input value was calculated based on the CT values of IP and IgG and the input dilution ratio (right). Three replicates were used for each experiment. Data are expressed as mean ± SD. A line connects the pairs of groups that were significantly different from each other, and T-tests were used for comparison between the two groups. Asterisks indicate significant differences (ns: no significance, *p < 0.05, **p < 0.01, ***p < 0.001)
Fig. 5
Fig. 5
PKM2 is required for HLA-F–mediated proliferation and glycolysis. (A) Expression of PKM mRNA in HLA-F-OE Jar cells transfected with either PKM2 siRNA or ctrl siRNA, as detected by PCR. siRNA sequences 1–3 significantly decreased PKM mRNA expression. (B) Western blot revealed that PKM2 protein expression was significantly lower in HLA-F-OE Jar cells transfected with PKM2 siRNA, while HLA-F protein expression remained unchanged. (C) CCK8 assay indicated that the cell viability of HLA-F-OE Jar cells transfected with PKM2 siRNA was significantly lower than that of cells transfected with control siRNA. (D) Colony formation assay showed that the number of colonies of HLA-F-OE Jar cells was significantly lower when treated with siRNA-PKM2 than with siRNA-Ctrl. (E) PKM enzyme activity and the content of lactic acid and pyruvate were significantly reduced in HLA-F-OE Jar cells transfected with PKM2 siRNA than in cells transfected with control siRNA. Three replicates were used for each experiment. Data are expressed as mean ± SD. A line connects the pairs of groups that were significantly different from each other, and T-tests were used for comparison between the two groups. Asterisks indicate significant differences (ns: no significance, *p < 0.05, **p < 0.01, ***p < 0.001)
Fig. 6
Fig. 6
HLA-F is involved in suppressing the lactylation of PKM2 K305. (A) PKM enzyme activity and pyruvate content were significantly lower in placental tissues taken from patients with preeclampsia (n = 12) than in those from normal term controls (n = 12). (B) Results of Western blot illustrating that the relative protein expression of PKM2 was significantly reduced in placenta from patients with preeclampsia (n = 12) compared to that of normal term controls (n = 12). (C) Western blot results of the lactylation level of proteins extracted from HLA-F–overexpressing (HLA-F-OE) Jar cells or control-overexpression (Ctrl-OE) Jar cells using anti-lactyllysine (pan-kla). The red box contains the PKM2 protein. (D) The proteins from HLA-F-OE Jar cells or Ctrl-OE Jar cells were bound by a PKM2 antibody and lactylation was detected using an anti-lactyllysine antibody. The relative lactylation-PKM2 level was calculated based on an OD value of IP-PKM2-PKM2/IP-PKM2-anti-la. The Co-IP experiment was replicated three times. (E) Western blot of Jar cells transfected with a plasmid that overexpressed either PKM2-WT or PKM2-K305R. (F) PKM enzyme activity assay of Jar cells transfected with control, PKM2-WT–, or PKM2-K305R–overexpressing plasmid. Three replicates were used for each experiment. Data are expressed as mean ± SD. A line connects the pairs of groups that were significantly different from each other, and T-tests were used for comparison between the two groups. Asterisks indicate significant differences (ns: no significance, *p < 0.05, **p < 0.01, ***p < 0.001)

References

    1. Alquraishi M, Puckett DL, Dina S, Alani, Amal S, Humidat VD, Frankel DR, Donohoe. Jay Whelan, and Ahmed Bettaieb. ‘Pyruvate kinase M2: A simple molecule with complex functions’. Free Radic Biol Med. 2019;143:176–92. - PMC - PubMed
    1. Anastasiou D, Yu Y, Israelsen WJ, Jiang J-K, Boxer MB, Hong BS, Tempel W, Dimov S, Shen M, Jha A, Yang H, Mattaini KR, Metallo CM, Brian P, Fiske KD, Courtney S, Malstrom TM, Khan C, Kung AP Skoumbourdis, Henrike Veith, Noel Southall, Walsh MJ, Brimacombe KR, Leister W, Sophia Y, Lunt, Zachary R, Johnson KE, Yen K, Kunii SM, Davidson HR, Christofk CP Austin, James Inglese, Marian, Harris H, Asara JM, Stephanopoulos G, Salituro FG, Jin S, Dang L, Auld DS, Park H-W, Cantley LC, Thomas CJ. and Matthew G. Vander Heiden. ‘Pyruvate kinase M2 activators promote tetramer formation and suppress tumorigenesis’. Nature Chemical Biology. 2012;8:839– 47. - PMC - PubMed
    1. Bloxam DL, Bridget E, Bullen, Barry NJ, Walters, Lao TT. Placental Glycolysis and energy metabolism in preeclampsia. Am J Obstet Gynecol. 1987;157:97–101. - PubMed
    1. Braselmann H, Michna A, Heß J, Unger K. 2015. ‘CFAssay: statistical analysis of the colony formation assay’. Radiat Oncol, 10. - PMC - PubMed
    1. Buttura RV, Ramalho J, Lima ThálittaHA, Donadi EA, Luciana C, Veiga-Castelli CT, Mendes-Junior. and Erick C. Castelli. ‘HLA-F displays highly divergent and frequent haplotype lineages associated with different mRNA expression levels’. Hum Immunol. 2019;80:112–19. - PubMed

MeSH terms

LinkOut - more resources