

Single cell RNA sequencing after moderate traumatic brain injury: effects of therapeutic hypothermia
- PMID: 40251570
- PMCID: PMC12007139
- DOI: 10.1186/s12974-025-03430-6
Single cell RNA sequencing after moderate traumatic brain injury: effects of therapeutic hypothermia
Abstract
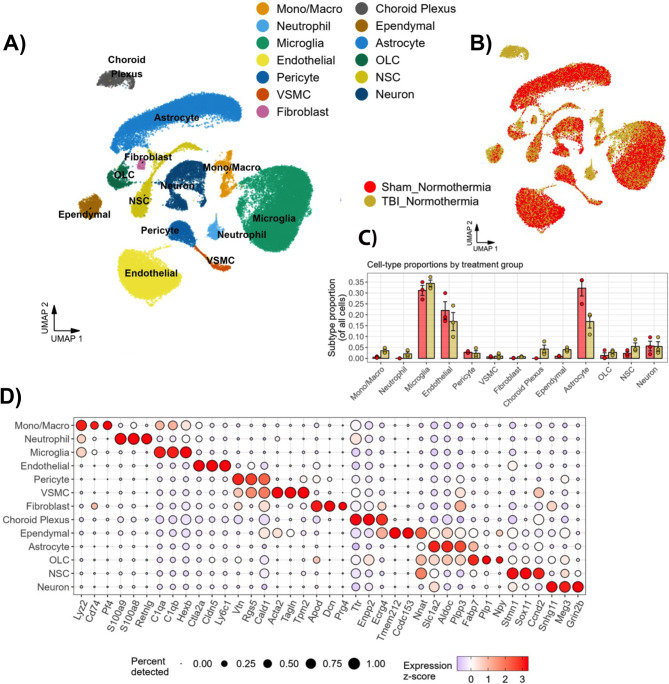
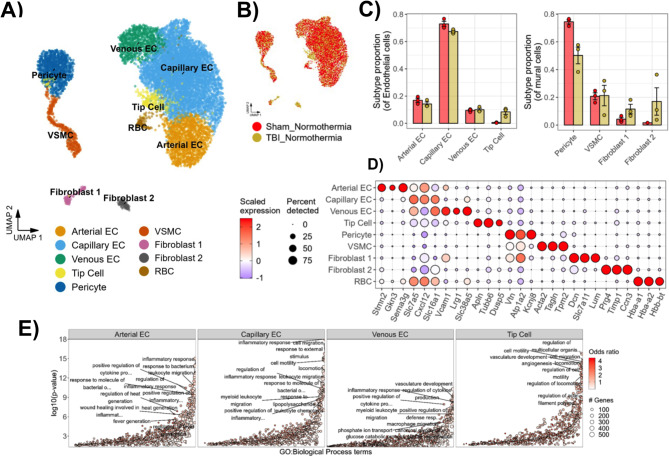
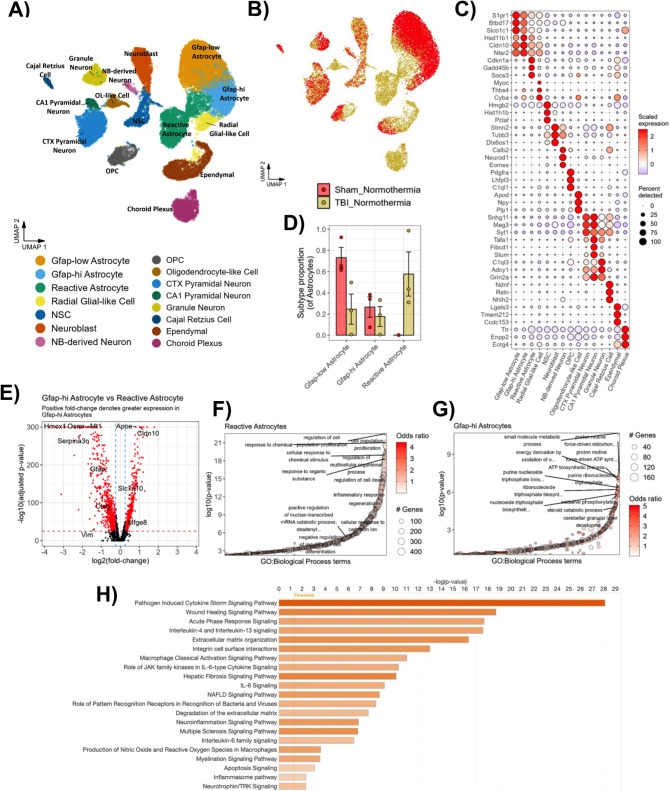
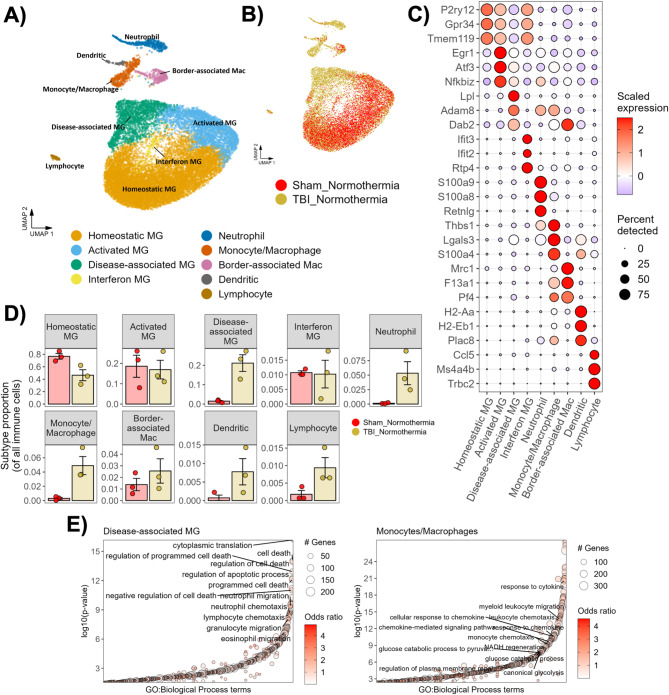
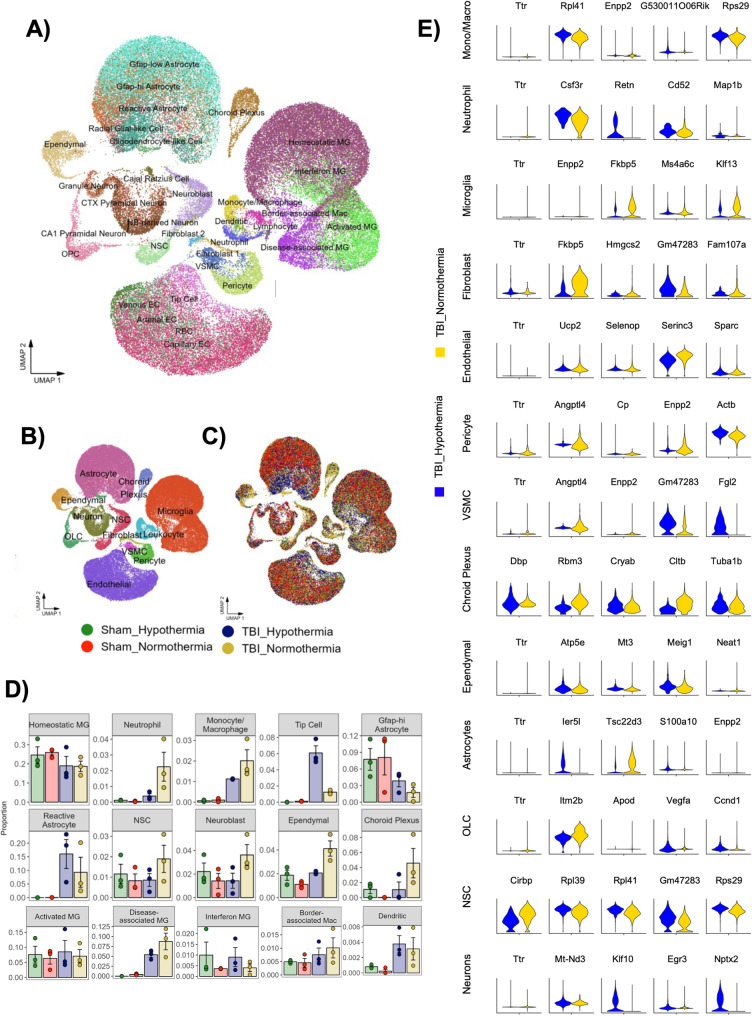
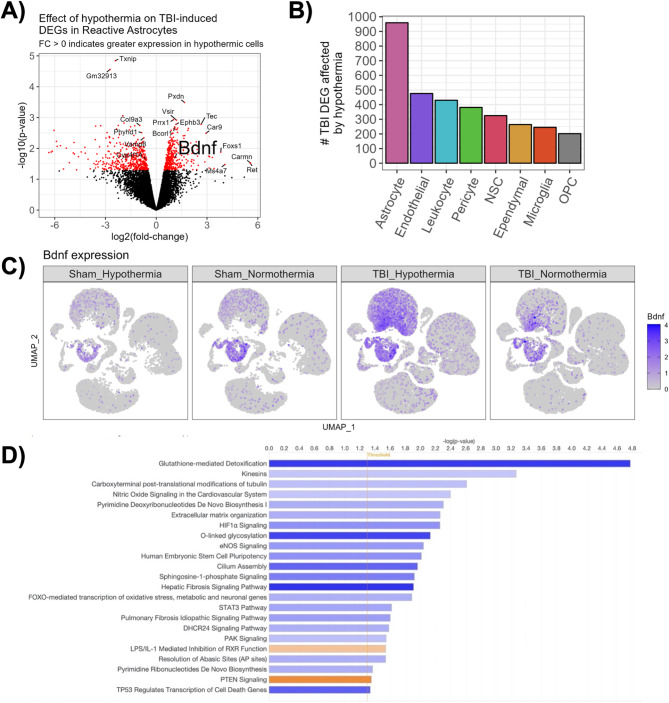
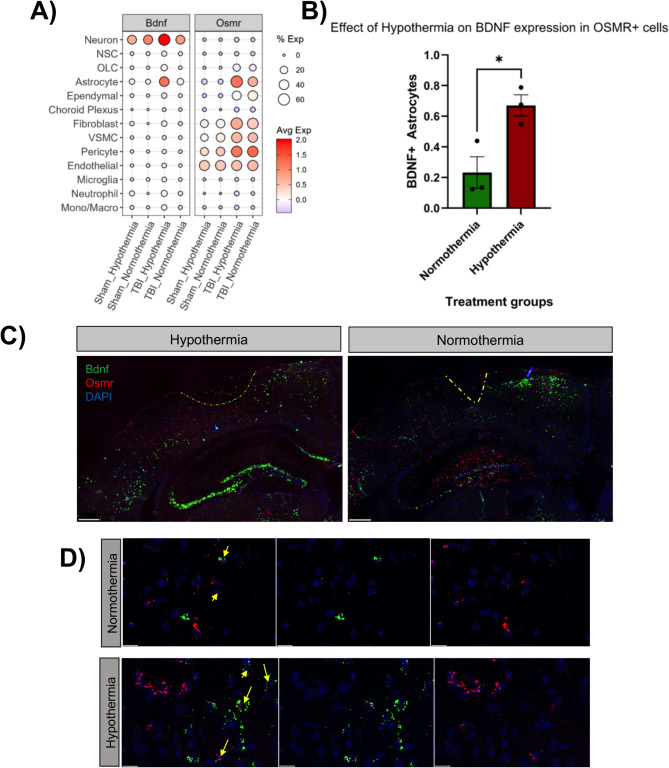
Traumatic brain injury (TBI) initiates a cascade of cellular and molecular events that promote acute and long-term patterns of neuronal, glial, vascular, and synaptic vulnerability leading to lasting neurological deficits. These complex responses lead to patterns of programmed cell death, diffuse axonal injury, increased blood-brain barrier disruption, neuroinflammation, and reactive gliosis, each a potential target for therapeutic interventions. Posttraumatic therapeutic hypothermia (TH) has been reported to be highly protective after brain and spinal cord injury and studies have investigated molecular mechanisms underlying mild hypothermic protection while commonly assessing heterogenous cell populations. In this study we conducted single-cell RNA sequencing (scRNA-seq) on cerebral cortical tissues after experimental TBI followed by a period of normothermia or hypothermia to comprehensively assess multiple cell type-specific transcriptional responses. C57BL/6 mice underwent moderate controlled cortical impact (CCI) injury or sham surgery and then placed under sustained normothermia (37⁰C) or hypothermia (33⁰C) for 2 h. After 24 h, cortical tissues including peri-contused regions were processed for scRNA-seq. Unbiased clustering revealed cellular heterogeneity among glial and immune cells at this subacute posttraumatic time point. The analysis also revealed vascular and immune subtypes associated with neovascularization and debris clearance, respectively. Compared to normothermic conditions, TH treatment altered the abundance of specific cell subtypes and induced reactive astrocyte-specific modulation of neurotropic factor gene expression. In addition, an increase in the proportion of endothelial tip cells in the hypothermic TBI group was documented compared to normothermia. These data emphasize the importance of early temperature-sensitive glial and vascular cell processes in producing potentially neuroprotective downstream signaling cascades in a cell-type-dependent manner. The use of scRNA-seq to address cell type-specific mechanisms underlying therapeutic treatments provides a valuable resource for identifying targetable biological pathways for the development of neuroprotective and reparative interventions.
Keywords: Astrocytes; Hypothermia; Single-cell RNA sequencing; Traumatic brain injury.
© 2025. The Author(s).
Conflict of interest statement
Declarations. Ethics approval and consent: Not applicable. Consent for publication: Not applicable. Competing interests: The authors declare no competing interests.
Figures
Similar articles
-
Cooling for cerebral protection during brain surgery.Cochrane Database Syst Rev. 2015 Jan 28;1(1):CD006638. doi: 10.1002/14651858.CD006638.pub3. Cochrane Database Syst Rev. 2015. PMID: 25626888 Free PMC article.
-
Single-cell RNA sequencing integrated with bulk RNA sequencing analysis reveals the protective effects of lactate-mediated lactylation of microglia-related proteins on spinal cord injury.CNS Neurosci Ther. 2024 Sep;30(9):e70028. doi: 10.1111/cns.70028. CNS Neurosci Ther. 2024. PMID: 39218784 Free PMC article.
-
Active body surface warming systems for preventing complications caused by inadvertent perioperative hypothermia in adults.Cochrane Database Syst Rev. 2016 Apr 21;4(4):CD009016. doi: 10.1002/14651858.CD009016.pub2. Cochrane Database Syst Rev. 2016. PMID: 27098439 Free PMC article.
-
Interventions to prevent hypothermia at birth in preterm and/or low birth weight infants.Cochrane Database Syst Rev. 2018 Feb 12;2(2):CD004210. doi: 10.1002/14651858.CD004210.pub5. Cochrane Database Syst Rev. 2018. PMID: 29431872 Free PMC article.
-
Technological aids for the rehabilitation of memory and executive functioning in children and adolescents with acquired brain injury.Cochrane Database Syst Rev. 2016 Jul 1;7(7):CD011020. doi: 10.1002/14651858.CD011020.pub2. Cochrane Database Syst Rev. 2016. PMID: 27364851 Free PMC article.
References
-
- van Dijck J, Bartels R, Lavrijsen JCM, Ribbers GM, Kompanje EJO, Peul WC. All focus group P: the patient with severe traumatic brain injury: clinical decision-making: the first 60 min and beyond. Curr Opin Crit Care. 2019;25:622–9. - PubMed
-
- Dewan MC, Rattani A, Gupta S, Baticulon RE, Hung YC, Punchak M, Agrawal A, Adeleye AO, Shrime MG, Rubiano AM et al. Estimating the global incidence of traumatic brain injury. J Neurosurg 2018:1–18. - PubMed
-
- Corrigan JD, Hammond FM. Traumatic brain injury as a chronic health condition. Arch Phys Med Rehabil. 2013;94:1199–201. - PubMed
MeSH terms
Grants and funding
LinkOut - more resources
Full Text Sources
Medical
