. 2025 Apr 18;16(1):187.
doi: 10.1186/s13287-025-04295-5.

Chemical reprogramming culture for the expansion of salivary gland epithelial basal progenitor cells

Affiliations

Chemical reprogramming culture for the expansion of salivary gland epithelial basal progenitor cells

Ye Jin Jeong et al. Stem Cell Res Ther. .

Abstract

Background: Salivary gland (SG) hypofunction presents a significant clinical challenge with limited treatment options. SG epithelial cells offer a promising approach due to their intrinsic tissue specificity and regenerative potential. However, the lack of efficient culture methods has hindered their clinical use.

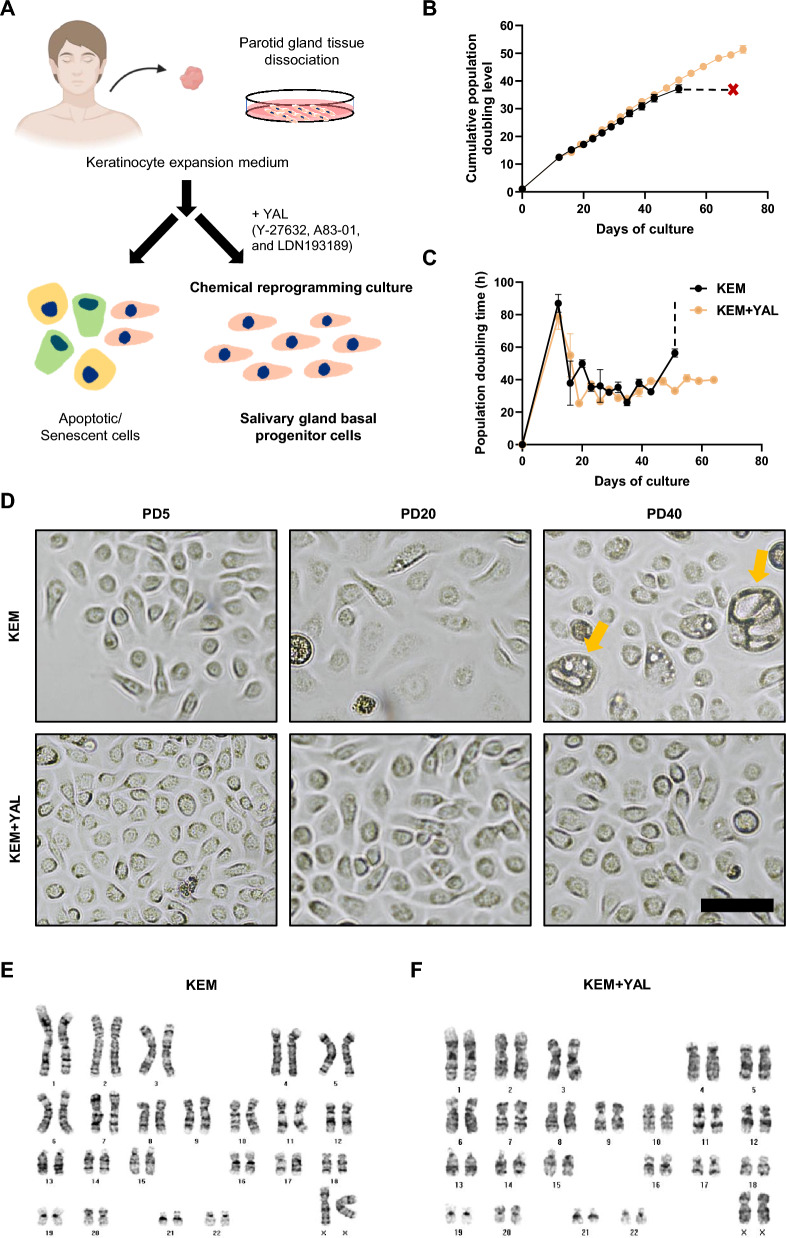
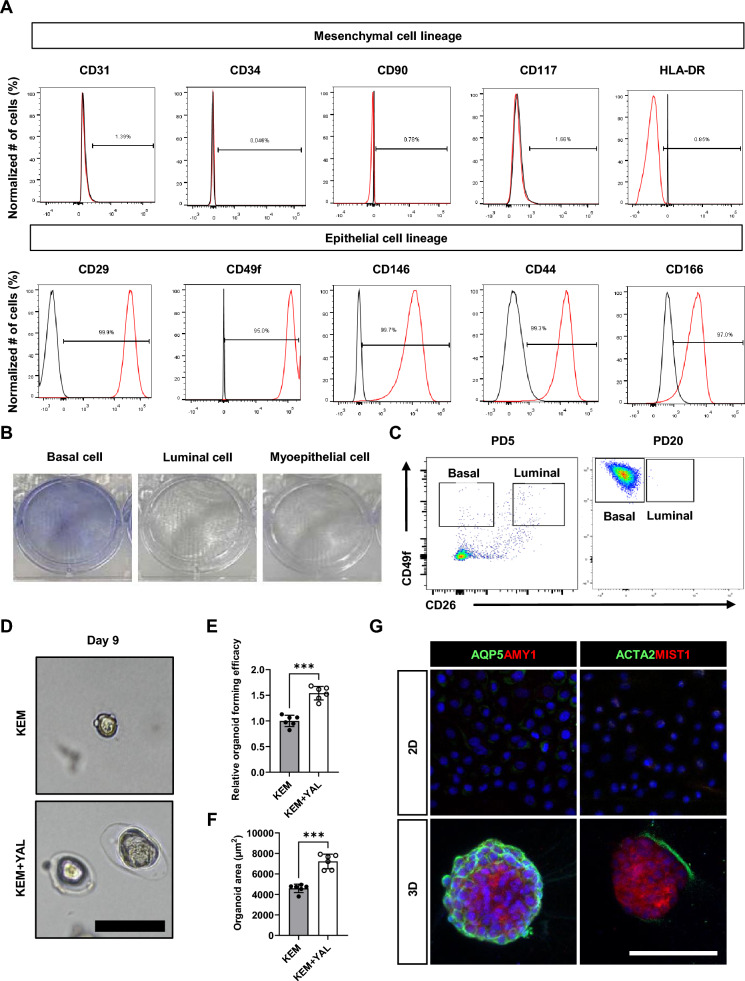
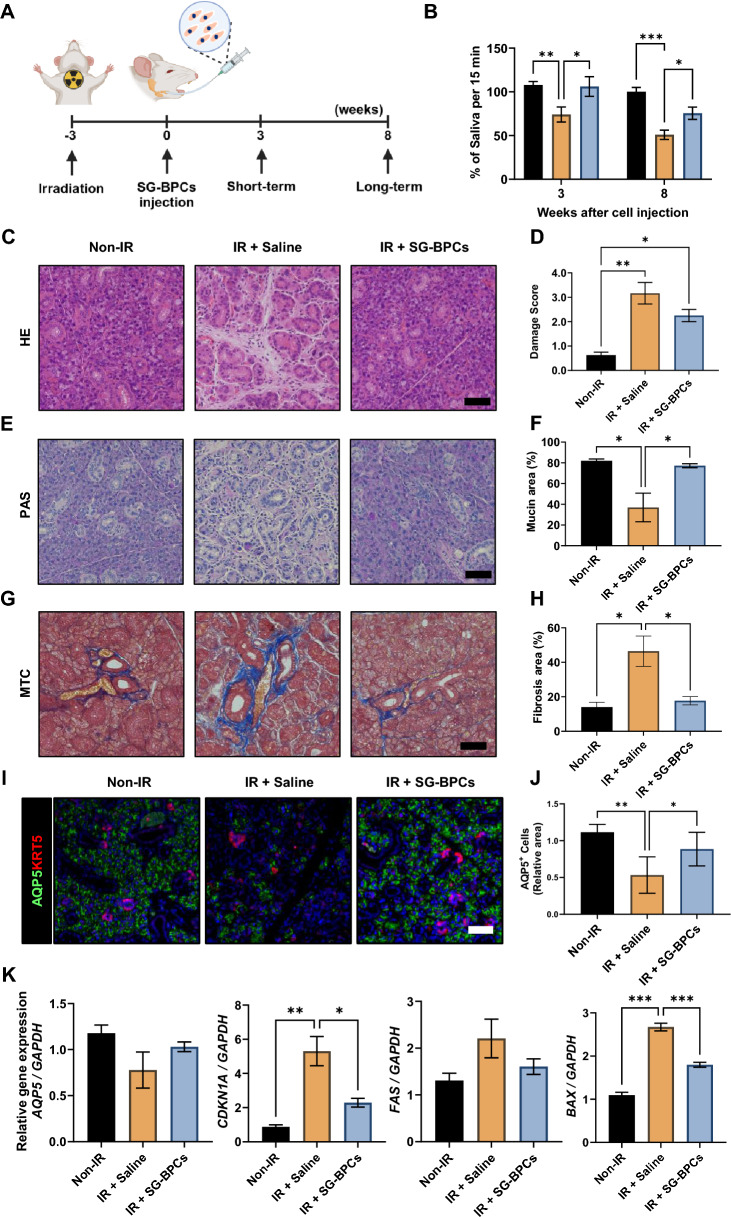
Methods: This study presents a chemical reprogramming culture (CRC) system that utilizes a combination of three small molecules for the long-term two-dimensional culture of human SG epithelial progenitor cells. We characterized the cultured cells, measured their organoid-forming efficiencies, and assessed their differentiation potential. To evaluate the therapeutic efficacy of the SG basal progenitor cells (SG-BPCs), we administered them into a mouse model with radiation-induced SG hypofunction and assessed the functional recovery.

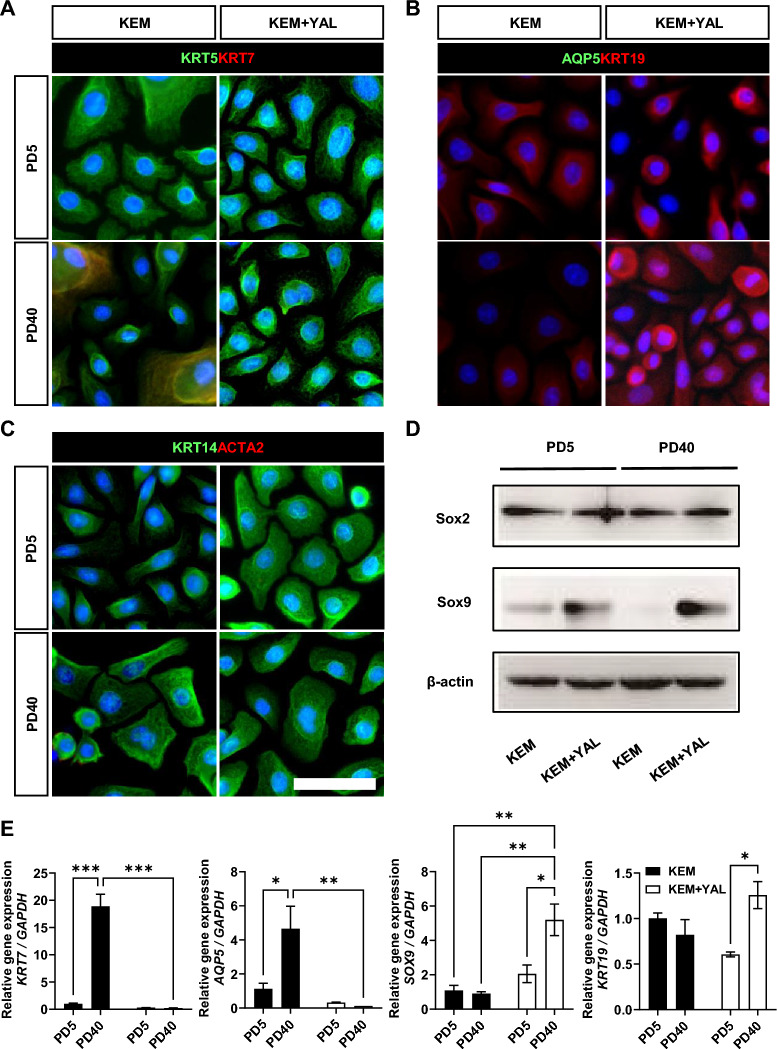
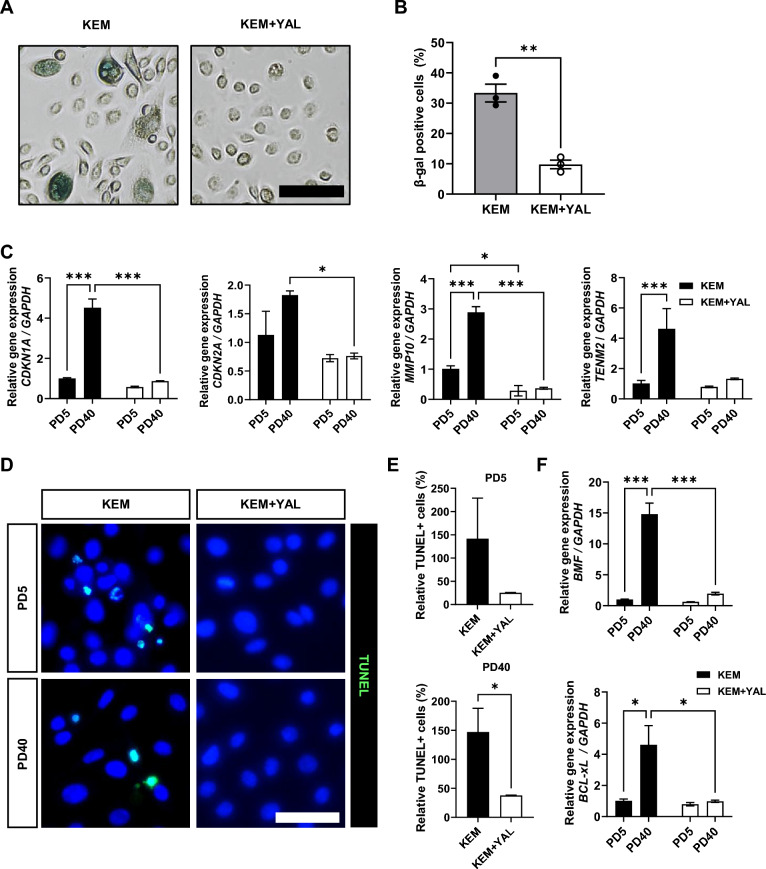
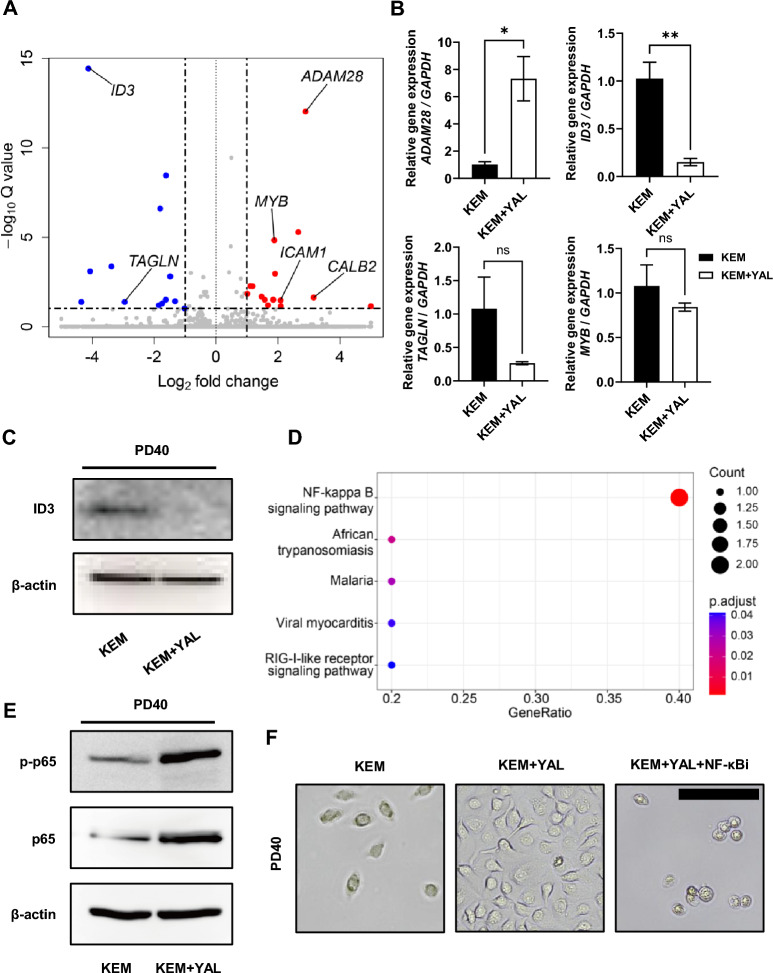
Results: By utilizing optimal concentrations of the small molecules Y-27632, A83-01, and LDN193189, the SG epithelial cells achieved over 50 population doubling levels (PD) within 80 d, surpassing the Hayflick limit. β-galactosidase and Terminal deoxynucleotidyl transferase dUTP nick end labeling staining confirmed that these small molecules inhibited cellular senescence and apoptosis, respectively. The cells expressed SG basal ductal cell markers KRT5, KRT19, and SOX9, with increased expression levels observed from PD5 to PD40. Notably, these expanded cells were able to differentiate into various SG cell types, including acinar and myoepithelial cells, indicating that SG-basal progenitor cells (SG-BPCs) were selectively proliferated using our CRC method. To assess the therapeutic potential of the expanded SG-BPCs, they were administered to mice with radiation-induced SG hypofunction. The treatment successfully restored SG function.

Conclusion: Our findings demonstrate that our CRC system is an effective method for the long-term culture of SG-BPCs. This advancement holds significant promise for the development of SG epithelial progenitor-based therapies to treat SG hypofunction.

Keywords: Basal progenitor cell; Cell therapy; Chemical reprogramming culture; Epithelial stem cell; Salivary gland.


Conflict of interest statement

Declarations. Ethics approval and consent to participate: Human SGs were provided by Yonsei University Severance Hospital, following the acquisition of informed consent and approval from the institutional review board. The human experiment protocol titled “A biobanking study to investigate the mechanisms underlying chemoresistance in head and neck cancer” was approved by the Yonsei University Severance Hospital on March 25, 2017 (permission number #4–2017-0325). All participants provided informed consent. The animal experiment protocol titled “Development of therapeutics for salivary gland hypofunction based on functional exosomes from human salivary gland stem cells through animal models” was approved by the Institutional Animal Care and Use Committee of Yonsei University College of Medicine on June 2, 2023 (approval number #2023–0192). The animal experiments have been reported in line with the ARRIVE guidelines 2.0. Consent for publication: The authors confirm their consent for publication. Competing interests: All authors declare no conflict of interests. Artificial intelligence: The authors declare that artificial intelligence-generated work was not used in this manuscript.

Figures

Fig. 1
Fig. 1
Small-molecule cocktails enables the long-term proliferation of SG epithelial cells. A Schematic depiction of CRC. B PD of human SG epithelial cells cultured with KEM in the absence and presence of a small-molecule cocktails. The data are representative of three independent experiments performed in triplicate and are expressed as mean ± SEM. C PDT of KEM and KEM + YAL conditions. The data are representative of three independent experiments performed in triplicate and are expressed as mean ± SEM. D Representative images of SG epithelial cells cultured under KEM and KEM + YAL conditions at PD5, PD20, and PD40 time points. The PD40 cells under KEM condition exhibit a senescent phenotype (yellow arrow). Scale bar: 100 μm. E, F Karyotype analysis is conducted with SG epithelial cells at PD40 under KEM and KEM + YAL conditions, respectively
Fig. 2
Fig. 2
Triple small-molecule cocktail preferentially enables the expansion of SG basal ductal cells. A Representative ICC staining for KRT5 (basal cell, green), KRT7 (terminally differentiated luminal cell, red); B AQP5 (pro-acinar cell, green), KRT19 (ductal progenitor cell, red); and C KRT14 (ductal progenitor cell, green), ACTA2 (myoepithelial cell, red), and DAPI (blue) of human SG epithelial cells under KEM and KEM + YAL conditions at PD5 and PD40. Scale bar: 50 μm. D Western blot of the cells cultured under KEM and KEM + YAL conditions at PD5 and PD40 for SOX2 (acinar progenitor cell) and SOX9 (ductal progenitor cell). Full-length blots are presented in Fig. S7A. E mRNA expression of KRT7, AQP5, SOX9, and KRT19 in cells cultured under KEM and KEM + YAL conditions, measured by qRT-PCR. Two-way ANOVA (alpha = 0.05) is conducted on data presented in (E) followed by Tukey’s multiple comparisons. The data are representative of three independent experiments performed in triplicate and are expressed as mean ± SEM. * = p < 0.05, ** = p < 0.01, *** = p < 0.001
Fig. 3
Fig. 3
Stem-cell characteristics and differentiation potential of chemically reprogrammed SG epithelial cells with triple small molecules. A Flow cytometry is performed to assess the expression of various cell-surface markers in KEM + YAL-cultured PD20 cells (red line). The SG epithelial cells are negative for CD31, CD34, CD90, CD117, and HLA-DR, whereas they are positive for CD29, CD49f, CD146, CD44, and CD166. Isotype controls identify negative controls (black line). B The KEM + YAL-cultured cells are isolated using fluorescence-activated cell sorting and crystal violet staining of basal, luminal, and myoepithelial cells. C Flow cytometric analysis reveals an increase in the proportion of basal cells in PD20 cells compared to that in PD5 cells. D SG epithelial cells from KEM and KEM + YAL conditions are cultured in Matrigel for 9 d. Identical fields are captured using a bright field microscope. Scale bar: 100 μm. E Quantification of organoid forming efficacy. F Quantification of organoid area. An unpaired Two-tailed t-test is used to calculate significance on data presented in (E) and (F). Quantification is conducted from a single experiment with three technical repeats and expressed as mean ± SD. *** = p < 0.001. G Immunofluorescence microscopy of AQP5, AMY1, ACTA2, and MIST1 on both 2D and 3D cultures for 9 d. Scale bar: 100 μm
Fig. 4
Fig. 4
Small molecules inhibit activation of oncogene-induced senescence and apoptosis in SG-BPCs. A Representative SA-β-galactosidase staining images of SG epithelial cells cultured under KEM and KEM + YAL conditions at PD40. Scale bar: 100 μm. B The β-gal + cells are quantified in conditions without and with the small-molecule compounds. An unpaired Two-tailed t-test is used to calculate significance. Quantification is conducted from a single experiment with three technical repeats and expressed as mean ± SD. ** = p < 0.01. C The gene expression of cellular senescence marker (CDKN1A, CDKN2A, MMP10, and TENM2) in SG epithelial cells untreated and treated with small molecules. D Representative TUNEL staining images of SG epithelial cells in the KEM and KEM + YAL groups at PD5 and PD40. Scale bar: 50 μm. E TUNEL + cells are quantified in conditions without and with the small-molecule compounds. An unpaired Two-tailed t-test is used to calculate significance. Quantification is conducted from a single experiment with three technical repeats and expressed as mean ± SD. * = p < 0.05. F The gene expression of cellular apoptosis markers (BMF and BCL-xL) in SG epithelial cells untreated and treated with small molecules. Two-way ANOVA (alpha = 0.05) is conducted on data presented in (C) and (F) followed by Tukey’s multiple comparisons. The data are representative of three independent experiments performed in triplicate and are expressed as mean ± SEM. * = p < 0.05, *** = p < 0.001
Fig. 5
Fig. 5
NF-κB signaling pathway supports the long-term maintenance of SG-BPCs. A Volcano plot depicting differential gene expression between KEM and KEM + YAL, as analyzed by bulk RNA sequencing. Data points are colored based on their average expression across all datasets. Red points represent genes upregulated in KEM + YAL, whereas blue points indicate downregulated genes. An adjusted p < 0.1 is considered significant for differential expression. B The gene expression of cellular senescence markers (ADAM28, ID3, TAGLN, and MYB) in SG-BPCs untreated and treated with small molecules. C Western blot of the cells cultured under KEM and KEM + YAL conditions at PD40 for ID3 and β-actin. Full-length blots are presented in Fig. S7C. D Dot plots illustrate the results of GSEA with an adjusted p < 0.1. Each dot plot highlights enriched terms within the transcriptome of KEM + YAL. The size of the dot corresponds to the number of enriched genes, and the color indicates the adjusted p-value. E Western blotting is performed to analyze protein expression levels of p-p65, p65, and β-actin in PD40 cells cultured without or with small-molecule cocktails. Blotting for p-p65, p65, and β-actin are performed sequentially on the same membrane. Full-length blots are presented in Fig. S7D. F Representative images of the cells cultured under KEM, KEM + YAL, and KEM + YAL + NF-κBi conditions for 72 h at PD40 time-point. The data are representative of three independent experiments performed in triplicate and are expressed as mean ± SEM. ns = not significant, * = p < 0.05, ** = p < 0.01
Fig. 6
Fig. 6
Efficacy of SG-BPCs on tissue regeneration in a mouse radiation model. A Schematic depiction of mouse experiment. B Relative saliva flow rate after 3 and 8 weeks of SG-BPCs injection. Two-way ANOVA (alpha = 0.05) is conducted on data presented in (B) followed by Tukey’s multiple comparisons. The data are representative of three independent experiments performed in triplicate and are expressed as mean ± SEM. * = p < 0.05, ** = p < 0.01, *** = p < 0.001. C, E, and G Representative histological images of HE, PAS, and MTC staining at Week 8 after SG-BPCs injection, respectively. Scale bar: 50 μm. D, F and H Quantification of SG damage score, ratio of mucin area, and fibrosis area, respectively. Two-way ANOVA (alpha = 0.05) is conducted on data presented in (D), (F), and (H) followed by Tukey’s multiple comparisons. The data are representative of three independent experiments performed in triplicate and are expressed as mean ± SEM. * = p < 0.05, ** = p < 0.01. I Immunofluorescence microscopy of AQP5 and KRT5 at 8 weeks after SG-BPCs injection. Scale bar: 50 μm. J Quantification of AQP5+ cells. One-way ANOVA (alpha = 0.05) is conducted on data presented in (I) followed by Tukey’s multiple comparisons. The data are representative of three independent experiments performed in triplicate and are expressed as mean ± SEM. * = p < 0.05, ** = p < 0.01. K Gene expression analysis of markers associated with acinar cells, cellular senescence, and apoptosis (AQP5, CDKN1A, FAS, and BAX). An unpaired two-tailed t-test is used to calculate significance. The data are representative of three independent experiments performed in triplicate and are expressed as mean ± SEM. * = p < 0.05, ** = p < 0.01, *** = p < 0.001

Similar articles

References

    1. Shin HS, et al. Stem cell properties of human clonal salivary gland stem cells are enhanced by three-dimensional priming culture in nanofibrous microwells. Stem Cell Res Ther. 2018;9:74. 10.1186/s13287-018-0829-x. - PMC - PubMed
    1. Pringle S, et al. Salivary gland stem cells age prematurely in primary sjögren’s syndrome. Arthritis Rheumatol. 2019;71:133–42. 10.1002/art.40659. - PMC - PubMed
    1. Rehman HU. Sjögren’s syndrome. Yonsei Med J. 2003;44:947–54. - PubMed
    1. Takashi I, et al. Recent progress in regenerative therapy for damaged salivary: glands from bench to bedside. Oral Dis. 2024;30:38–49. 10.1111/odi.14692. - PubMed
    1. Abd El-Haleem MR, Selim AO, Attia GM. Bone marrow-derived mesenchymal stem cells ameliorate parotid injury in ovariectomized rats. Cytotherapy. 2018;20:204–17. 10.1016/j.jcyt.2017.10.003. - PubMed