

Molecular and phenotypic characterization of 5-FU resistant colorectal cancer cells: toward enrichment of cancer stem cells
- PMID: 40251609
- PMCID: PMC12008981
- DOI: 10.1186/s12935-025-03758-2
Molecular and phenotypic characterization of 5-FU resistant colorectal cancer cells: toward enrichment of cancer stem cells
Erratum in
-
Correction: Molecular and phenotypic characterization of 5-FU resistant colorectal cancer cells: toward enrichment of cancer stem cells.Cancer Cell Int. 2025 Jul 4;25(1):252. doi: 10.1186/s12935-025-03891-y. Cancer Cell Int. 2025. PMID: 40616120 Free PMC article. No abstract available.
Abstract
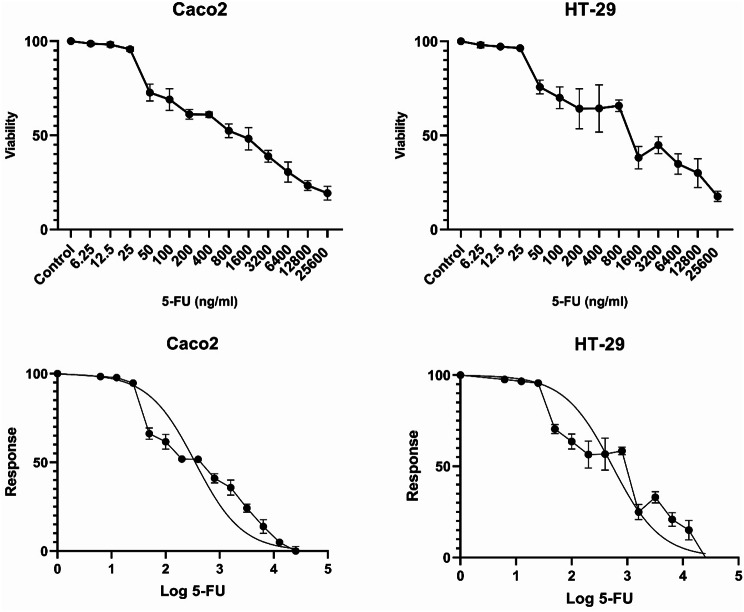
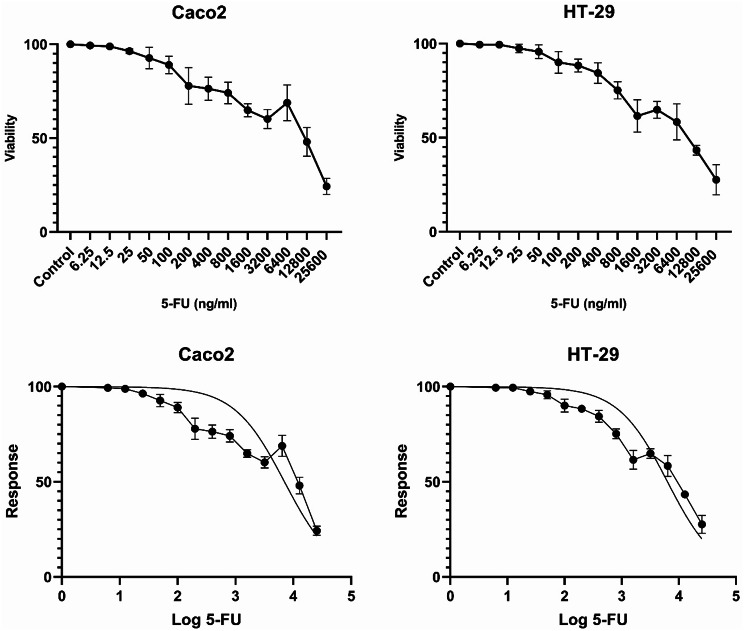
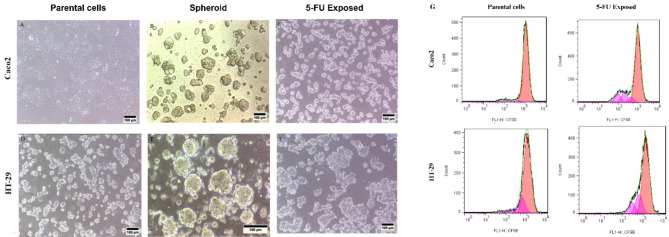
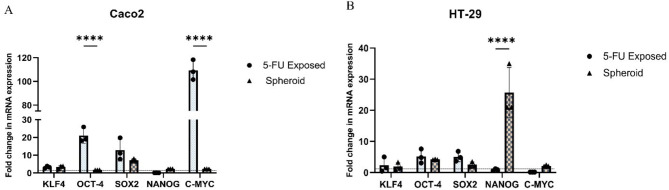
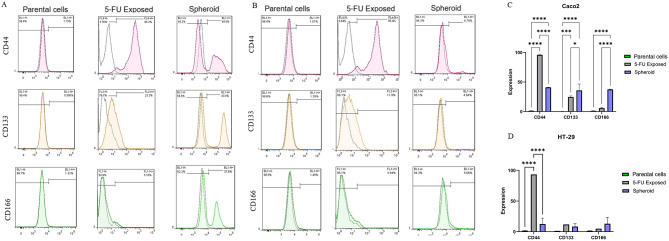
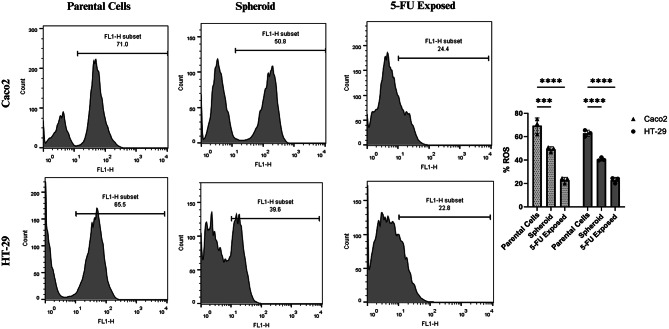
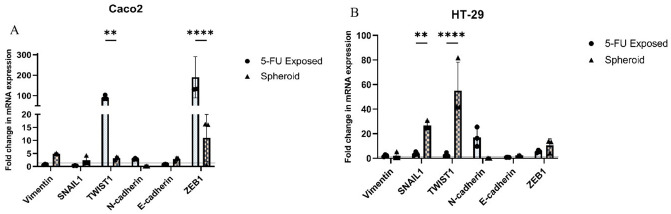
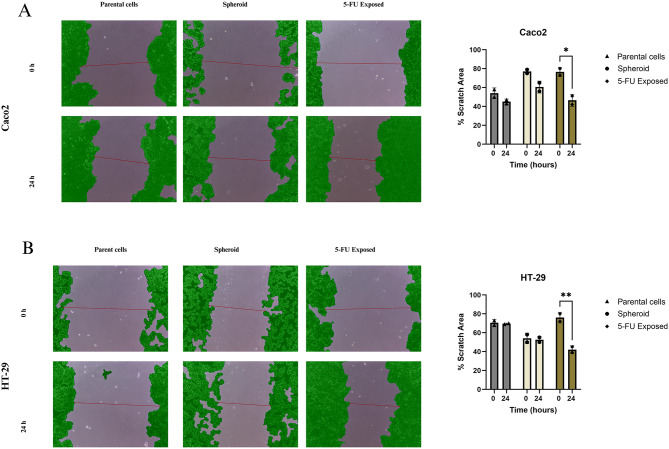
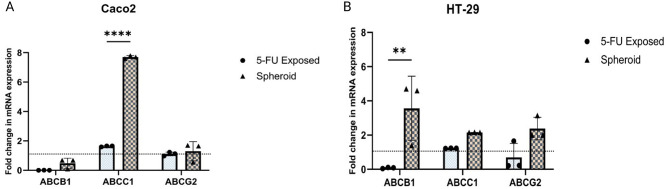
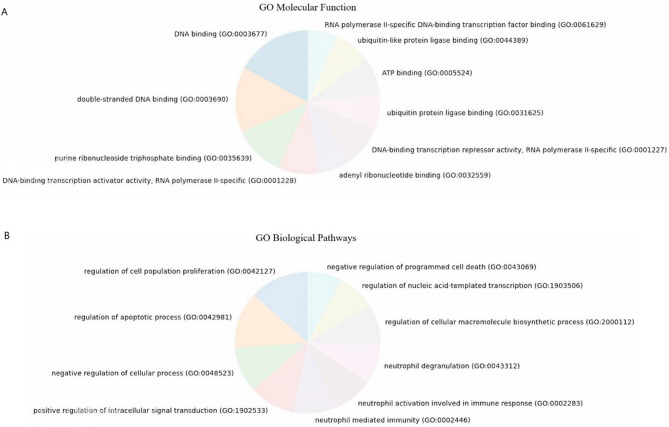
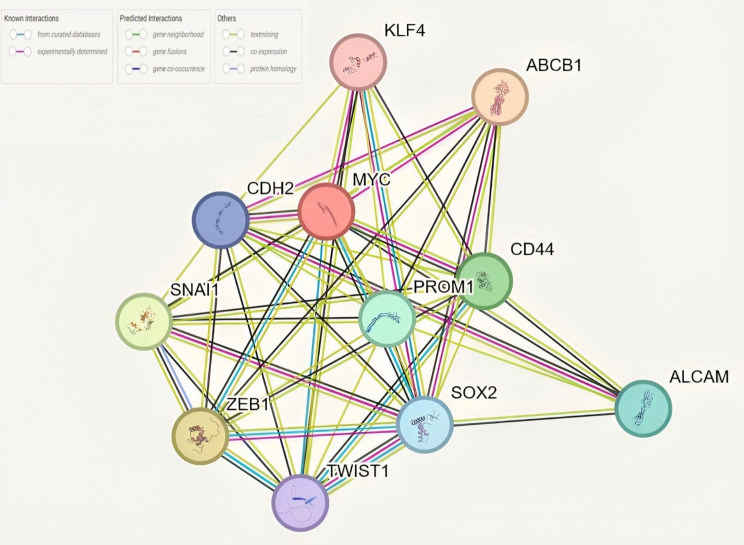
Cancer stem cells (CSCs) as a subgroup of cells within a tumor capable of self-renewal, thereby driving tumor initiation and spread. Addressing treatment failures in cancer, linked to CSCs and their resistance mechanisms, requires effective preclinical models for testing targeted therapies. Caco2- and HT-29-resistant cells were generated by repeated treatment of cells with growing concentrations of 5-fluorouracil (5-FU) anticancer drug for an extended time. The sensitivity of 5-FU-resistant cells was evaluated by cytotoxicity assay. Stemness, epithelial-mesenchymal transition (EMT), migration and drug resistance characteristics were assessed through gene expression investigation by real-time PCR. The expression of CD44, CD133, and CD66 were evaluated by flow cytometry. To end, the bioinformatic analysis estimated the molecular function and biological pathways considering the differential expression of selected genes and proteins. 5-FU-exposed cells displayed increased resistance to 5-FU. The gene expression analysis showed an upregulation of stemness genes (KLF4, SOX2, OCT4, C-MYC), enhanced scavenging system, and elevated expression of CSC surface markers (CD44 and CD133) compared to parental cells. Additionally, pro-EMT genes (TWIST1, SNAIL1, ZEB1, Vimentin, and N-cadherin) were significantly upregulated compared to parental cells, with the downregulation of E-cadherin as an EMT suppressor gene reflected in increased migration capacity. Moreover, increased expression of ABC transporter genes (ABCB1, ABCC1) was observed, correlating with enhanced drug resistance. The bioinformatic analysis highlighted pathways related to microRNAs in cancer, cells pluripotency, and proteoglycans. Methods of drug exposure take priority over spheroid formation, particularly due to their enhanced efficacy in stemness, EMT, and surface markers. This positions them as a promising protocol for establishing experimental models of CSCs.
Keywords: 5-FU, EMT; ABC, Drug resistance; Cancer stem cell; Colorectal cancer.
© 2025. The Author(s).
Conflict of interest statement
Declarations. Ethics approval and consent to participate: Not applicable. Consent to publish: The Authors grant the Publisher the sole and exclusive license of the full copyright in the Contribution, which licenses the Publisher hereby accepts. Consequently, the Publisher shall have the exclusive right throughout the world to publish and sell the Contribution in all languages. Competing interests: The authors declare no competing interests.
Figures
Similar articles
-
Preventive cancer stem cell-based vaccination modulates tumor development in syngeneic colon adenocarcinoma murine model.J Cancer Res Clin Oncol. 2023 Jul;149(7):4101-4116. doi: 10.1007/s00432-022-04303-8. Epub 2022 Aug 30. J Cancer Res Clin Oncol. 2023. PMID: 36040667 Free PMC article.
-
TGF-β1 exposure induces epithelial to mesenchymal transition both in CSCs and non-CSCs of the A549 cell line, leading to an increase of migration ability in the CD133+ A549 cell fraction.Cell Death Dis. 2013 May 2;4(5):e620. doi: 10.1038/cddis.2013.144. Cell Death Dis. 2013. PMID: 23640462 Free PMC article.
-
Morphological and molecular characteristics of spheroid formation in HT-29 and Caco-2 colorectal cancer cell lines.Cancer Cell Int. 2021 Apr 13;21(1):204. doi: 10.1186/s12935-021-01898-9. Cancer Cell Int. 2021. PMID: 33849536 Free PMC article.
-
The use of irinotecan, oxaliplatin and raltitrexed for the treatment of advanced colorectal cancer: systematic review and economic evaluation.Health Technol Assess. 2008 May;12(15):iii-ix, xi-162. doi: 10.3310/hta12150. Health Technol Assess. 2008. PMID: 18462574
-
Chemotherapy for advanced gastric cancer.Cochrane Database Syst Rev. 2017 Aug 29;8(8):CD004064. doi: 10.1002/14651858.CD004064.pub4. Cochrane Database Syst Rev. 2017. PMID: 28850174 Free PMC article.
Cited by
-
Correction: Molecular and phenotypic characterization of 5-FU resistant colorectal cancer cells: toward enrichment of cancer stem cells.Cancer Cell Int. 2025 Jul 4;25(1):252. doi: 10.1186/s12935-025-03891-y. Cancer Cell Int. 2025. PMID: 40616120 Free PMC article. No abstract available.
References
-
- Sung H, Ferlay J, Siegel RL, Laversanne M, Soerjomataram I, Jemal A, et al. Global cancer statistics 2020: GLOBOCAN estimates of incidence and mortality worldwide for 36 cancers in 185 countries. Cancer J Clin. 2021;71(3):209–49. - PubMed
-
- Siegel RL, Giaquinto AN, Jemal A. Cancer statistics, 2024. CA Cancer J Clin. 2024;74(1):12–49. - PubMed
-
- Bonnet D, Dick JE. Human acute myeloid leukemia is organized as a hierarchy that originates from a primitive hematopoietic cell. Nat Med. 1997;3(7):730–7. - PubMed
LinkOut - more resources
Full Text Sources
Research Materials
Miscellaneous
