. 2025 Apr 18;22(1):111.
doi: 10.1186/s12974-025-03441-3.

Phosphatidate phosphatase Lipin1 alters mitochondria-associated endoplasmic reticulum membranes (MAMs) homeostasis: effects which contribute to the development of diabetic encephalopathy

Affiliations

Phosphatidate phosphatase Lipin1 alters mitochondria-associated endoplasmic reticulum membranes (MAMs) homeostasis: effects which contribute to the development of diabetic encephalopathy

Shan Huang et al. J Neuroinflammation. .

Abstract

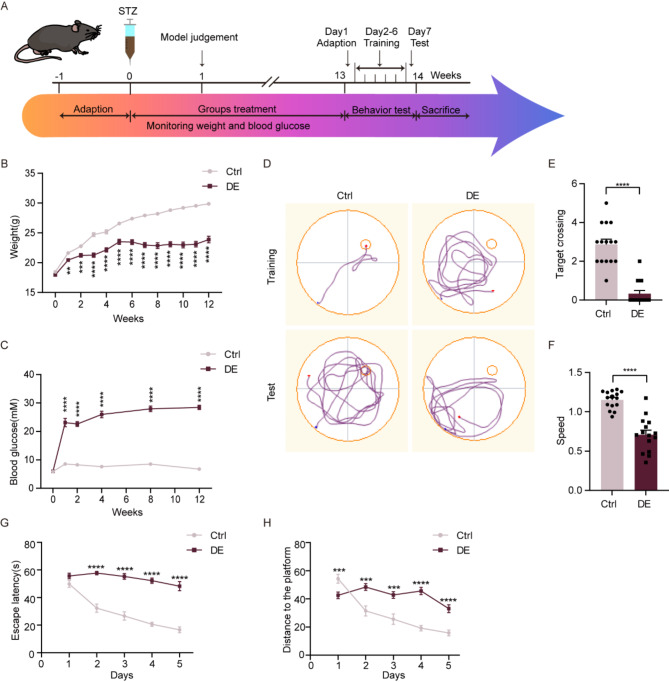
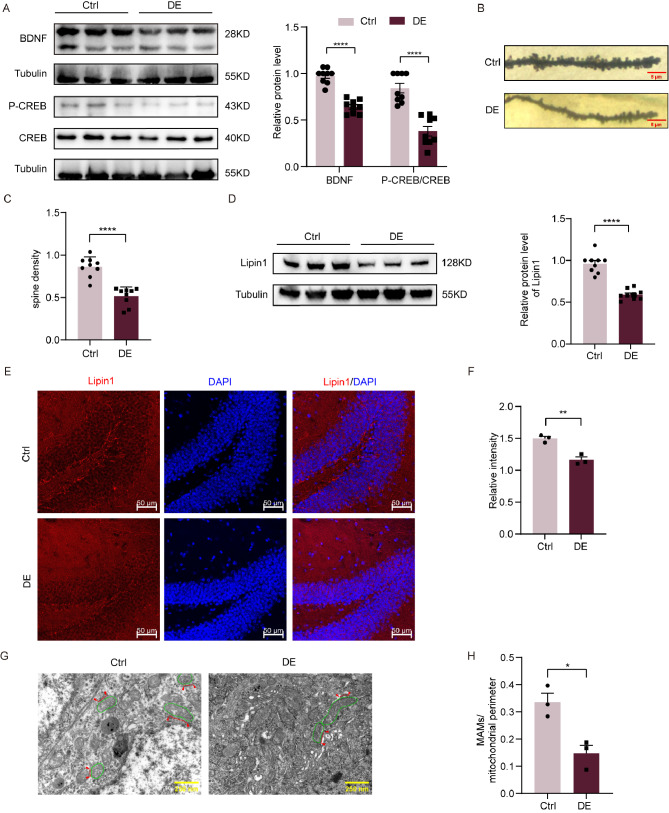
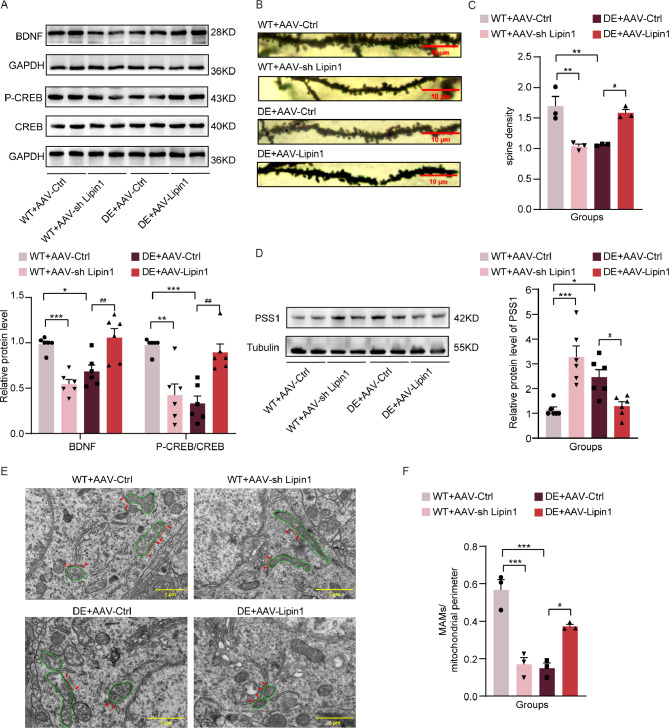
Diabetic encephalopathy (DE) is a common, chronic central nervous system complication of diabetes mellitus, and represents a condition without a clear pathogenesis or effective therapy. Findings from recent studies have indicated that a dyshomeostasis of mitochondria-associated endoplasmic reticulum membranes (MAMs) may be involved in the development of neurodegenerative diseases such as DE. MAMs represent a dynamic contact site between mitochondrial and endoplasmic reticulum (ER) membranes, where phospholipid components are exchanged with each other. Previous work within our laboratory has revealed that Lipin1, a critical enzyme related to phospholipid synthesis, is involved in the pathogenesis of DE. Here, we show that Lipin1 is downregulated within the hippocampus of a DE mouse model, an effect which was accompanied with a decrease in MAMs. Knockdown of Lipin1 in the hippocampus of normal mice resulted in a reduction of MAMs, ER stress, abnormal mitochondrial function, as well as impaired synaptic plasticity and cognitive function. These same phenomena were observed in the DE model, while an upregulation of Lipin1 within the hippocampus of DE mice improved these symptoms. Low levels of Lipin1 in DE mice were also associated with neuroinflammation, while an overexpression of Lipin1 significantly ameliorated the neuroinflammation observed in DE mice. In conclusion, Lipin1 ameliorates pathological changes associated with DE in a mouse model via prevention of dyshomeostasis in MAMs. Such findings suggest that Lipin1 may be serve as a new potential target for the treatment of DE.

Keywords: Cognitive dysfunction; Diabetic encephalopathy; Lipin1; MAMs; Mitochondria.


Conflict of interest statement

Declarations. Ethics approval and consent to participate: This study was approved by the Scientific Research Ethics Committee of the Second Hospital of Shandong University, in accordance with Declaration of Helsinki and the Guide for Care and Use of Laboratory Animals. Consent for publication: Not applicable. Competing interests: The authors declare no competing interests.

Figures

Fig. 1
Fig. 1
Mice show cognitive dysfunctions which model diabetic encephalopathy (DE) at 12 weeks after STZ injection. (A) Experimental paradigms for establishing the DE mouse model and behavioral experiments in DE and control mice. (B) Body weights and (C) Blood glucose levels at 0–12 weeks after STZ/control injections (n = 15 per group). (D) Movement trajectories in the Morris water maze. (E) Number of times mice in each group crossed the target platform during the test period (n = 15 per group). (F) Swimming speeds in the Morris water maze (n = 15 per group). (G) Escape latencies during the training period (n = 15 per group). (H) Distance traveled to the target platform during the training period (n = 15 per group). All data are shown as means ± SEMs. **p < 0.01, ***p < 0.001, and ****p < 0.0001, Ctrl vs. DE. Ctrl, Control. DE, Diabetic Encephalopathy
Fig. 2
Fig. 2
Decreased Lipin1 expression levels, MAMs and indicators of cognitive function in the DE mouse model. (A) Representative Western blot images showing relative protein levels of BDNF and CREB phosphorylation in DE and control mice (n = 9 per group). (B) Representative images of hippocampal dendritic densities. Scale bar is 10 μm. (C) Number of dendrites in hippocampal neurons (n = 9 per group). (D) Representative Western blot images of Lipin1 (n = 9 per group) (E) Representative immunofluorescent images of Lipin1. Scale bar is 50 μm. (F) Representative immunofluorescent images showing relative intensities of Lipin1 (n = 3 per group). (G) Representative images from transmission electron microscopy showing MAMs and mitochondria. Red, MAMs. Green, mitochondria. Scale bar is 250 nm. (H) Ratio of MAMs to mitochondrial perimeters as observed in electron microscopy images. All data are shown as means ± SEMs. *p < 0.05, **p < 0.01 and ****p < 0.0001, Ctrl vs. DE. Ctrl, Control. DE, Diabetic Encephalopathy
Fig. 3
Fig. 3
High glucose levels alter the state of HT22 neuronal cells. (A) Experimental paradigms for the HT22 cell experiments. Cell viability after (B) 24 h and (C) 48 h of treatment with glucose and mannitol (n = 9 per group). (D) Representative Western blot images showing relative protein expressions of Lipin1 in cells from the treatment groups described above (n = 6 per group). (E) Fluorescent images showing co-localizations of endoplasmic reticulum and mitochondria in cells. Scale bar is 5 μm. (F) Ratios of co-localized MAMs to mitochondrial regions in fluorescent images were analysed by Manders’ Coefficients (n = 3 per group). (G) Intensity of endoplasmic reticulum and mitochondria fluorescence at the white vector in cells. All data are shown as means ± SEMs. *p < 0.05, **p < 0.01, ***p < 0.001, and ****p < 0.0001, 25G vs. 100G OR other groups. G, Glucose. M, Mannitol. For example, 25G, 25 mM Glucose. 50 M, 50 mM Mannitol
Fig. 4
Fig. 4
Changes in Lipin1 alter cognitive function in mice. (A) Experimental paradigms for stereotactic injections into the hippocampus and behavioral experiments. (B) Schematics of AAV vectors engineered to knock-down and overexpress Lipin1. (C) Demonstration of an adeno-associated virus injection into the hippocampus. Scale bar is 2 mm. (D) Movement trajectories of the four groups of mice in the Morris water maze. (E) Number of crossings of the target platform during the test period (n = 9–10 per group). (F) Swimming speeds in the Morris water maze (n = 9–10 per group). (G) Escape latencies during the training period (n = 9–10 per group). (H) Distance traveled to reach the target platform during the training period (n = 9–10 per group). All data are shown as means ± SEMs. **p < 0.01 and ****p < 0.0001, WT + AAV-Ctrl vs. Other groups. ##p < 0.01 and ####p < 0.0001, DE + AAV-Lipin1 vs. Other groups
Fig. 5
Fig. 5
Changes in Lipin1 affect indicators of cognitive function and MAMs. (A) Representative Western blot images showing relative protein levels of BDNF and CREB phosphorylation in mice with altered levels of Lipin1 expression (n = 6 per group). (B) Representative images of hippocampal dendritic spine densities in mice. Scale bar is 10 μm. (C) Hippocampal spine densities vary as a function of alterations in Lipin1 expression (n = 3 per group). (D) Representative Western blot images showing relative protein expression levels of PSS1 (n = 6 per group). (E) Representative transmission electron microscopy images showing MAMs and mitochondria. Red, MAMs. Green, mitochondria. Scale bar is 1 μm. (F) Ratio of MAMs to mitochondrial perimeter in electron microscopy images (n = 3 per group). All data are shown as means ± SEMs. *p < 0.05, **p < 0.01, and ***p < 0.001, WT + AAV-Ctrl vs. Other groups. #p < 0.05, and ##p < 0.01, DE + AAV-Lipin1 vs. Other groups
Fig. 6
Fig. 6
Changes in Lipin1 affect endoplasmic reticulum and mitochondrial function. (A) Representative Western blot images showing relative protein levels of CHOP and GRP78 (n = 6 per group). (B) Representative Western blot images showing relative protein levels of LC3II, P62, PINK and Parkin (n = 6 per group). (C) Electron microscopy images of mitochondrial morphology. Red arrows, mitochondria with regular morphology and clear cristae. Bule arrows, mitochondria with swollen, disordered or disappeared cristae. (D) Representative immunofluorescent images of Mito-SOX. Scale bar is 50 μm. (E) Relative levels of oxidative stress. All data are shown as means ± SEMs. *p < 0.05, **p < 0.01, and ***p < 0.001, WT + AAV-Ctrl vs. Other groups. #p < 0.05, ##p < 0.01, and ###p < 0.001, DE + AAV-Lipin1 vs. Other groups
Fig. 7
Fig. 7
Changes in Lipin1 affect inflammation-related indicators. RT-PCR assays of mRNA expression levels of (A) IL-β, (B) IL-6 and (C) TNF-α (n = 11–12 per group). (D) Representative immunofluorescent images of Iba1+ cells. Scale bar is 50 μm. (E) Relative number of Iba1+ cells (n = 3 per group). (F) Morphology of Iba1+ cells. Scale bar is 50 μm. All data are shown as means ± SEMs. **p < 0.01, ***p < 0.001, and ****p < 0.0001, WT + AAV-Ctrl vs. Other groups. ##p < 0.01, ###p < 0.001, and ####p < 0.0001, DE + AAV-Lipin1 vs. Other groups
Fig. 8
Fig. 8
Changes in Lipin1 affect MAMs, endoplasmic reticulum and mitochondria in HT22 cells. (A) Experimental paradigms for the cell culture experiments. (B) Schematics of LV vectors engineered to knock-down or overexpress Lipin1. (C) Representative images of HT22 cells infected with the viruses. Representative Western blot images showing relative protein expressions after LV injection in HT22 cells for (D) PSSI, (E) CHOP and GRP78 and (F) LC3II, P62, PINK and Parkin (n = 8 per group). All data are shown as means ± SEMs. *p < 0.05, **p < 0.01, ***p < 0.001, and ****p < 0.0001, 25G + LV-Ctrl vs. Other groups. #p < 0.05, ##p < 0.01, ###p < 0.001, and ####p < 0.0001, DE + AAV-Lipin1 vs. Other groups

Similar articles

References

    1. Kodl CT, Seaquist ER. Cognitive dysfunction and diabetes mellitus. Endocr Rev. 2008;29(4):494–511. - PMC - PubMed
    1. DeJong RN. The nervous system complications of diabetes mellitus, with special reference to cerebrovascular changes. J Nerv Ment Dis. 1950;111(3):181–206.
    1. Xu T, Liu J, Li X-R, Yu Y, Luo X, Zheng X, et al. The mTOR/NF-κB pathway mediates neuroinflammation and synaptic plasticity in diabetic encephalopathy. Mol Neurobiol. 2021;58(8):3848–62. - PubMed
    1. Todorova V, Blokland A. Mitochondria and synaptic plasticity in the mature and aging nervous system. Curr Neuropharmacol. 2017;15(1):166–73. - PMC - PubMed
    1. Godoy JA, Rios JA, Picón-Pagès P, Herrera-Fernández V, Swaby B, Crepin G et al. Mitostasis, Calcium and Free Radicals in Health, Aging and Neurodegeneration. Biomolecules. 2021;11(7). - PMC - PubMed

MeSH terms

Substances

Supplementary concepts