. 2025 Jul;122(7):1710-1723.
doi: 10.1002/bit.28999. Epub 2025 Apr 18.

Temporal Galactose-Manganese Feeding in Fed-Batch and Perfusion Bioreactors Modulates UDP-Galactose Pools for Enhanced mAb Glycosylation Homogeneity

Affiliations

Temporal Galactose-Manganese Feeding in Fed-Batch and Perfusion Bioreactors Modulates UDP-Galactose Pools for Enhanced mAb Glycosylation Homogeneity

Aron Gyorgypal et al. Biotechnol Bioeng. 2025 Jul.

Abstract

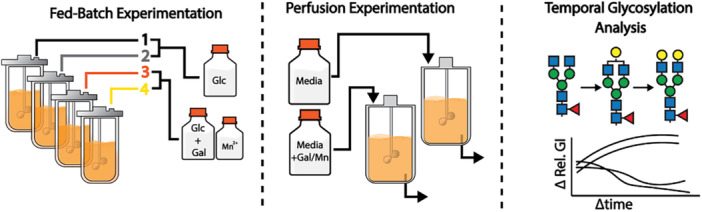
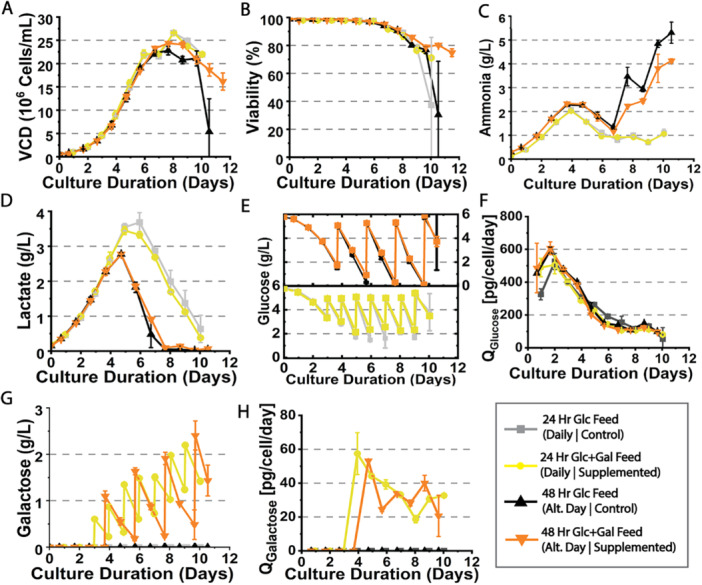
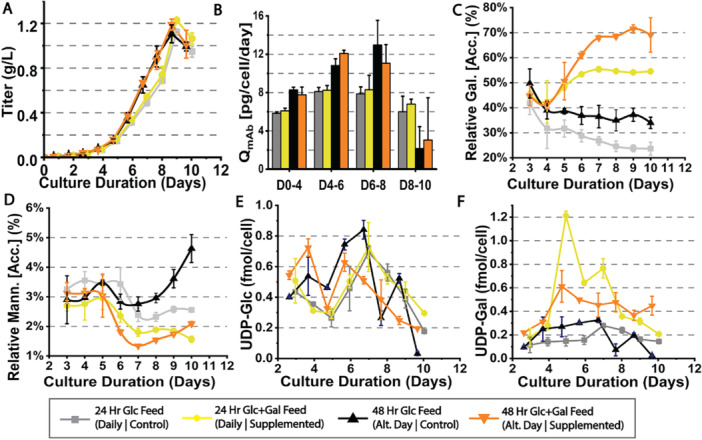
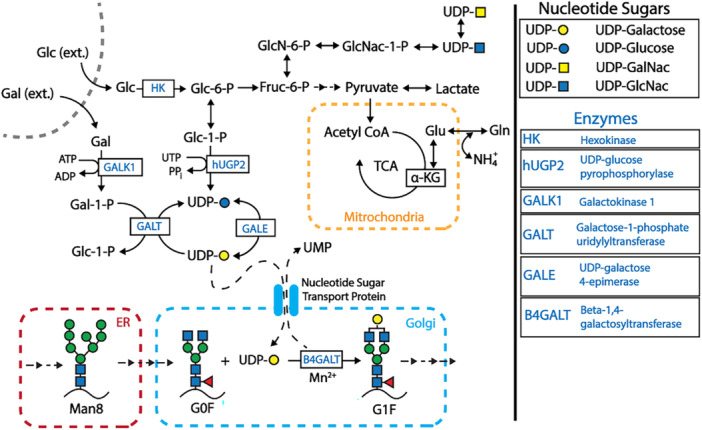
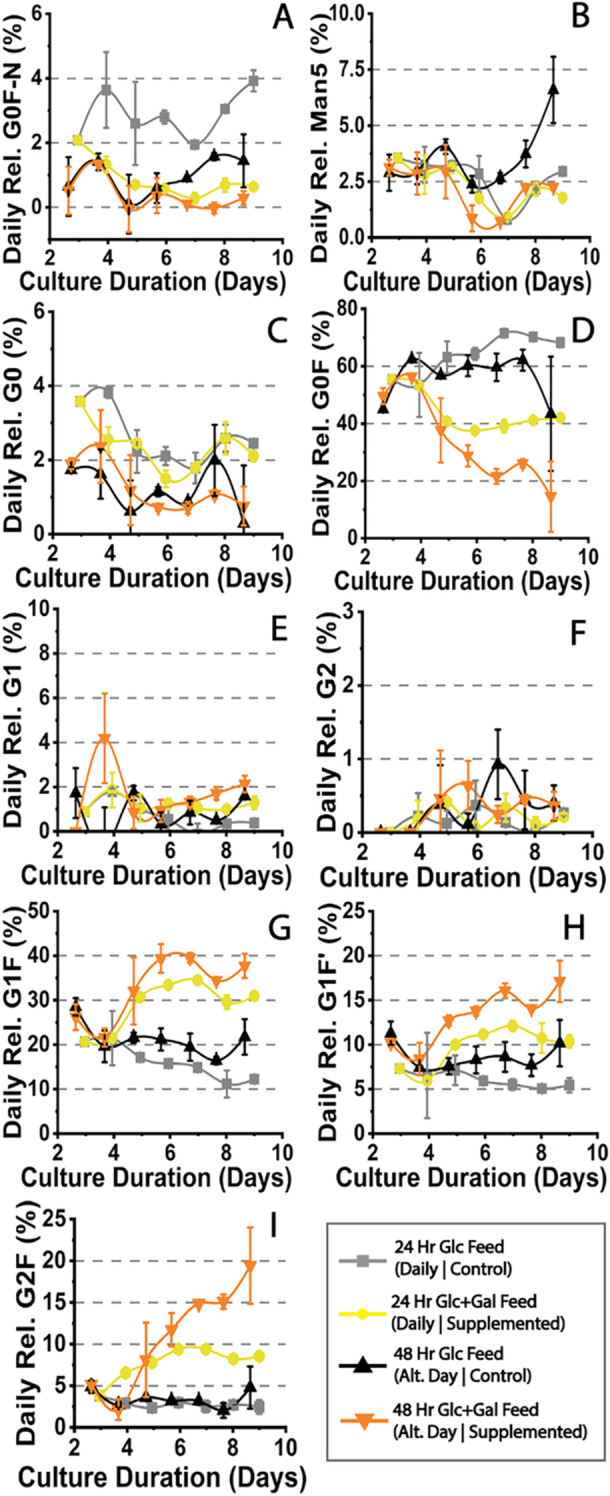
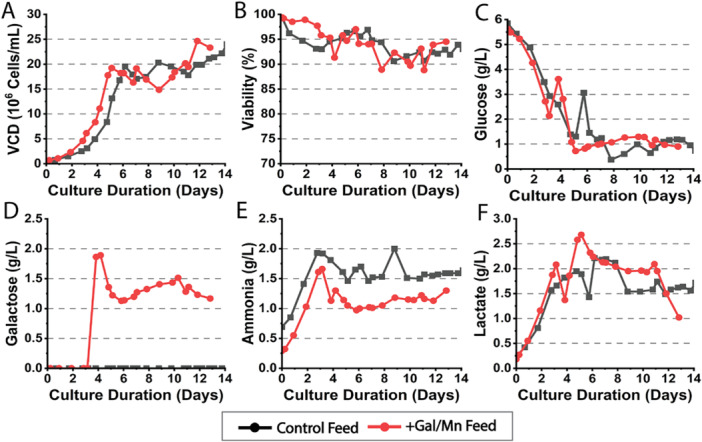
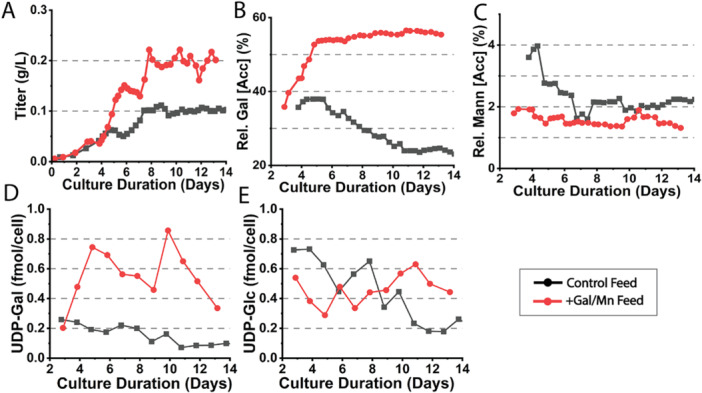
Monoclonal antibodies (mAbs) represent a majority of biotherapeutics in the market today. These glycoproteins undergo posttranslational modifications, such as N-linked glycosylation, that influence the structural & functional characteristics of the antibody. Glycosylation is a heterogenous posttranslational modification that may influence therapeutic glycoprotein stability and clinical efficacy, which is why it is often considered a critical quality attribute (CQA) of the mAb product. While much is known about the glycosylation pathways of Chinese Hamster Ovary (CHO) cells and how cell culture chemical modifiers may influence the N-glycosylation profile of the final product, this knowledge is often based on the final cumulative glycan profile at the end of the batch process. Building a temporal understanding of N-glycosylation and how mAb glycoform composition responds to real-time changes in the biomanufacturing process will help build integrated process models that may allow for glycosylation control to produce a more homogenous product. Here, we look at the effect of specific nutrient feed media additives (e.g., galactose, manganese) and feeding times on the N-glycosylation pathway to modulate N-glycosylation of a Herceptin biosimilar mAb (i.e., Trastuzumab). We deploy the N-GLYcanyzer process analytical technology (PAT) to monitor glycoforms in near real-time for bench-scale bioprocesses operated in both fed-batch and perfusion modes to build an understanding of how temporal changes in mAb N-glycosylation are dependent on specific media additives. We find that Trastuzumab terminal galactosylation is sensitive to media feeding times and intracellular nucleotide sugar pools. Temporal analysis reveals an increased desirable production of single and double galactose-occupied glycoforms over time under glucose-starved fed-batch cultures. Comparable galactosylation profiles were also observed between fed-batch (nutrient-limited) and perfusion (non-nutrient-limited) bioprocess conditions. In summary, our results demonstrate the utility of real-time monitoring of mAb glycoforms and feeding critical cell culture nutrients under fed-batch and perfusion bioprocessing conditions to produce higher-quality biologics.

Keywords: N‐linked glycosylation; bioprocessing; monoclonal antibody; perfusion.


Conflict of interest statement

The authors declare that they have no competing financial interests. This article reflects the author's views and should not be construed to represent FDA's views or policies. Certain commercial equipment, instruments, or materials are identified in this paper to foster understanding. Such identification does not imply recommendation or endorsement by the FDA.

Figures

Scheme 1
Scheme 1
Study overview for fed‐batch and perfusion‐based cultures. For the fed‐batch experiments, cultures were fed either daily (every 24 h) or on alternative days (every 48 h), and with either a bolus addition of glucose (control) or glucose and galactose (supplemented). For supplemented cultures, manganese was supplemented on the first feeding day to 1 µM. Perfusion‐based experiments were perfused with either basal medium or basal medium spiked with galactose (1.8 g/L) and manganese (1 µM). A temporal analysis of mAb glycosylation and modulation of galactosylation will be done to understand the influence of feed and feeding regimen; values will be assessed in terms of the galactosylation index (GI) and separated glycoforms.
Figure 1
Figure 1
Summary of fed batch culture process performance metrics. Viable cell density (A), viability (B), ammonia content (C), lactate content (D), glucose content (E), glucose consumption rate (F), galactose content (G) and galactose consumption rate (H).
Figure 2
Figure 2
Productivity, glycan indices, and glycan precursors for fed batch cultures. MAb titer (A), mAb specific productivity (B), relative accumulated galactosylation (C), relative accumulated mannosylation (D). The intracellular nucleotide sugar pools of UDP‐Glucose (E) and UDP‐Galactose (F) are presented here, which are precursors for mAb glycosylation.
Scheme 2
Scheme 2
The interconnectivity of glucose and galactose metabolism. Scheme shows a brief depiction of the transport of glucose into glycolysis (top), the transport of galactose (middle) into the Leloir pathway, which branches to both glycolytic and glycosylation pathways. The bottom of the scheme depicts the mAb N‐glycosylation pathway toward producing more mature glycoforms such as the G1F variant shown here.
Figure 3
Figure 3
Relative daily glycoform production for fed‐batch cultures. The major mAb glycoforms are displayed here. Sialylated glycoform species are omitted as there was little to no change in their output. Their data are provided in Supporting Information S1: Figure S4.
Figure 4
Figure 4
Perfusion culture process conditions and metrics. Viable cell density (A), viability (B), glucose content (C) galactose content (D), ammonia content (E) and lactate content (F).
Figure 5
Figure 5
Titer, glycan indices, and glycan precursors for perfusion cultures. Daily reactor titer (A), relative galactosylation index (B) and mannosylation index (C) are shown. The cell‐specific concentration of nucleotide sugar glycan precursors UDP‐Galactose (D) and UDP‐Glucose (E) are shown as well.

Similar articles

References

    1. Aoyama, M. , Hashii N., Tsukimura W., et al. 2019. “Effects of Terminal Galactose Residues in Mannose α1‐6 Arm of FC‐Glycan on the Effector Functions of Therapeutic Monoclonal Antibodies.” mAbs 11, no. 5: 826–836. 10.1080/19420862.2019.1608143. - DOI - PMC - PubMed
    1. Bakalos, G. , and Zintzaras E.. 2019. “Drug Discontinuation in Studies Including a Switch From an Originator to a Biosimilar Monoclonal Antibody: A Systematic Literature Review.” Clinical Therapeutics 41, no. 1: 155–173.e13. 10.1016/j.clinthera.2018.11.002. - DOI - PubMed
    1. Bas, M. , Terrier A., Jacque E., et al. 2019. “Fc Sialylation Prolongs Serum Half‐Life of Therapeutic Antibodies.” Journal of Immunology 202, no. 5: 1582–1594. 10.4049/jimmunol.1800896. - DOI - PubMed
    1. Böhm, S. , Schwab I., Lux A., and Nimmerjahn F.. 2012. “The Role of Sialic Acid as a Modulator of the Anti‐Inflammatory Activity of IgG.” Seminars in Immunopathology 34, no. 3: 443–453. 10.1007/s00281-012-0308-x. - DOI - PubMed
    1. Braasch, K. (2015). Dielectric and Precursor Analysis to Study Metabolic Effects on CHO Cell Viability and Antibody Glycosylation (Vol. 13).

LinkOut - more resources