. 2025 Aug;73(8):1642-1659.
doi: 10.1002/glia.70024. Epub 2025 Apr 18.

The Aquaporin-4 Expression and Localization in the Olfactory Epithelium Modulate the Odorant-Evoked Responses and Olfactory-Driven Behavior

Affiliations

The Aquaporin-4 Expression and Localization in the Olfactory Epithelium Modulate the Odorant-Evoked Responses and Olfactory-Driven Behavior

Donatella Lobraico et al. Glia. 2025 Aug.

Abstract

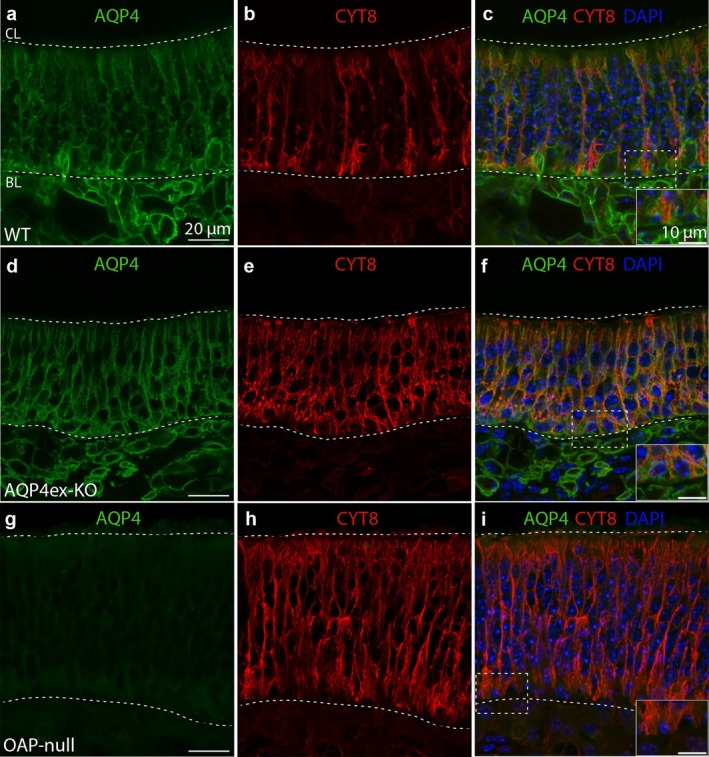
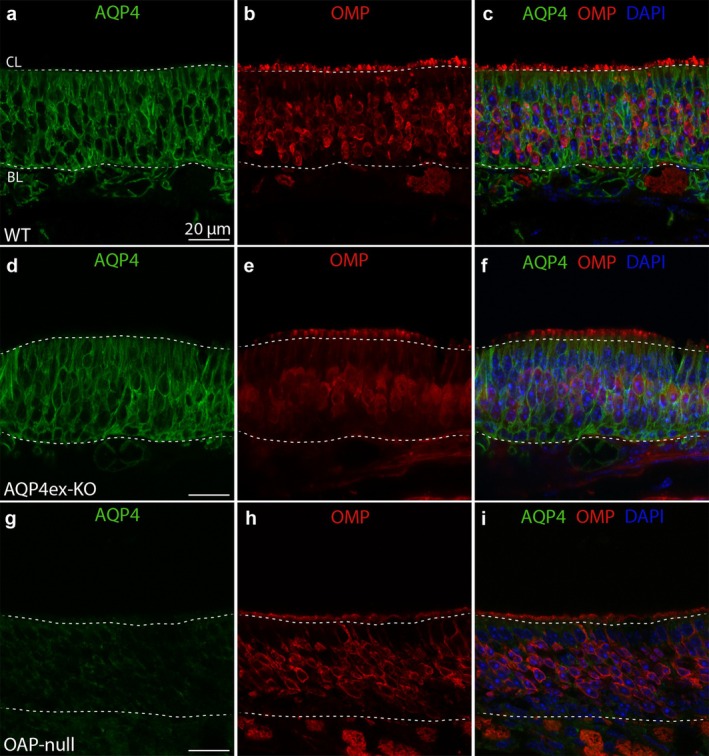
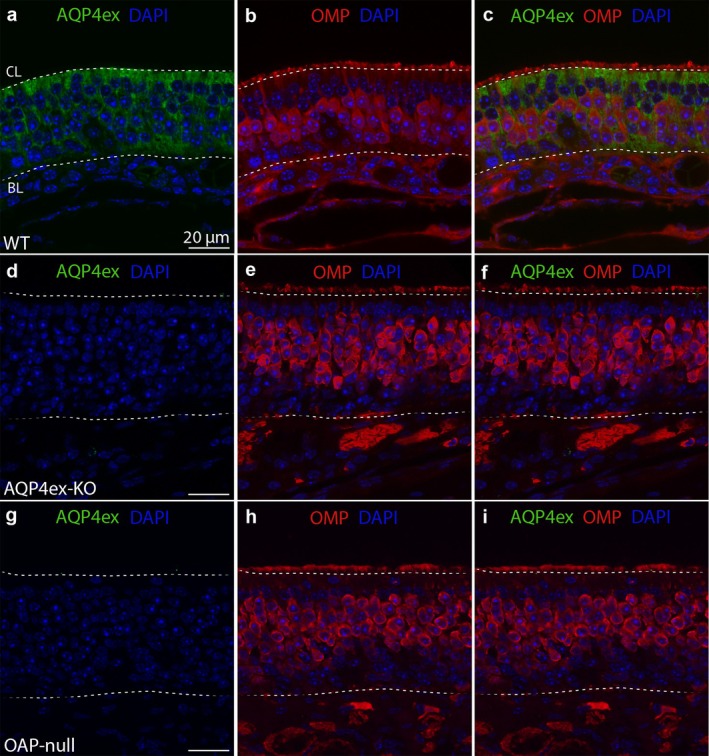
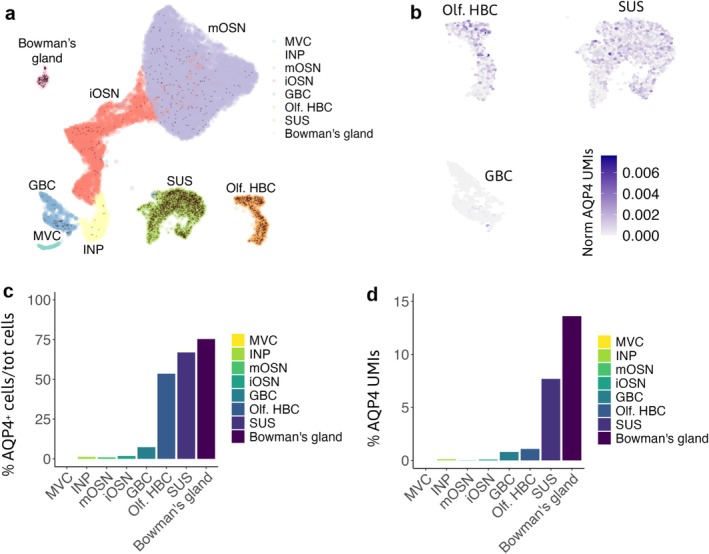
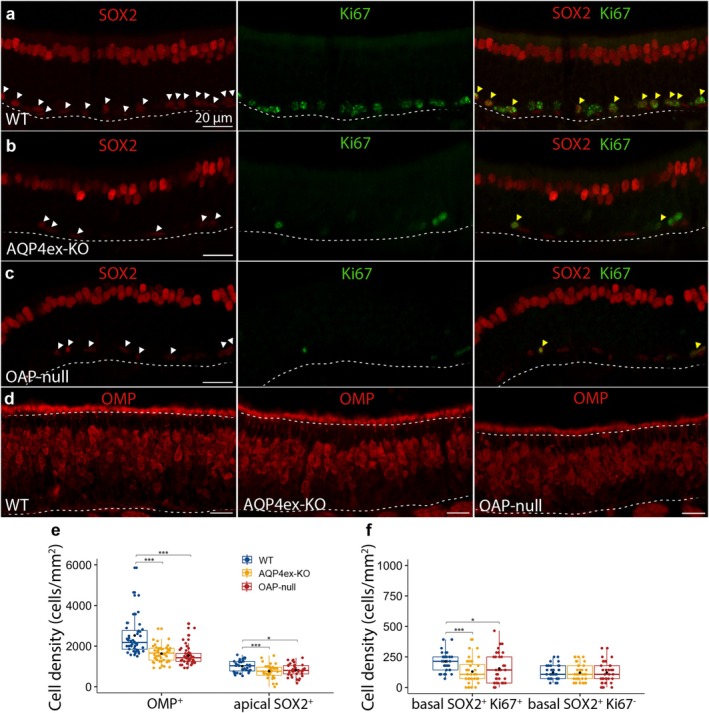
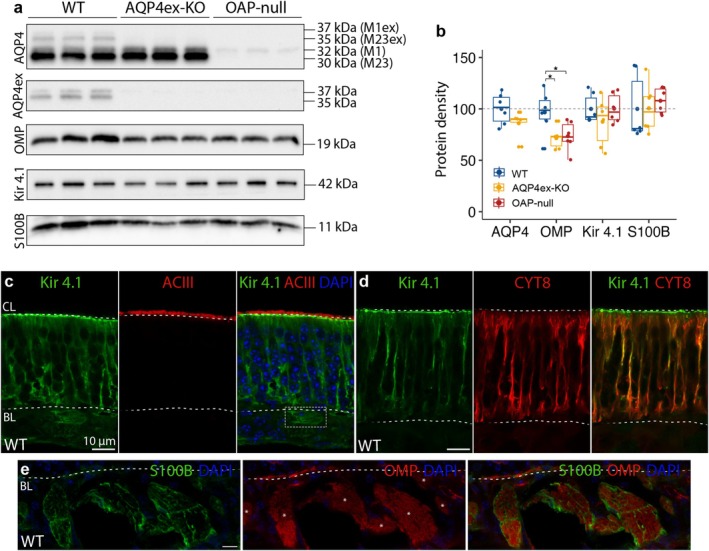
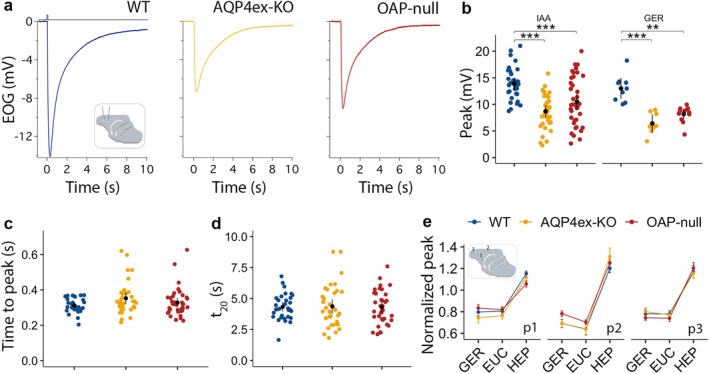
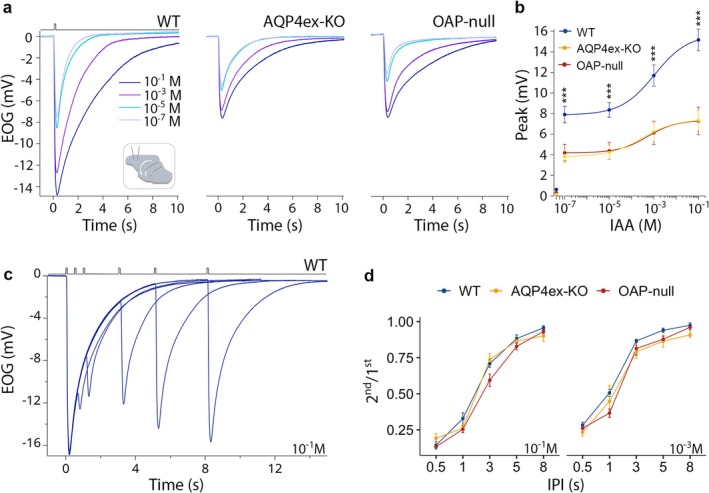
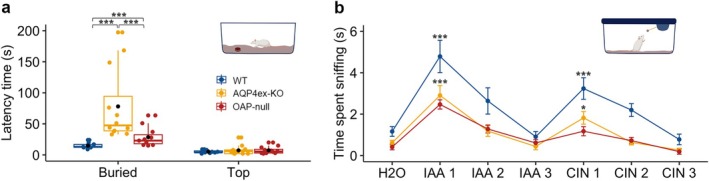
Aquaporin-4 (AQP4) is a water-selective channel expressed in glial cells throughout the central nervous system (CNS). It serves as the primary water channel in the neuropil and plays roles in physiological functions, including regulating water homeostasis by adjusting cell volume and modulating neuronal activity. Different isoforms of AQP4 are expressed in glial-like cells known as sustentacular cells (SUSs) of the olfactory epithelium (OE). Notably, mice lacking all AQP4 isoforms exhibit impaired olfactory abilities. Therefore, we aim to uncover the physiological role of AQP4 isoforms, particularly the AQP4ex isoforms (AQP4M1ex, AQP4M23ex) and the orthogonal array of particles (OAPs)-forming isoform (AQP4M23) in the OE. We investigated the impact of AQP4 isoforms on the OE, observing a reduced number of mature olfactory sensory neurons (OSNs), SUSs, and globose basal cells (GBCs) in mice lacking AQP4ex (AQP4ex-KO) or OAPs (OAP-null). This suggests that AQP4 isoforms are involved in maintaining an optimal microenvironment in the OE, preserving cell density. Next, we explored the role of AQP4 in modulating odorant-evoked responses through electro-olfactogram recordings, where we found reduced odorant responses in mice lacking AQP4 isoforms. Assessments of olfactory ability revealed deficits in odor-guided food-seeking behavior in both AQP4ex-KO and OAP-null mice. Furthermore, AQP4ex-KO mice exhibited a diminished ability to discriminate between different odorants, while OAP-null mice were unable to recognize them as distinct. Overall, our data highlight the role of AQP4 isoforms in modulating neuronal homeostasis, influencing odorant-evoked responses and cell density in the OE, with AQP4ex emerging as a key regulator despite its low abundance.

Keywords: AQP4 isoforms; AQP4M23; AQP4ex; Aquaporin‐4; olfactory epithelium; sustentacular cells.


Conflict of interest statement

The authors declare no conflicts of interest.

Figures

FIGURE 1
FIGURE 1
AQP4 is expressed on the basolateral membrane of the sustentacular cells. (a, d, g) High‐magnification confocal micrographs of coronal sections from WT, AQP4ex‐KO, and OAP‐null mouse olfactory epithelium showing AQP4 expression pattern. The ciliary layer (CL) and the basal lamina (BL) are shown. (b, e, h) Cytokeratin 8 (CYT8) was used to stain the SUSs. (c, f, i) AQP4 staining is confined to the basolateral membrane of the SUSs (inset showing the basal staining of AQP4 and CYT8, surrounding the basal cells). AQP4 is also localized beneath the basal lamina (BL). (g, i) A sharp decrease in the staining is detectable in OAP‐null.
FIGURE 2
FIGURE 2
AQP4 is not expressed in the OSNs. (a, d, g) Confocal micrographs of coronal sections from WT, AQP4ex‐KO, and OAP‐null mouse olfactory epithelium showing AQP4 expression pattern. (b, e, h) OMP was used to stain the OSNs. (c, f, i) AQP4 is not localized in the OSNs. AQP4 staining also surrounds the nuclei of the cells relying on the basal lamina. (g, i) A sharp decrease in the staining is detectable in OAP‐null.
FIGURE 3
FIGURE 3
AQP4ex is localized on the SUSs. (a, d, g) Confocal micrographs of coronal sections from WT, AQP4ex‐KO, and OAP‐null mouse olfactory epithelium show AQP4ex expression patterns. (a–c) AQP4ex is localized on the SUSs, since it wraps the OSNs similarly to AQP4 staining. (d–f) AQP4ex staining is totally abolished in AQP4ex‐KO; (g–i) and it is almost absent in OAP‐null, hence the staining comes from AQP4M1ex isoform, which is almost totally absent.
FIGURE 4
FIGURE 4
mRNA AQP4 expression in the OE cell types. (a) UMAP representation of scRNA‐seq data from the entire OE, colored by cell type (GBC: globose basal cells, INP: immature neuronal progenitors, iOSN: immature OSN, mOSN: mature OSN, MVC: microvillar cells, Olf. HBC: olfactory horizontal basal cells, SUS: sustentacular cells). AQP4+ cells are represented as colored dots. (b) Normalized AQP4 expression in each cell type. The number of transcripts (UMIs) for AQP4 was divided by the total number of UMIs for each cell. (c) Histograms illustrating the mean percentage of AQP4+ cells in each cell type, divided by the total number of cells of that type. (d) Histograms showing the mean percentage of AQP4 UMIs in each cell type. scRNA‐seq data produced by Brann et al. (2020).
FIGURE 5
FIGURE 5
AQP4ex and AQP4M23 deletion affect cell density in the olfactory epithelium. (a, b, c) Coronal sections from WT, AQP4ex‐KO and OAP‐null olfactory epithelium showing SUSs nuclei and basal cells stained with Sox2, and proliferative GBCs stained with Ki67. White arrowheads in the pictures showing SOX2 staining (left), represent all the SOX2+ cells relying on the basal lamina (dashed line). Yellow arrowheads in the pictures showing SOX2 and Ki67 staining (right) represent the SOX2+‐Ki67+ cells. (d) Coronal sections from WT, AQP4ex‐KO and OAP‐null olfactory epithelium showing OMP+ cells. (e, f) Box plots showing cell density in WT and KO mice. The central point represents the mean, central line: Median, upper and lower box boundaries: 25th and 75th percentile, extreme lines: The highest and lowest value. SUSs were counted considering the apical SOX2+ cells. GBCs were counted as basal SOX2+‐Ki67+. Other basal SOX2+‐Ki67 were counted, and they represent quiescent GBCs and/or HBCs. One‐way ANOVA, followed by Tukey test post hoc analysis, or Kruskal–Wallis test followed by Benjamini–Hochberg (BH) post hoc analysis was performed. Anova I performed on apical SOX2+ (genotype: F (2,105) = 6.21, p = 3e−3). Kruskal–Wallis test was applied to OMP+: H (2) = 52.71, p = 3.58e−12. Kruskal–Wallis test was conducted on basal SOX2+ Ki67+: H (2) = 13.39, p = 1.24e−3; p = *0.05, **0.01, ***0.001; n = 3 for each genotype.
FIGURE 6
FIGURE 6
OMP expression is reduced in AQP4ex‐KO and OAP‐null. (a) Western blot was performed on olfactory epithelium proteins: AQP4, AQP4ex, OMP, Kir 4.1, and S100B. Membranes probed with anti‐AQP4 antibody, showing proteins at 30, 32, 35, 37 kDa corresponding to the four AQP4 isoforms. (b) Box plots showing protein density of AQP4, OMP, Kir 4.1, and S100B in WT and KO mice. The central point represents the mean, central line: Median, upper and lower box boundaries: 25th and 75th percentile, extreme lines: The highest and lowest value. One‐way Anova followed by Tukey test post hoc analysis was conducted. In each lane, the intensity of the analyzed band was first normalized to the total protein loaded, visualized by Ponceau staining. Hence, values from all samples were expressed relative to the mean of the WT group and reported as a percentage. Anova I performed on OMP density revealed genotype as the main effect (genotype: F (2,15) = 4.66, p = 2.7e−2; p = *0.05, **0.01, ***0.001; n = 6 per genotype). (c) Confocal micrographs of coronal sections from WT mouse olfactory epithelium showing Kir 4.1 and ACIII (marker of ciliary layer) staining. The ciliary layer and basal lamina (BL) are shown (dashed lines). Kir 4.1 is localized on the SUSs membrane and their microvilli. Kir 4.1 staining is also present beneath the basal lamina, probably expressed by the olfactory ensheathing cells (OECs). (d) Kir 4.1 and CYT8 staining are shown. (e) S100B (marker of the OECs) staining is shown beneath the basal lamina (dashed line). OMP was used to stain the axon bundles (asterisks).
FIGURE 7
FIGURE 7
AQP4 isoforms affect the odorant‐evoked response. (a) Odorant‐evoked EOG responses to 100 ms exposure to isoamyl acetate (10−1 M) were recorded from turbinate IIa of WT (blue), AQP4ex‐KO (yellow) and OAP‐null (red). (b) EOG amplitude response to 10−1 M isoamyl acetate and geraniol. EOG responses are reduced in AQP4ex‐KO and OAP‐null mice; data are presented as mean and ci. Two‐way Anova followed by Tukey test post hoc analysis was conducted. Anova II performed on EOG responses revealed genotype and odor as main effects (genotype: F (2,128) = 27.18, p = 1.46e−10, odor: F (1,128) = 6.58, p = 1.10e−2; p = *0.05, **0.01, ***0.001). (c, d) AQP4 isoforms do not affect the kinetics of the response (data are presented as mean and ci. t 20: 20% decay time, Anova I and Tukey test post hoc analysis was performed; WT = 41 mice in total, AQP4ex‐KO = 43, OAP‐null = 50). (e) EOG responses to 100 ms exposure to geraniol, eucaliptol, and heptaldehyde, all at 10−1 M were recorded from three positions (p1, p2, p3) of turbinate IIa. Peaks are normalized to isoamyl acetate; data are presented as mean ± SE. Linear mixed model performed on normalized EOG responses revealed odorant as main significant effect (odorant: F (2,190.3) = 353.19, p = 2.2e−16) and there were no differences between the three genotypes (WT = 6–9 mice, AQP4ex‐KO = 6–9, OAP‐null = 11–12). EUC: eucaliptol, GER: geraniol, HEP: heptaldehyde, IAA: isoamyl acetate.
FIGURE 8
FIGURE 8
EOG responses from AQP4‐KO mice, recover from adaptation. (a) Odorant‐evoked EOG responses were evoked by 100 ms stimulation with isoamyl acetate vapor of increasing concentrations ranging from 10−1 to 10−7 M recorded from turbinate IIa of WT, AQP4ex‐KO, and OAP‐null mice. (b) EOG amplitude responses are reduced in KO models. EOG responses to air are also shown; data are presented as mean ± SE. A linear mixed model performed on EOG responses to different concentrations revealed genotype, dose, and genotype‐dose interaction as significant effects (genotype: F (2,28.1) = 15.29, p = 3.22e−5, dose: F (3,77.7) = 92.62, p = 2.2e−16, genotype‐dose: F (6,77.7) = 4.42, p = 6.80e−4; p = *0.05, **0.01, ***0.001), nonetheless, there is no difference in genotype‐dose when EOG responses are normalized to the higher dose used; WT = 9 mice, AQP4ex‐KO = 11, OAP‐null = 9. (c) Paired pulse odorant responses evoked by 100 ms stimulation with different interpulse intervals (IPI: 0.5, 1, 3, 5, 8 s) to 10−1 M isoamyl acetate (IAA) from WT. (d) Ratio of response to the second stimulus to the first one ± SEM at the indicated odorant concentration plotted versus the IPI; data are presented as mean ± SE. A linear mixed model performed on the 2nd/1st response revealed ipi, dose, and ipi‐dose interaction as main significant effects (ipi: F (4,149.9) = 787.94, p = 2.2e−16, dose: F (1,153.3) = 69.49, p = 4.09e−14, ipi‐dose: F (4,149.9) = 7.54, p = 1.46e−5); WT = 7 mice, AQP4ex‐KO = 6, OAP‐null = 8.
FIGURE 9
FIGURE 9
AQP4 isoforms affect olfactory abilities and discrimination. (a) Latency time in finding the cookie buried or placed on top of the bedding. AQP4ex‐KO and OAP‐null mice are slower than WT in finding the cookie. The central point in the box plots represents the mean, central line: Median, upper and lower box boundaries: 25th and 75th percentile, extreme lines: The highest and lowest value. Kruskal–Wallis test followed by Benjamini‐Hochberg (BH) post hoc analysis was performed on buried cookie: H (2) = 21.74, p = 1.91e−5; p = *0.05, **0.01, ***0.001; WT = 10 mice, AQP4ex‐KO = 12, OAP‐null = 12. (b) Time spent sniffing the new odorant within 2 min after the odorant was previously presented. IAA and CIN were used at 1:100. A linear mixed model revealed genotype and odorant as main significant effects (genotype: F (2,72.1) = 30.71, p = 4.354e−14, odorant: F (6,182.8) = 30.77, p = 2.2e−16). The statistical differences are to be interpreted as the difference between H2O and IAA1, and IAA3 and CIN1 for every genotype. There are no differences between IAA3 and CIN1 in OAP‐null; instead, AQP4ex‐KO is different from WT (p = *0.05). Data are presented as mean ± SE; WT = 10 mice, AQP4ex‐KO = 10, OAP‐null = 10. CIN: 1,4 cineole, IAA: isoamyl acetate.

Similar articles

References

    1. Ablimit, A. , Aoki T., Matsuzaki T., et al. 2008. “Immunolocalization of Water Channel Aquaporins in the Vomeronasal Organ of the Rat: Expression of AQP4 in Neuronal Sensory Cells.” Chemical Senses 33, no. 5: 481–488. 10.1093/chemse/bjn015. - DOI - PubMed
    1. Ablimit, A. , Matsuzaki T., Tajika Y., Aoki T., Hagiwara H., and Takata K.. 2006. “Immunolocalization of Water Channel Aquaporins in the Nasal Olfactory Mucosa.” Archives of Histology and Cytology 69, no. 1: 1–12. 10.1679/aohc.69.1. - DOI - PubMed
    1. Acevedo, C. , Blanchard K., Bacigalupo J., and Vergara C.. 2019. “Possible ATP Trafficking by ATP‐Shuttles in the Olfactory Cilia and Glucose Transfer Across the Olfactory Mucosa.” FEBS Letters 593, no. 6: 601–610. 10.1002/1873-3468.13346. - DOI - PubMed
    1. Afhami Mina, M. , Hashemi K., Afshari J., et al. 2018. “Acute Transplantation of Human Olfactory Mucosa‐Derived Olfactory Ensheathing Cells Fails to Improve Locomotor Recovery in Rats.” Acta Medica Iranica 56, no. 7.
    1. Agostinelli, E. , Gonzalez‐Velandia K. Y., Hernandez‐Clavijo A., et al. 2021. “A Role for STOML3 in Olfactory Sensory Transduction.” Eneuro 8, no. 2: ENEURO.0565‐20.2021. 10.1523/ENEURO.0565-20.2021. - DOI - PMC - PubMed