. 2025 Jun;80(6):1797-1800.
doi: 10.1111/all.16553. Epub 2025 Apr 19.

Circulating Mast Cell Progenitors Are Depleted by Benralizumab in Severe Asthma

Affiliations

Circulating Mast Cell Progenitors Are Depleted by Benralizumab in Severe Asthma

Michael Fricker et al. Allergy. 2025 Jun.
No abstract available

Keywords: asthma; benralizumab; eosinophils; interleukin; mast cells; mepolizumab; progenitors; severe asthma; type 2 inflammation.


Conflict of interest statement

M.F. reports research funding from GSK. J.H. has received honoraria from GSK, AstraZeneca, and Novartis. S.A.H. declares no conflicts of interest. P.G.G. reports personal fees from AstraZeneca, Chiesi, GSK, Novartis, and Sanofi and grants from AstraZeneca and GSK.

Figures

FIGURE 1
FIGURE 1
Benralizumab but not mepolizumab treatment depletes IL5R‐expressing mast cell progenitors. Mast cell progenitors (MCPs) expressed as % CD45+ cells (A) in non‐eosinophilic asthma (NEA, n = 23, red), eosinophilic asthma (EA, n = 32, black) and mepolizumab‐treated severe asthma (n = 25, green). Lines and error bars represent the median and interquartile range. ns = not significant (Kruskal–Wallis test). Comparison of the effect of mepolizumab (purple line) and benralizumab (blue line) treatment over time on total MCP proportion (B). Lines and error bars in (B) are median and interquartile range. **p ≤ 0.01; ***p ≤ 0.001 (linear mixed models analysis). MCPs (left hand panel) and FCER1A‐negative non‐MCPs (right hand panel) were analyzed by flow cytometry for relative surface expression of IL5 receptor α (IL5RA) or IL4RA compared to a Fluorescence Minus One (FMO) control in the same fluorescent channel (BV421) (C). Relative proportion of MCPs (purple) or non‐MCPs (blue) with detectable IL5RA expression (D) in samples from the cross‐sectional study (v1). Comparison of median fluorescence intensity (MFI) values for CD117 (E) and FCER1A (F) between IL5R+ (blue) and IL5R (purple) MCPs in samples from the cross‐sectional study (v1). Lines and error bars in (D–F) are median and interquartile range. ***p ≤ 0.001 (Mann–Whitney test). Comparison of the effect of mepolizumab (purple line) and benralizumab (blue line) treatment over time on IL5R+ (G) and IL5R (H) MCP proportion. Lines and error bars in (G, H) are median and interquartile range. **p ≤ 0.01; ***p ≤ 0.001 (linear mixed models analysis). Correlation (Spearman's) of total MCP number vs. decrease in Asthma Control Questionnaire 5‐item (ACQ5) score between v1 and v3 in EA participants who commenced mepolizumab or benralizumab treatment subsequent to v1 (I).
FIGURE 2
FIGURE 2
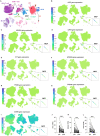
Identification of an MCP signature gene panel, which is depleted by benralizumab treatment in severe asthma. CELLxGENE plot of 836,148 individual blood cell single‐cell transcriptomes from donors with COVID‐19, influenza, and non‐infected controls, with major immune cell populations indicated, including CD34+, CD117+, FCER1A+ MCPs (A). Relative gene expression overlaid on plot A for candidate MCP genes HDC (histidine decarboxylase), MS4A2 (high affinity immunoglobulin epsilon receptor subunit beta), CPA3 (carboxypeptidase 3), KIT (tyrosine‐protein kinase KIT), HPGDS (hematopoietic prostaglandin D synthase), TPSB2 (tryptase beta‐2), TPSAB1 (tryptase alpha/beta 1) and SRGN (serglycin), with MCPs displayed in the inset (B–I). Whole blood bulk RNA sequencing‐quantified mRNA abundance for HDC, MS4A2, and CPA3 pre‐ and post‐4 months of benralizumab treatment in n = 41 severe asthma patients (J–L). CM, classical monocyte; DC, dendritic cell; gdT, gamma‐delta T cell; HSC, hematopoietic stem cell; MAIT, mucosal‐associated invariant T cells; MEP, megakaryocyte‐erythroid progenitor; NCM, non‐classical monocyte; NK, natural killer. ****p ≤ 0.0001.

References

    1. Winter N. A., Qin L., Gibson P. G., et al., “Sputum Mast Cell/Basophil Gene Expression Relates to Inflammatory and Clinical Features of Severe Asthma,” Journal of Allergy and Clinical Immunology 148, no. 2 (2021): 428–438. - PubMed
    1. Dahlin J. S., Malinovschi A., Ohrvik H., et al., “Lin‐ CD34hi CD117int/Hi FcepsilonRI+ Cells in Human Blood Constitute a Rare Population of Mast Cell Progenitors,” Blood 127, no. 4 (2016): 383–391. - PMC - PubMed
    1. Alvarado‐Vazquez P. A., Mendez‐Enriquez E., Salomonsson M., et al., “Targeting of the IL‐5 Pathway in Severe Asthma Reduces Mast Cell Progenitors,” Journal of Allergy and Clinical Immunology 155 (2024): 1310–1320. - PubMed
    1. Fricker M., Harrington J., Hiles S. A., and Gibson P. G., “Mepolizumab Depletes Inflammatory but Preserves Homeostatic Eosinophils in Severe Asthma,” Allergy 79, no. 11 (2024): 3118–3128. - PubMed
    1. Wu C., Boey D., Bril O., et al., “Single‐Cell Transcriptomics Reveals the Identity and Regulators of Human Mast Cell Progenitors,” Blood Advances 6, no. 15 (2022): 4439–4449. - PMC - PubMed

Grants and funding

LinkOut - more resources