. 2025 Jun;80(6):1647-1668.
doi: 10.1111/all.16551. Epub 2025 Apr 19.

Asthma Alleviation by Ginsenoside Rb1 via Promotion of Treg Proliferation and Inflammatory T Cell Inhibition

Affiliations

Asthma Alleviation by Ginsenoside Rb1 via Promotion of Treg Proliferation and Inflammatory T Cell Inhibition

Susanna Choi et al. Allergy. 2025 Jun.

Abstract

Background: Regulatory T cells (Tregs) are living drugs with feasibility, tolerability, and therapeutic benefits. Although Tregs are linked to asthma prognosis through inflammation regulation, no therapeutic agents specifically designed to manage asthma by upregulating Tregs have been developed to date.

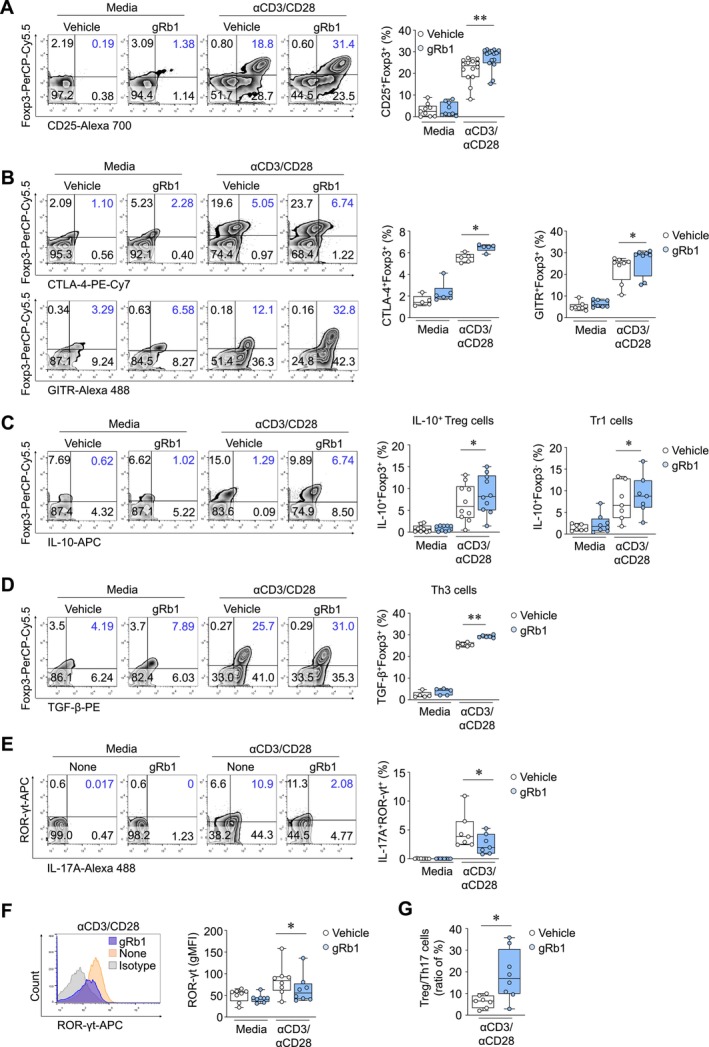
Methods: We screened a library of 250 natural products using a cytometric bead array. Among the selected candidates, gRb1 was identified for further investigation. The effects of gRb1 on Treg and Th17 populations were evaluated in mouse asthma models and human PBMCs from both healthy donors and asthma patients using flow cytometry and cytokine analysis.

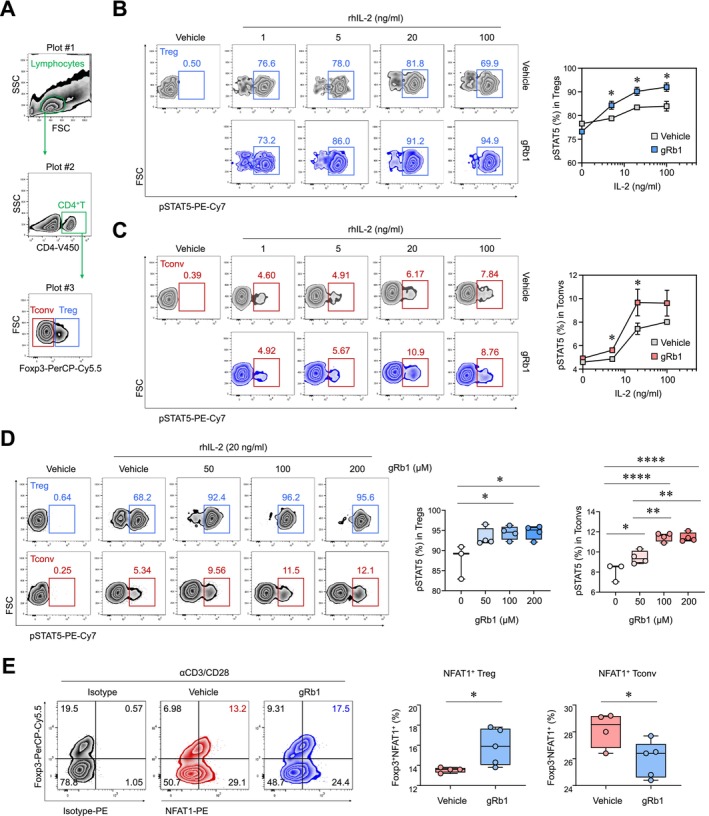
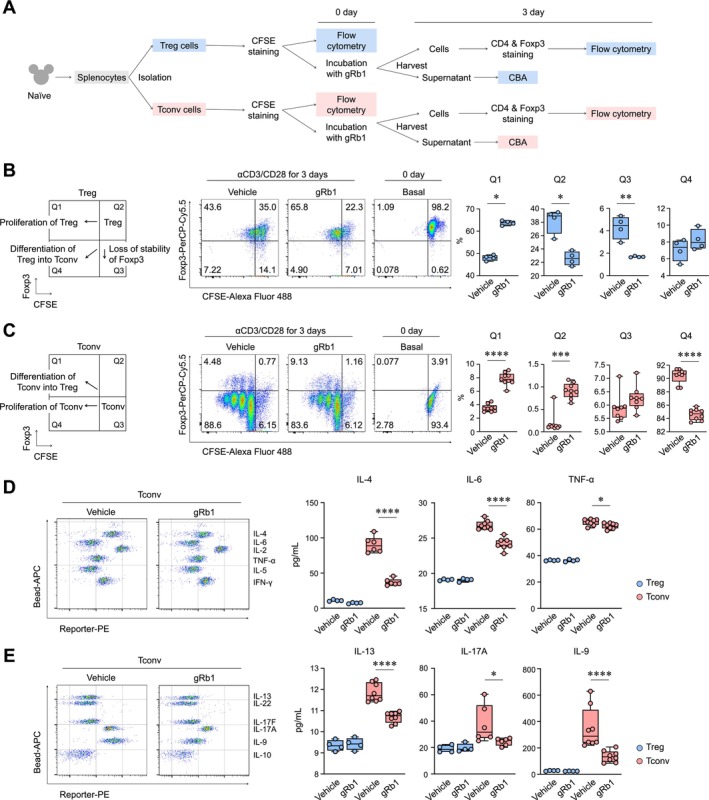
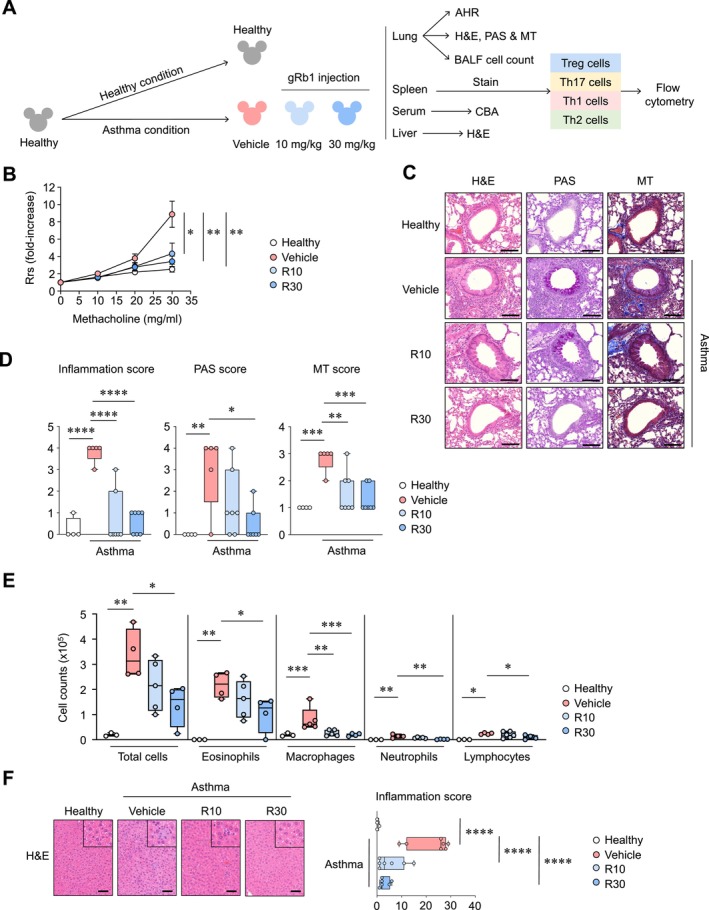
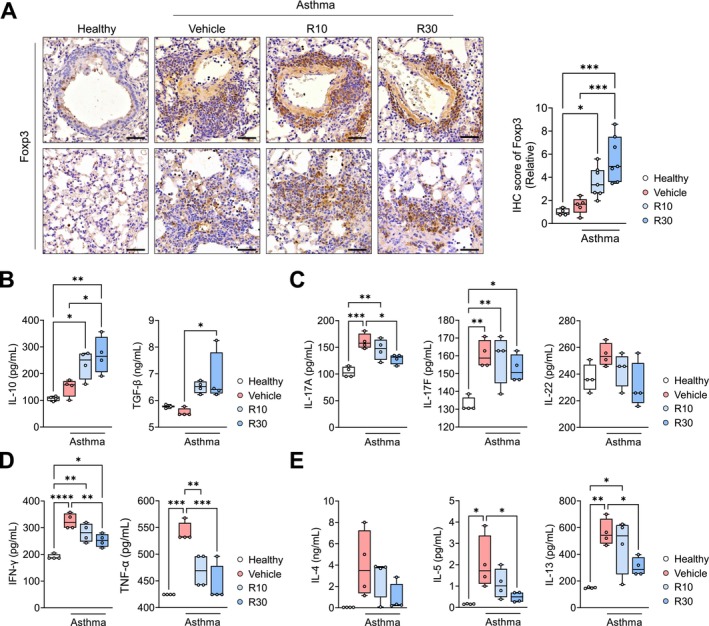
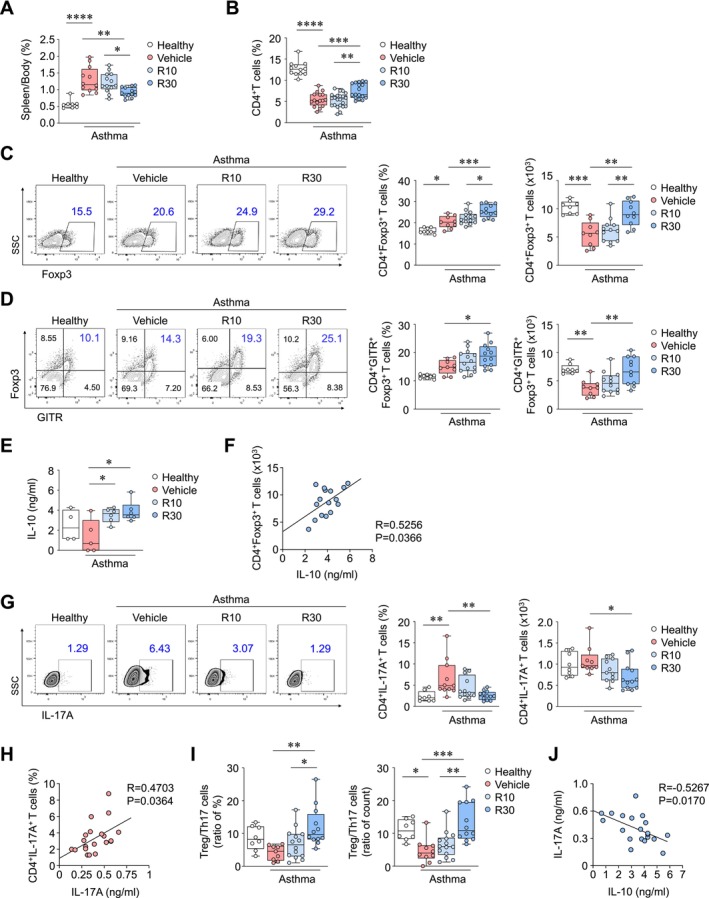
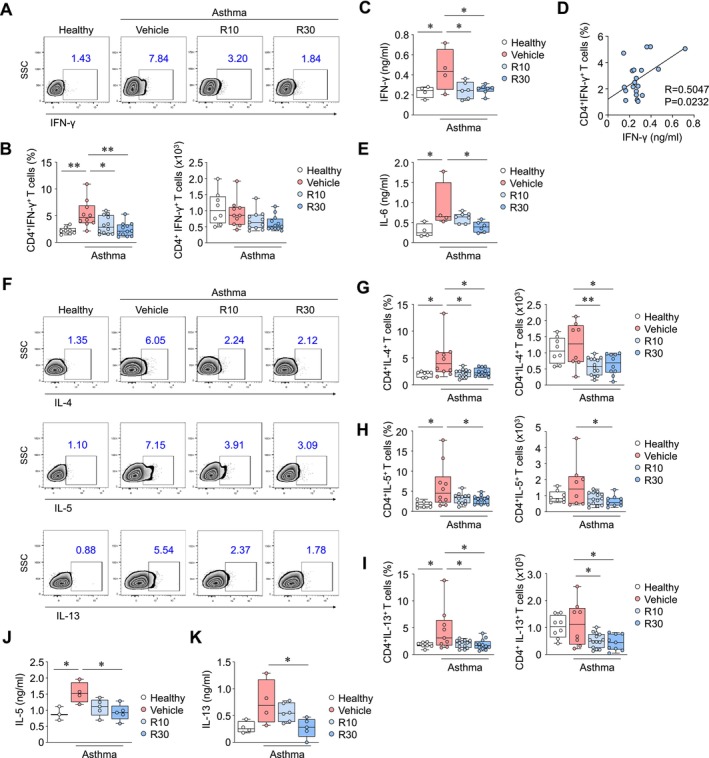
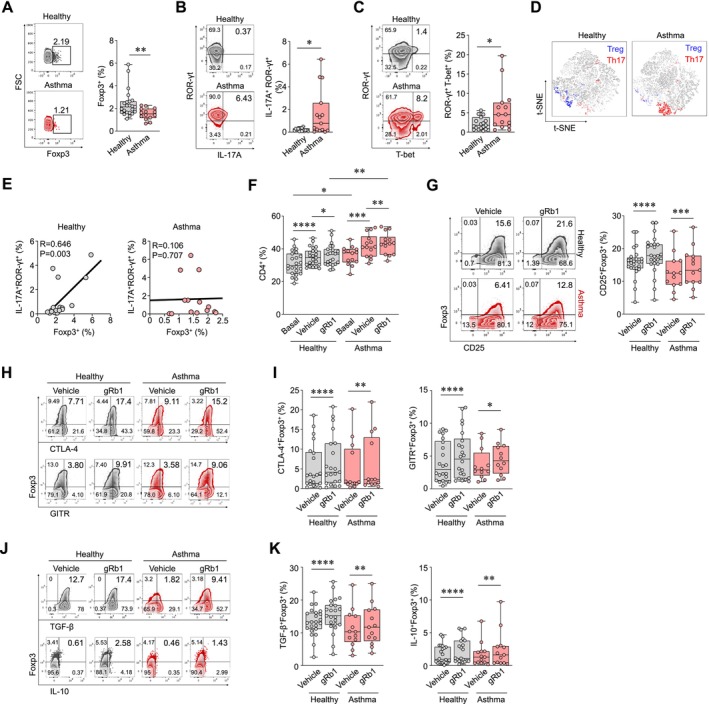
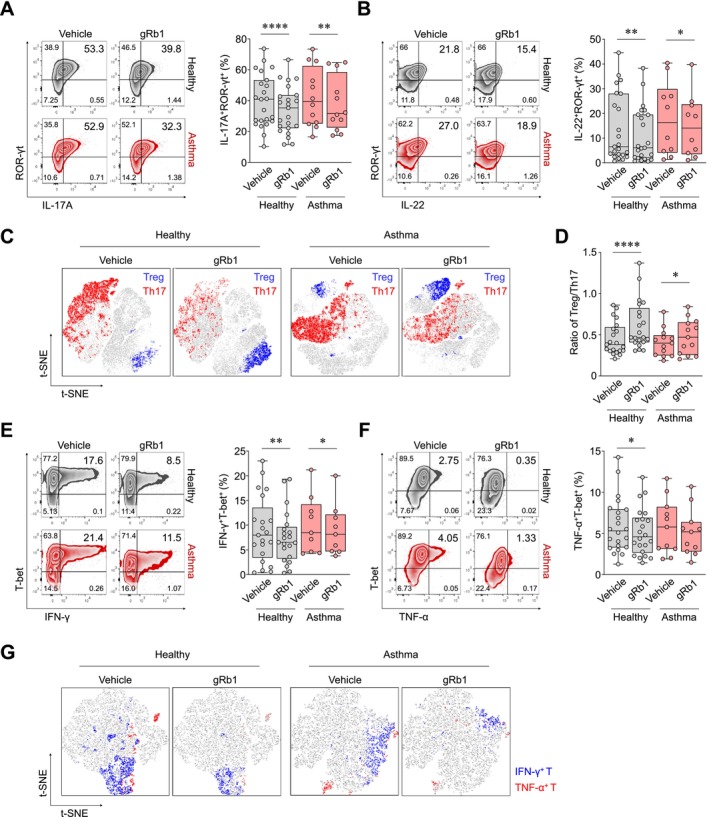
Results: In inflammatory conditions, ginsenoside Rb1 (gRb1, a major ginseng component) increased IL-10- and TGF-β-expressing Treg populations and decreased the Th17 population; activated phospho-STAT5 and NFAT1 in Tregs; inhibited NFAT1 activation in conventional T cells (Tconvs); increased Treg proliferation and Tconv-Treg differentiation, inhibiting Tconv proliferation; and reduced inflammatory cytokine secretion by Tconvs. In asthma model mice, suppression of asthma symptoms by gRb1 was associated with elevated Treg and lower Th17, Th1, and Th2 counts. gRb1 treatment of stimulated PBMCs from patients with asthma and healthy donors increased IL-10- and TGF-β-expressing Treg populations and decreased IL-17A-, IL-22-, IFN-γ-, and TNF-α-expressing T-cell populations.

Conclusions: gRb1 alleviate asthma by shifting the Treg-inflammatory T cell balance. These findings suggest a strategy for enhancing Treg activity through treatment with gRb1. This may provide a novel therapeutic approach for asthma and related disorders.

Keywords: Panax ginseng; Treg; asthma; ginsenoside Rb1; inflammation; screening.


Conflict of interest statement

The authors declare no conflicts of interest.

Figures

FIGURE 1
FIGURE 1
gRb1 promotes Treg over Th17 cell identity in mouse splenocytes. (A–G) Splenocytes isolated from naïve mice were stimulated with anti‐CD3/CD28 antibody‐coupled beads in the presence of gRb1 (100 μM) or vehicle control for 3 days. After 3 days, the cells were treated with a protein transport inhibitor for 3 h and then harvested. (A‐E) Representative plots illustrating the proportion of CD25+Foxp3+ (A), CTLA‐4+Foxp3+ and GITR+Foxp3+ (B), IL‐10+Foxp3+ (C), TGF‐β+Foxp3+ (D), and IL‐17+ROR‐γt+ T cells (E), among the CD4+ T cells. Mann–Whitney U test. (F) Representative plots of ROR‐γt expression in CD4+ T cells. Mann–Whitney U test. (G) Ratio of Tregs to Th17 cells. Mann–Whitney U test. *p < 0.05, **p < 0.01. The data are representative of at least three separate experiments. The box in a box‐and‐whisker plot extends from the 25th to the 75th percentile, and the whiskers are plotted from the minimum to the maximum. It also plots each individual value as a point overlaid on the graph; n = 5–15 animals in each group. gRb1, ginsenoside Rb1; Treg, Regulatory T; Foxp3, Forkhead Box P3; CD, Cluster of Differentiation; CTLA‐4, Cytotoxic T‐Lymphocyte Antigen 4; GITR, Glucocorticoid‐Induced Tumor Necrosis Factor Receptor; IL, Interleukin; TGF‐β, Transforming Growth Factor β; Tr1, Type 1 Regulatory T; Th3, T Helper 3; ROR‐γt, Retinoic Acid Receptor‐Related Orphan Receptor γ t; gMFI, geometric mean fluorescence intensity.
FIGURE 2
FIGURE 2
gRb1 increases STAT5 phosphorylation and NFAT1 activation in Tregs. Splenocytes from naïve mice were stimulated with rhIL‐2 in the presence of gRb1 or vehicle control for 15 min. (A) Live lymphocytes were selected based on FSC and SSC (Plot #1). CD4+ T cells were identified by CD4 staining (Plot #2). Finally, Tregs and Tconvs were identified by Foxp3 expression in CD4+ T cells (Plot #3). (B and C) Frequencies of pSTAT5+ cells among Tregs (blue gate) (B) and Tconvs (red gate) (C) stimulated with rhIL‐2 (1–100 ng/mL) in the presence of gRb1 (100 μM) or vehicle. The percentages of pSTAT5+ cells are shown in the line graphs (n = 4 mice per group). One‐way ANOVA with Tukey's test. Bars indicate the mean ± SEM. (D) Representative plots illustrating frequencies of pSTAT5+ cells among Tregs (blue gate) and Tconvs (red gate) stimulated with rhIL‐2 (20 ng/mL) in the presence of gRb1 (50–200 μM) or vehicle. One‐way ANOVA with Tukey's test. (E) Plots illustrating NFAT1+Foxp3+ (NFAT1+ Tregs) and NFAT1+Foxp3 (NFAT1+ Tconvs) proportions among CD4+ cells. The box‐and‐whisker plots present the percentages of NFAT1+ Tregs (left) and NFAT1+ Tconvs (right). Mann–Whitney U test, *p < 0.05, **p < 0.01, ****p < 0.0001. The data are representative of two separate experiments. The box in a box‐and‐whisker plot extends from the 25th to the 75th percentile, and the whiskers are plotted from the minimum to the maximum. It also plots each individual value as a point overlaid on the graph; n = 3–5 animals in each group. gRb1, ginsenoside Rb1; SSC, Side Scatter; FSC, Forward Scatter; CD, Cluster of Differentiation; Foxp3, Forkhead Box P3; pSTAT5, phospho‐Signal Transducer and Activator of Transcription 5; IL, Interleukin; Tregs, Regulatory T Cells; Tconvs, Conventional T cells; rhIL‐2, recombinant human IL‐2; NFAT1, Nuclear Factor of Activated T‐cells 1.
FIGURE 3
FIGURE 3
gRb1 stimulates Treg proliferation while inhibiting inflammatory cytokine expression. (A) Workflow of the Treg and Tconv proliferation and differentiation assays. Tregs and Tconvs were isolated from splenocytes, stained with CFSE, and cultured with anti‐CD3/CD28 Ab in the presence of gRb1 or vehicle control for 3 days, after which cells and supernatants were collected. Cells were stained for CD4 and Foxp3 and subjected to flow cytometry. Cytokine levels in the supernatants were measured using CBA analysis. (B) Representative plots illustrating CFSE‐stained CD4+CD25+ (Treg) levels (right); Q1–Q4 are defined on the left. Mann–Whitney U test. (C) Representative plots illustrating CFSE‐stained CD4+CD25 (Tconv) counts (right); Q1–Q4 are defined on the left. Mann–Whitney U test. (D and E) Representative plots illustrating cytokine expression in the Treg and Tconv culture supernatants. Mann–Whitney U test, **p < 0.05, **p < 0.01, ****p < 0.0001. The data are representative of three separate experiments. The box in a box‐and‐whisker plot extends from the 25th to the 75th percentile, and the whiskers are plotted from the minimum to the maximum. It also plots each individual value as a point overlaid on the graph; n = 4–9 animals in each group. Treg, Regulatory T; Tconv, Conventional T; CFSE, Carboxyfluorescein Succinimidyl Ester; CD, Cluster of Differentiation; Foxp3, Forkhead Box P3; CBA, Cytometric Bead Array; gRb1, ginsenoside Rb1; IL, Interleukin; TNF‐α, Tumor Necrosis Factor α; IFN‐γ, Interferon γ.
FIGURE 4
FIGURE 4
gRb1 protects against asthma by inhibiting lung inflammation. (A) The asthma model was established by first sensitizing the mice via intraperitoneal injection of OVA mixed with Al(OH)3. One week later, an additional injection was administered under the same conditions. OVA was then injected intranasally on days 14, 15, 16, and 17 after first sensitization. gRb1 treatment was administered by daily intraperitoneal injection from days 1 to 17. (B) Airway hyperresponsiveness in response to increasing doses of methacholine in mouse groups. Two‐way ANOVA with Tukey's test. Bars indicate the mean ± SEM. (C and D) Tissue inflammation, goblet cell metaplasia, and fibrosis in H&E‐, PAS‐ and MT‐stained lung tissue sections, respectively. Scale bar, 100 μm. One‐way ANOVA with Tukey's test. (E) Eosinophil, macrophage, neutrophil, lymphocyte, and total cell counts in BALF samples. One‐way ANOVA with Tukey's test. (F) Liver tissue inflammation scores based on H&E staining. Scale bar, 200 μm. One‐way ANOVA with Tukey's test. *p < 0.05, **p < 0.01, ***p < 0.005, ****p < 0.0001. Each point within the graph represents one mouse. The box in a box‐and‐whisker plot extends from the 25th to the 75th percentile, and the whiskers are plotted from the minimum to the maximum. It also plots each individual value as a point overlaid on the graph; n = 4–7 animals in each group. OVA, Ovalbumin; Healthy, healthy mouse group; Vehicle, vehicle‐treated asthma model group; R10, 10 mg/kg ginsenoside Rb1‐treated asthma model group; R30, 30 mg/kg ginsenoside Rb1‐treated asthma model group; Asthma, asthma model group; gRb1, ginsenoside Rb1; AHR, Airway Hyperresponsiveness; H&E, Hematoxylin & Eosin; PAS, Periodic Acid–Schiff; MT, Masson's Trichrome; BALF, Bronchoalveolar Lavage Fluid; CBA, Cytometric Bead Array; Treg, Regulatory T; Th, T Helper; Rrs, Total resistance of the respiratory system.
FIGURE 5
FIGURE 5
gRb1 elevates Foxp3 expression in lung tissue and modulates cytokine levels in BALF. (A) Representative images of Foxp3 staining in lung tissues and the corresponding IHC scores. (B‐E) Cytokine concentrations in BALF. One‐way ANOVA with Tukey's test. *p < 0.05, **p < 0.01, ***p < 0.005. The box in a box‐and‐whisker plot extends from the 25th to the 75th percentile, and the whiskers are plotted from the minimum to the maximum. It also plots each individual value as a point overlaid on the graph; n = 3–5 animals in each group. gRb1, ginsenoside Rb1; Healthy, healthy mouse group; Vehicle, vehicle‐treated asthma‐induced group; R10, ginsenoside Rb1 (10 mg/kg)‐treated asthma‐induced group; R30, ginsenoside Rb1 (30 mg/kg)‐treated asthma‐induced group; Asthma, asthma‐induced mouse group, Foxp3, Forkhead Box P3; IHC; immunohistochemistry, BALF; bronchoalveolar lavage fluid, IL, Interleukin; IFN‐γ, Interferon γ; TNF‐α, Tumor Necrosis Factor α.
FIGURE 6
FIGURE 6
gRb1 increases Treg and decreases Th17 cell proportions and counts in asthma model mice. (A) The ratio of spleen weight to body weight. One‐way ANOVA with Tukey's test. (B) Percentage of CD4+ T cells in total splenocytes. One‐way ANOVA with Tukey's test. (C and D) Representative plots of Foxp3+ T (C) and GITR+Foxp3+ T cell (D) proportions among splenic CD4+ T cells. One‐way ANOVA with Tukey's test. (E) IL‐10 expression in serum. One‐way ANOVA with Tukey's test. (F) Correlation between serum IL‐10 levels and Foxp3+ T‐cell counts. Linear regression and nonparametric (Spearman) correlation. (G) Representative plots of IL‐17+ T cell proportion among splenic CD4+ T cells. One‐way ANOVA with Tukey's. (H) Correlation between serum IL‐17 and the percentage of IL‐17+ T cells. Linear regression and nonparametric (Spearman) correlation. (I) Ratio of Tregs to Th17 cells as percentages (left) and counts (right). One‐way ANOVA with Tukey's test. (J) Correlation between serum IL‐10 and IL‐17A levels. Linear regression and nonparametric (Spearman) correlation. *p < 0.05, **p < 0.01, ***p < 0.005, ****p < 0.0001. Each point within the graph represents one mouse. The box in a box‐and‐whisker plot extends from the 25th to the 75th percentile, and the whiskers are plotted from the minimum to the maximum. It also plots each individual value as a point overlaid on the graph; n = 4–16 animals in each group. Healthy, healthy mouse group; Vehicle, vehicle‐treated asthma model group; R10, 10 mg/kg ginsenoside Rb1‐treated asthma model group; R30, 30 mg/kg ginsenoside Rb1‐treated asthma model group; Asthma, asthma model group; SSC, Side Scatter; gRb1, ginsenoside Rb1; CD, Cluster of Differentiation; Foxp3, Forkhead Box P3; GITR, Glucocorticoid‐Induced Tumor Necrosis Factor Receptor; IL, Interleukin.
FIGURE 7
FIGURE 7
gRb1 reduces Th1 and Th2 cell proportions and counts in asthma model mice. (A and B) Representative plots of IFN‐γ+ T cell counts among splenic CD4+ T cells. One‐way ANOVA with Tukey's test. (C) Serum IFN‐γ expression. One‐way ANOVA with Tukey's test. (D) Correlation between serum IFN‐γ and percentage of IFN‐γ+ T cells. Linear regression and nonparametric (Spearman) correlation. (E) Serum IL‐6 expression. One‐way ANOVA with Tukey's test. (F‐I) Representative plots of IL‐4+, IL‐5+, and IL‐13+ T cell populations among splenic CD4+ T cells. One‐way ANOVA with Tukey's test. (J and K) Serum IL‐5 and IL‐13 expression. One‐way ANOVA with Tukey's test. *p < 0.05, **p < 0.01, ***p < 0.005, ****p < 0.0001. Each point within the graph represents one mouse. The box in a box‐and‐whisker plot extends from the 25th to the 75th percentile, and the whiskers are plotted from the minimum to the maximum. It also plots each individual value as a point overlaid on the graph; n = 4–12 animals in each group. Healthy, healthy mouse group; Vehicle, vehicle‐treated asthma model group; R10, 10 mg/kg ginsenoside Rb1‐treated asthma model group; R30, 30 mg/kg ginsenoside Rb1‐treated asthma model group; Asthma, asthma model group; gRb1, ginsenoside Rb1; IFN‐γ, Interferon γ; CD, Cluster of Differentiation; IL, Interleukin.
FIGURE 8
FIGURE 8
gRb1 increases TGF‐β‐ and IL‐10‐expressing Tregs in PBMCs from both patients with asthma and healthy donors. (A‐C) Representative plots and box‐and‐whisker plots showing frequencies of Foxp3+ (A), IL‐17A+ROR‐γt+ (B), and ROR‐γt+T‐bet+ (C) in CD4+ T cells among PBMCs from patients with asthma and healthy donors, Mann–Whitney U test. All zebra plots show percentages of CD4+ T cells. (D) Composition of Tregs and Th17 cells from patients with asthma and healthy donors. t‐SNE was generated by FlowJo among concatenated representative healthy donors and patients with asthma. Tregs are defined as Foxp3+‐gated cells, and Th17 cells are defined as IL‐17A+ROR‐γt+‐gated CD4+ T cells. (E) Correlation between Tregs and Th17 cells in patients with asthma and healthy donors. Linear regression and nonparametric (Spearman) correlation. (F‐K) PBMCs from healthy donors and patients with asthma were stimulated with anti‐CD2/CD3/CD28 antibody‐coupled beads in the presence of gRb1 (100 μM) or vehicle control for 3 days. After 3 days, the cells were treated with a protein transport inhibitor for 3 h and then harvested. (F) Percentage of live CD4+ T cells. One‐way ANOVA with Tukey's test for multiple comparisons. (G) Representative plots of CD25+Foxp3+ T cells. Wilcoxon signed‐rank test. (H and I) Representative plots of CTLA4+Foxp3+ and GITR+Foxp3+ T cells. Wilcoxon signed‐rank test. (J and K) Representative plots of TGF‐β+ Foxp3+ T cells and IL‐10+Foxp3+ T cells. One‐way ANOVA with Tukey's test. *p < 0.05, **p < 0.01, ***p < 0.005, ****p < 0.0001. Each point within the graph represents one individual. The box in a box‐and‐whisker plot extends from the 25th to the 75th percentile, and the whiskers are plotted from the minimum to the maximum. It also plots each individual value as a point overlaid on the graph; n = 12–23 in each group. PBMC, peripheral blood mononuclear cell; gRb1, ginsenoside Rb1; Healthy, healthy donor; Asthma, patient with asthma; Foxp3, Forkhead Box P3; ROR‐γt, Retinoic Acid Receptor‐Related Orphan Receptor γ t; IL, Interleukin; T‐bet, T‐box transcription factor TBX21; t‐SNE, t‐distributed Stochastic Neighbor Embedding; CD, Cluster of Differentiation; CTLA‐4, Cytotoxic T‐Lymphocyte Antigen 4; GITR, Glucocorticoid‐Induced Tumor Necrosis Factor Receptor; TGF‐β, Transforming Growth Factor β.
FIGURE 9
FIGURE 9
gRb1 decreases IL‐17A‐, IL‐22‐, IFN‐γ‐, and TNF‐α‐expressing T cell in PBMCs from both patients with asthma and healthy donors. (A, B, E, and F) Representative plots of IL‐17A+ROR‐γt+ (A), IL‐22+ROR‐γt+ (B), IFN‐γ+T‐bet+ (E), and TNF‐α+T‐bet+ T cell proportions (F). Wilcoxon matched‐pairs signed‐rank test. (C) gRb1 treatment altered the proportions of Tregs and Th17 cells in PBMCs from patients with asthma and healthy donors. Tregs were expressed as CD25+Foxp3+ gated cells, and Th17 cells as IL‐17A+ROR‐γt+ gated cells, among the CD4+ T cells. (D) Ratio of Tregs to Th17 cells. Wilcoxon signed‐rank test. (E‐G) Reduced proportions of Th1 cells in healthy donors and patients with asthma, owing to gRb1 treatment. IFN‐γ+ T cells were expressed as IFN‐γ+T‐bet+ gated cells, and TNF‐α+ T cells as TNF‐α+T‐bet+ gated cells, among the CD4+ T cells. Wilcoxon signed‐rank test. *p < 0.05, **p < 0.01, ***p < 0.005, ****p < 0.0001. Each point within the graph represents one person. The data are representative of at least 10 separate experiments. The box in a box‐and‐whisker plot extends from the 25th to the 75th percentile, and the whiskers are plotted from the minimum to the maximum. It also plots each individual value as a point overlaid on the graph; n = 10–23 in each group. The t‐SNE plot (generated using FlowJo) was created using a concatenated dataset of data from representative healthy donors and patients with asthma (C and G). PBMC, peripheral blood mononuclear cell; gRb1, ginsenoside Rb1; Healthy, healthy donor; Asthma, patient with asthma; ROR‐γt, Retinoic Acid Receptor‐Related Orphan Receptor γ t; IL, Interleukin; t‐SNE, t‐distributed Stochastic Neighbor Embedding; T‐bet, T‐box transcription factor TBX21; IFN‐γ, Interferon γ; TNF‐α, Tumor Necrosis Factor α.

Similar articles

References

    1. Harb H., Stephen‐Victor E., Crestani E., et al., “A Regulatory T Cell Notch4‐GDF15 Axis Licenses Tissue Inflammation in Asthma,” Nature Immunology 21 (2020): 1359–1370. - PMC - PubMed
    1. Kearley J., Barker J. E., Robinson D. S., and Lloyd C. M., “Resolution of Airway Inflammation and Hyperreactivity After In Vivo Transfer of CD4+CD25+ Regulatory T Cells Is Interleukin 10 Dependent,” Journal of Experimental Medicine 202 (2005): 1539–1547. - PMC - PubMed
    1. Lloyd C. M. and Hessel E. M., “Functions of T Cells in Asthma: More Than Just T(H)2 Cells,” Nature Reviews. Immunology 10 (2010): 838–848. - PMC - PubMed
    1. Khan M. A., “Regulatory T Cells Mediated Immunomodulation During Asthma: A Therapeutic Standpoint,” Journal of Translational Medicine 18 (2020): 456. - PMC - PubMed
    1. Jutel M. and Akdis C. A., “Immunological Mechanisms of Allergen‐Specific Immunotherapy,” Allergy 66 (2011): 725–732. - PubMed

MeSH terms