Review
. 2025 Jun;10(2):307-329.
doi: 10.1177/23969873251332118. Epub 2025 Apr 19.

Conducting descriptive epidemiology and causal inference studies using observational data: A 10-point primer for stroke researchers

Affiliations
Review

Conducting descriptive epidemiology and causal inference studies using observational data: A 10-point primer for stroke researchers

Leonid Churilov et al. Eur Stroke J. 2025 Jun.

Abstract

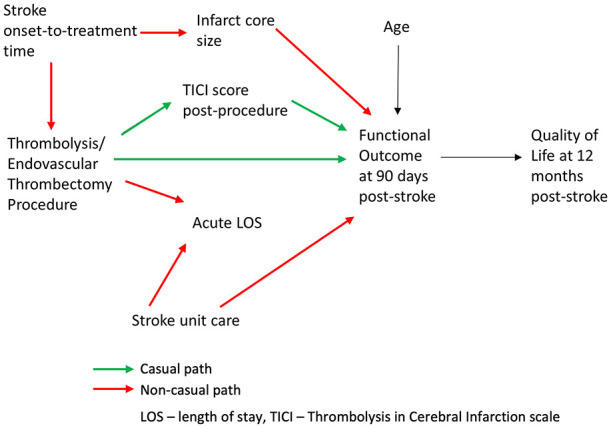
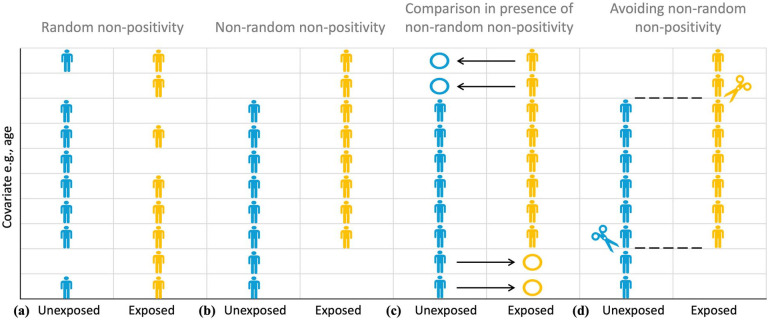
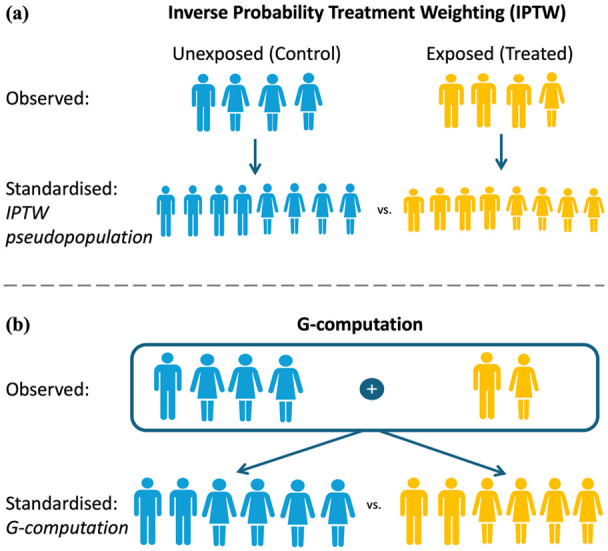
Routinely-collected health data and emerging data-linkage capabilities provide researchers and clinicians with rich opportunities to answer important research questions by conducting observational studies. We provide stroke researchers with 10 important points to consider and implement to ensure the validity and interpretability of descriptive epidemiology and causal inference studies based on observational data. We discuss different types of observational studies and biases that may arise in such studies. We review types of causal effects and the use of Target Trial emulation and Directed Acyclic Graphs to improve validity of observational studies. We also illustrate appropriate and inappropriate use of covariate adjustment for the analyses of observational studies and review the methods for estimating the effects of treatments, interventions, and exposures in causal inference studies. Finally, we provide recommendations for clinical researchers and journal manuscript reviewers in stroke domain and beyond for the appropriate use and reporting of these methods.

Keywords: Stroke; causal inference; observational data.


Conflict of interest statement

Declaration of conflicting interestsThe author(s) declared no potential conflicts of interest with respect to the research, authorship, and/or publication of this article.

Figures

Figure 1.
Figure 1.
Illustrating Point 1. Hierarchy of populations by RECORD Guidelines: source population is shown in gray, database population is shown in yellow, study population is shown in red. Note that the study population may not necessarily fully and appropriately reflect the source population and it is important to examine whether database population is adequate for the study population to be generalized to the intended source population in order to answer the research question(s).
Figure 2.
Figure 2.
(a) Illustrating Point 2. Comparison “as observed” for descriptive epidemiology questions. To answer a descriptive epidemiology question, unexposed (shown in blue) and exposed (shown in yellow) participants need to be compared as they are observed. (b) Illustrating Point 2. Counterfactual comparison for causal inference questions. To answer a causal inference question, unexposed (shown in blue) and exposed (shown in yellow) participants are compared using counterfactual (i.e. counter to the actual fact of exposure) scenarios: first all the participants, irrespective of the actual exposure received, are assumed to be unexposed (blue) and then all the participants are assumed to be exposed (yellow).
Figure 3.
Figure 3.
(a) Illustrating Point 3. Causal inference in a randomized control trial (RCT). Due to the randomness of allocation to exposure (treatment), the participants allocated to exposure (treatment, shown in yellow) or control (shown in blue) arm of the trial are assumed to fully and appropriately represent the respective scenarios where the full study sample would have been exposed (treated) or unexposed. (b) Illustrating Point 3. Causal inference in a non-randomized design is subject to confounding. Both unexposed (blue) and exposed (treated, yellow) participants cannot be assumed to fully and appropriately represent scenarios where the full study sample would have been exposed (treated) or unexposed due to potential confounding. Hence, the comparison of unexposed and exposed participants “as observed” cannot provide the answer to a causal inference question.
Figure 4.
Figure 4.
(a) Illustrating Point 4. Average treatment effect, ATE: what if all the participants in the study sample were exposed (treated, yellow) versus unexposed (blue)? (b) illustrating Point 4. Average treatment effect for the exposed (treated), ATT: what if the exposed (treated, yellow) participants in the study sample were actually not exposed (blue)? and (c) illustrating Point 4. Average treatment effect for the unexposed (untreated), ATU: what if the unexposed (blue) participants in the study sample were actually exposed (treated, yellow)?
Figure 5.
Figure 5.
Illustrating Point 7. Directed Acyclic Graph (DAG) representing causal hypothesis for the effect of a stroke reperfusion therapy on the functional outcome at 90 days post stroke. Causal paths from the exposure (Thrombolysis/Endovascular Thrombectomy Procedure) to the outcome (Functional Outcome at 90 days post-stroke) are shown in green, non-causal paths are shown in red.
Figure 6.
Figure 6.
Illustrating Point 9. The difference between random (a) and non-random (b) non-positivity. Positivity assumption requires that there be both exposed (yellow) and unexposed (blue) participants at every combination of the values of the observed confounders (e.g., age) in the study sample. Non-random (deterministic) non-positivity is illustrated here by older study participants only belonging to the exposed group, making it impossible to elicit a meaningful estimate of exposure effect for such participants due to the absence of a meaningful comparator in the unexposed group (c). The study sample can be trimmed or matched to avoid regions of non-overlap that emerge as the result of non-positivity (d).
Figure 7.
Figure 7.
Illustrating Point 10. Standardisation via Inverse Probability Treatment Weighting (IPTW) based on propensity scores (a) and via G-Computation (b). Under IPTW, re-weighting of the observations is aimed to achieve the exposed and unexposed groups being balanced as the re-weighted confounder distribution under both exposed and unexposed scenarios is the same as total sample. Under G-Computation approach, total-sample confounder distribution is aimed to be achieved because outcome summary measures are taken over all participants in the sample.

Similar articles

Cited by

  • Ultra-early computed tomography markers of haematoma expansion: Potential trial targets?
    Mutimer CA, Sharma S, Zhao H, Meretoja A, Churilov L, Wu TY, Kleinig TJ, Choi PM, Cheung A, Jeng JS, Ma H, Mai DT, Nguyen HT, Sharma G, Campbell BC, Donnan GA, Davis SM, Yassi N. Mutimer CA, et al. Eur Stroke J. 2025 Jul 12:23969873251355938. doi: 10.1177/23969873251355938. Online ahead of print. Eur Stroke J. 2025. PMID: 40650563 Free PMC article.
  • Editorial.
    Petersson J. Petersson J. Eur Stroke J. 2025 Jun;10(2):306. doi: 10.1177/23969873251340774. Epub 2025 Jun 17. Eur Stroke J. 2025. PMID: 40524541 Free PMC article. No abstract available.

References

    1. Benchimol EI, Smeeth L, Guttmann A, et al. The REporting of studies conducted using observational routinely-collected health data (RECORD) statement. PLoS Med 2015; 12: 12. - PMC - PubMed
    1. Vandenbroucke JP, von Elm E, Altman DG, et al. Strengthening the reporting of observational studies in Epidemiology (STROBE): Explanation and elaboration. PLoS Med 2007; 4: e297. - PMC - PubMed
    1. von Elm E, Altman DG, Egger M, et al. The strengthening the reporting of observational studies in Epidemiology (STROBE) statement: guidelines for reporting observational studies. PLoS Med 2007; 4: e296. - PMC - PubMed
    1. Garcia-Esperon C, Bivard A, Johns H, et al. Association of endovascular thrombectomy with functional outcome in patients with acute stroke with a large ischemic core. Neurology 2022; 99: e1345–e1355. - PubMed
    1. Fox MP, Murray EJ, Lesko CR, et al. On the need to revitalize descriptive epidemiology. Am J Epidemiol 2022; 191: 1174–1179. - PMC - PubMed

LinkOut - more resources