. 2025 Jun 4;15(6):jkaf090.
doi: 10.1093/g3journal/jkaf090.

Genome-wide association mapping dissects the selective breeding of determinacy and photoperiod sensitivity in common bean (Phaseolus vulgaris L.)

Affiliations

Genome-wide association mapping dissects the selective breeding of determinacy and photoperiod sensitivity in common bean (Phaseolus vulgaris L.)

Kate E Denning-James et al. G3 (Bethesda). .

Erratum in

Abstract

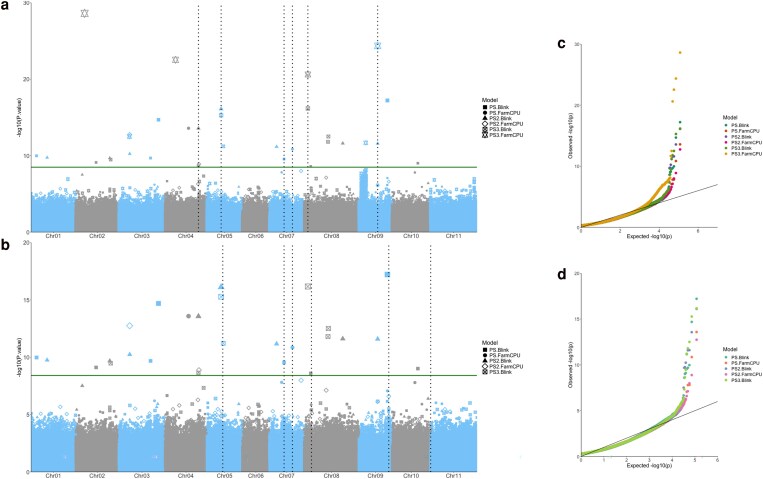
The common bean (Phaseolus vulgaris L.) is a legume pulse crop that provides significant dietary and ecosystem benefits globally. We investigated 2 key traits, determinacy and photoperiod sensitivity, that are integral to its management and crop production, and that were early selected during the domestication of both Mesoamerican and Andean gene pools. Still, significant variation exists among common bean landraces for these traits. Since landraces form the basis for trait introgression in prebreeding, understanding these traits' genetic underpinnings and relation with population structure is vital for guiding breeding and genetic studies. We explored genetic admixture, principal component, and phylogenetic analyses using whole-genome sequencing to define subpopulations and gene pools. We used genome-wide association mapping (GWAS) to identify marker-trait associations in a diversity panel of common bean landraces. We observed a clear correlation between these traits, gene pool, and subpopulation structure. We found extensive admixture between the Andean and Mesoamerican gene pools in some regions. We identified 13 QTLs for determinacy and 10 QTLs for photoperiod sensitivity and underlying causative genes. Our study identified known and novel causative genes and a high proportion of pleiotropic effects for these traits in common bean, and likely translatable to other legume species.

Keywords: GWAS; Plant genetics and genomics; common bean; determinacy; domestication; legume; photoperiod.


Conflict of interest statement

Conflicts of interest: The author(s) declare no conflict of interest.

Figures

Fig. 1.
Fig. 1.
Distribution of the 127 common beans with location data that were used in this study. The coordinates of the capital city were used for those without coordinate data. Produced with QGIS.
Fig. 2.
Fig. 2.
Analysis of the population structure of 144 accessions belonging to our diversity panel focusing on Colombia at K = 2, Andean or Mesoamerican groups a) and K = 6 b). (C-EP) accessions mainly from Peru, then Ecuador and Colombia; (A1) Andean accessions from a variety of South American countries; (C1) mostly determinate Colombian landraces; (C2) indeterminate Colombian landraces; (M1) mainly medium seeded** from Central America and Colombia; (M2) mainly small seeded** from Central America and Colombia. (Admx_AM) Andean X Mesoamerican hybrids; (Admx_A) and (Admx_M) admixed accessions between subpopulations (ancestry composition q < 0.7 at K = 6). **P < 0.01 using a 2-tailed student t-test with unequal variance.
Fig. 3.
Fig. 3.
a) Principle component analysis (PCA) plot of PC1 against PC2. b) Proportion of heterozygous sites against the percentage of read pair alignment to the Andean reference genome G19833 (Schmutz et al. 2014). The colors illustrate the population structure of our diversity panel.
Fig. 4.
Fig. 4.
Pearson correlation coefficients among five agronomic traits and population structure measured in 144 common bean genotypes grown at the Norwich Research Park, Norwich, UK in 2022 and 2023. K6, K6 subgroups from ADMIXTURE; K2, K2 subgroups from ADMIXTURE; D, determinacy; PS, photoperiod sensitivity; SS, seed size; E100_SW, estimated weight of 100 seeds; DTF_W23, DTF from winter 2023; DTF_S22, DTF from summer 2022. *P < 0.05; **P < 0.01; ***P < 0.001.
Fig. 5.
Fig. 5.
Frequency distribution of seed weight and days to flower traits evaluated in 2 seasons in a common bean diversity panel. a) E100_SW, estimated weight of 100 seeds; b) phenological DTF in the summer 2022 (S22_DTF) and c) in the winter 2023 (W23_DTF) at the Norwich Research Park, excluding those which did not flower. The distributions were split into the subpopulations from K6 ADMIXTURE. d) E100_SW***; e) S22_DTF***; f) W23_DTF*. Completed a 1-way ANOVA for E100_SW, S22_DTF, and W23_DTF. *P < 0.05; **P < 0.01; ***P < 0.001.
Fig. 6.
Fig. 6.
Manhattan plots highlighting markers significantly associated with determinacy on (a) the whole panel and b) the Andean subpanel. The analyses were completed with GAPIT and the models are FarmCPU, BLINK, or MLM (Huang et al. 2019; Liu et al. 2016; Wang and Zhang 2021; Zhang et al. 2010). The X-axis represents the genomic position of markers and the Y-axis is the −log 10 of the P-values for association with the phenotype. The vertical lines correspond to QTLs found by at least 2 models. Point size correlates to −log10(P-value). Quantile-quantile (QQ) plots are provided for c) the whole panel and d) the Andean panel.
Fig. 7.
Fig. 7.
Manhattan plots highlighting markers significantly associated with photoperiod insensitivity on (a) the whole panel and b) the Andean subpanel. The analyses were completed with GAPIT and the models FarmCPU, BLINK, or MLM (Zhang et al. 2010; Liu et al. 2016; Huang et al. 2019; Wang and Zhang 2021). The X-axis represents the genomic position of markers and the Y-axis is the −log 10 of the P-values for association with the phenotype. The vertical lines correspond to QTLs found by at least 2 models. Point size correlates to −log10(P-value). Quantile-quantile (QQ) plots are provided for c) the whole panel and d) the Andean panel.

Similar articles

Cited by

References

    1. Alexander DH, Lange K. 2011. Enhancements to the admixture algorithm for individual ancestry estimation. Bmc Bioinformatics. 12(1):246. doi: 10.1186/1471-2105-12-246. - DOI - PMC - PubMed
    1. Ambachew D, Londono JM, Castillo NR, Asfaw A, Blair MW. 2024. Genetic diversity, linkage disequilibrium, and population structure in a common bean reference collection. Agronomy. 14(5):985. doi: 10.3390/agronomy14050985. - DOI
    1. Aoyanagi T, Ikeya S, Kobayashi A, Kozaki A. 2020. Gene regulation via the combination of transcription factors in the indeterminate domain and gras families. Genes (Basel). 11(6):613. doi: 10.3390/genes11060613. - DOI - PMC - PubMed
    1. Arriagada O, Arévalo B, Cabeza RA, Carrasco B, Schwember AR. 2022. Meta-qtl analysis for yield components in common bean (phaseolus vulgaris l.). Plants (Basel). 12(1):117. doi: 10.3390/plants12010117. - DOI - PMC - PubMed
    1. Assefa T, Mahama AA, Brown AV, Cannon EKS, Rubyogo JC, Rao IM, Blair MW, Cannon SB. 2019. A review of breeding objectives, genomic resources, and marker-assisted methods in common bean (phaseolus vulgaris l.). Mol Breed. 39(2):1–23. doi: 10.1007/s11032-018-0920-0. - DOI

LinkOut - more resources