Review
. 2025 Apr 19;28(1):32.
doi: 10.1007/s10071-025-01951-4.

Cognition from genes to ecology: individual differences incognition and its potential role in a social network

Affiliations
Review

Cognition from genes to ecology: individual differences incognition and its potential role in a social network

Brian H Smith. Anim Cogn. .

Abstract

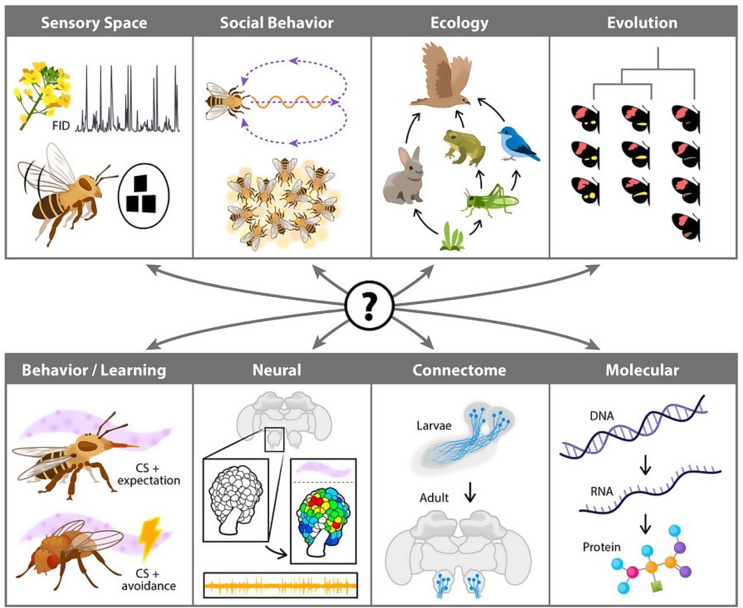
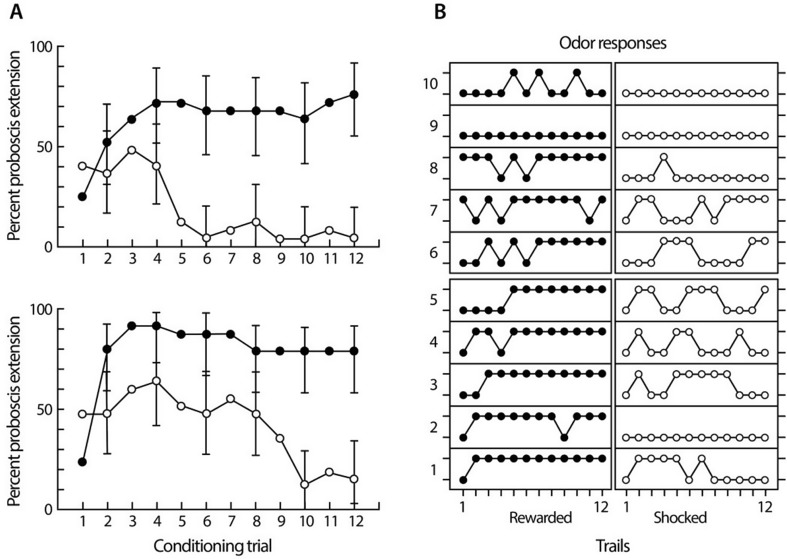
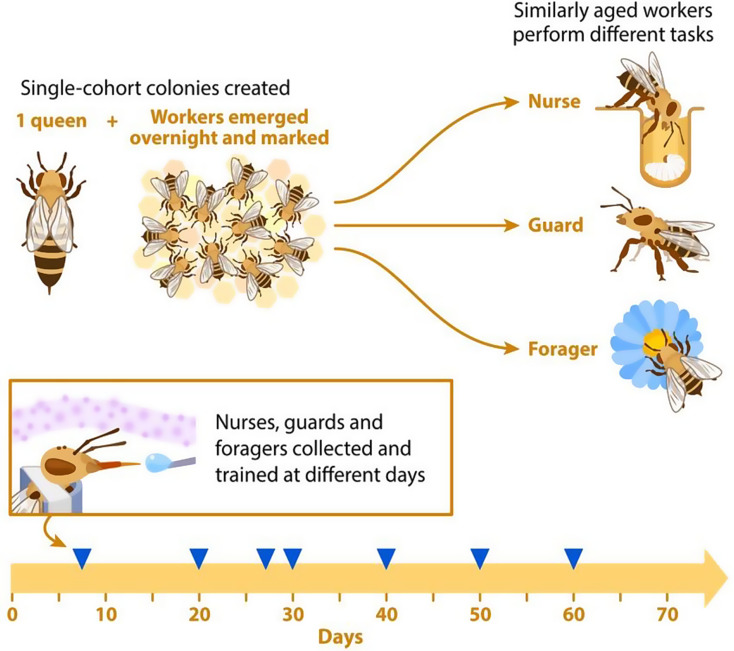
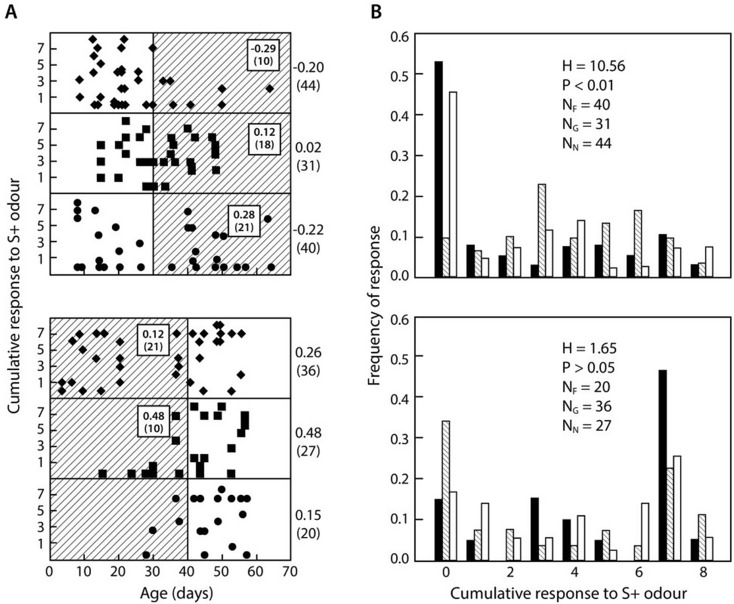
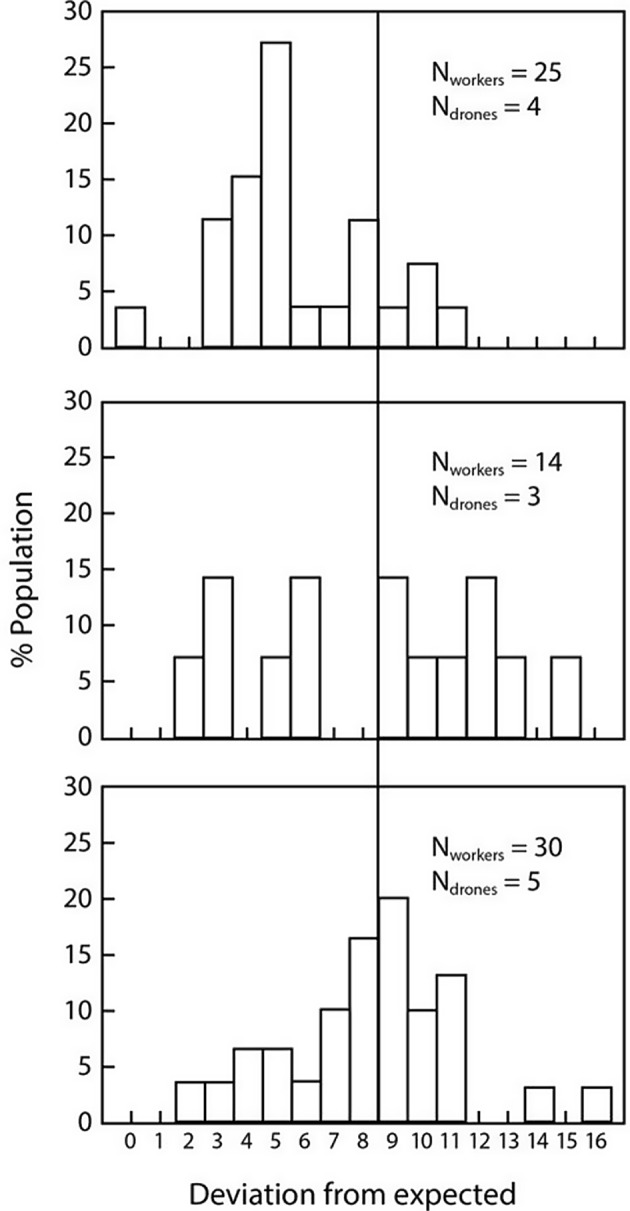
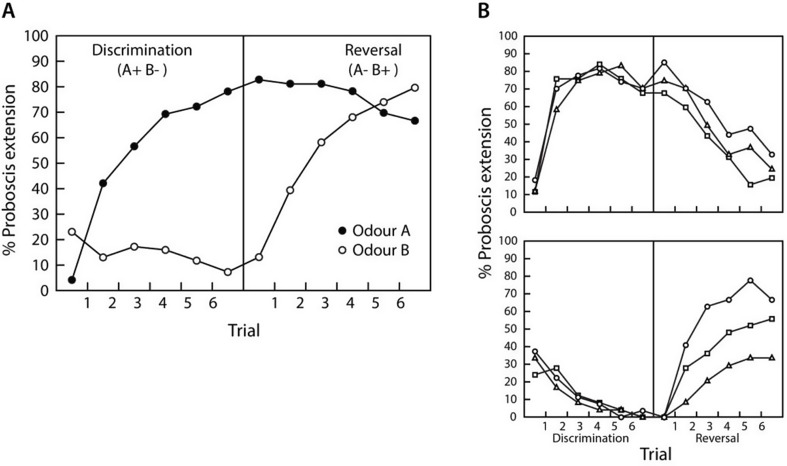
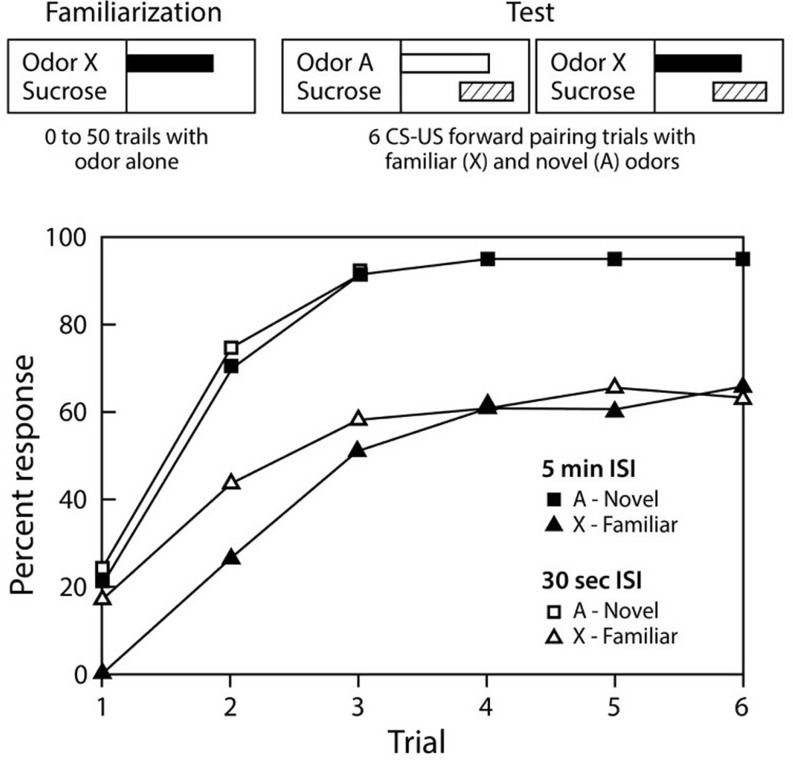
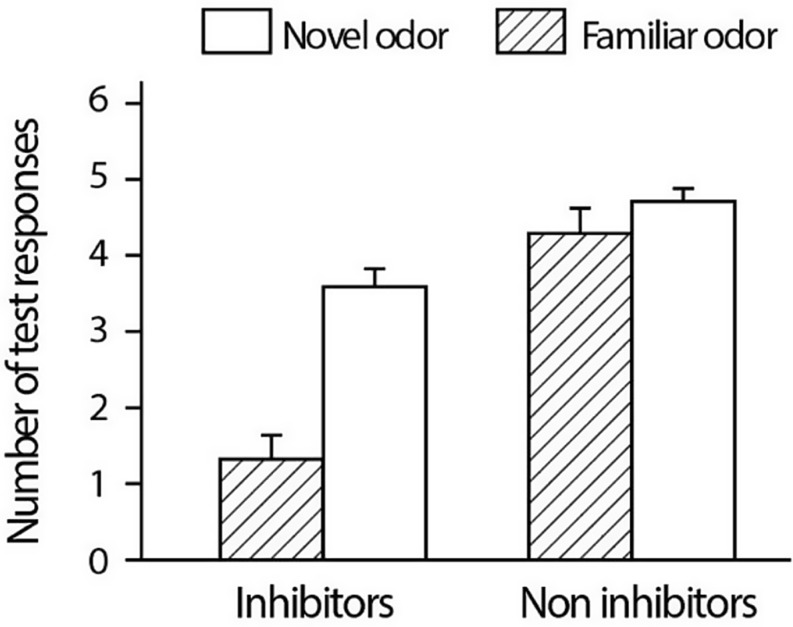
There have now been many reports of intra-colony differences in how individuals learn on a variety of conditioning tasks in both honey bees and bumble bees. Yet the fundamental mechanistic and adaptive bases for this variation have yet to be fully described. This review summarizes a long series of investigations with the honey bee (Apis mellifera) that had the objective of describing the factors that contribute to this variation. Selection on haploid drones for extremes in learning performance revealed that genotype accounted for much of the variance. Neither age nor behavioral caste consistently accounted for observed variation on different conditioning protocols until genotype was controlled. Two subsequent Quantitative Trait Locus mapping studies identified a locus in the honey bee genome with a significant effect on the learning phenotype. Pharmacological and reverse genetic approaches, combined with neurophysiological analyses, confirmed that a biogenic amine receptor for tyramine affects expression of the trait. This work allowed for development of a hypothetical model of how that receptor functions in the brain to produce broad pleiotropic effects on behavior. Subsequent work used genotype as a treatment condition for evaluation of the variation under quasi-natural conditions, which revealed that individual variation reflects how foragers weigh known and novel resources in decision making. This work, together with other studies of individual differences, suggests a unifying framework for understanding how and why individuals differ in cognitive abilities.

Keywords: Genotype; Honey bee; Individual differences; Learning; Social network.


Conflict of interest statement

Declarations. Competing interests: The authors declare no competing interests.

Figures

Fig. 1
Fig. 1
Mapping between levels of biological analyses. Behavior is often studied in the laboratory because of the need to control several variables relevant to behavioral conditioning. In this situation (lower left) activity in neural and molecular networks that underlie it can be monitored and manipulated. But the question remains, how can the behavior studied at that level (lower panels) be mapped onto how it functions and evolves in natural conditions (upper panels)?
Fig. 2
Fig. 2
Population and individual response curves for responses to odor associated with sucrose reinforcement in different training conditions (Smith et al. 1991). A. Percentage of proboscis extension responses to odor under different training conditions. One group of 25 bees (top) received shock punishment if they responded to sucrose touched to the antennae on punished trials (open circles), but they were allowed to feed on the sucrose droplet on the normally reinforced trials (closed circles). A second group of 25 bees did not receive punishment; one odor was reinforced (closed circles) and the second odor was left unreinforced. B. Examples of 10 individual response patterns to odor that were followed by feeding (filled circles) and to odors followed by shock conditional on proboscis extension to sucrose in the context of that odor (open circles). These patterns represent the variety of response patterns that were evident in all conditioning treatments. Within each rectangle that contains the data on trials for a single individual, a symbol falling along the lower tick mark on the y-axes indicates a no response, whereas a symbol falling along the upper tick mark indicates that a proboscis extension response was registered
Fig. 3
Fig. 3
Procedure for setting up a ‘single cohort colony’ (Ueno et al. 2015). Several fames of capped (pupae) brood are placed in an incubator. Newly emerged workers from those frames are collected the next day and distinctively marked with a spot of paint on their thoraces. When placed into a small colony with a queen, these similarly-aged workers divide up into all of the behavioral castes the colony needs for survival. Nurses, guards and foragers can be collected several days (inverted blue triangles) over the lifetime of these workers and then brought into the lab for PER training
Fig. 4
Fig. 4
Results from PER training of different aged nurses, guards and foragers in two different single cohorts(Bhagavan et al. 1994). A. Effect of age on cumulative number of responses to the S + odorant during the acquisition phase for two cohorts represented by the top and bottom figures (range = 0 to 8 responses across 8 trials). Each point represents a single individual that was tested and not replaced within the colony. The hatched areas indicate the time of overlap of the two cohorts within the colony. Numbers within boxes in the hatched areas indicate rank correlation coefficients for those individuals tested during the period of overlap (no number is listed for cohort 2 foragers because so few were found at early ages). Numbers to the right are rank correlation coefficients of cumulative responses versus the entire range of ages tested for the given cohort. Sample sizes are in parentheses; correlation coefficients were never significant (P > 0.05). B. Same data reorganized to show the effect of caste (nurses filled; guards hatched; foragers open) on the cumulative number of responses to the S + odorant during the acquisition phase. Statistical results in the figure are from a Kruskal-Wallis analysis. Sample sizes are listed for foragers, guards and nurse bees
Fig. 5
Fig. 5
Frequency of deviation scores for worker offspring of drones selected for (A) good, (B) random and (C) poor discrimination performance from Bhagavan et al. . Several worker offspring (Nworkers indicates the total number) from each of the drones (Ndrones) that were conditioned. The vertical line through the graphs refers to the median deviation score for the random line. The means for the three groups were significantly different (H = 5.94, P = 0•05) using Kruskal Walis analysis
Fig. 6
Fig. 6
Selection on reversal learning(Ferguson, 2001). A. Reversal learning performance of 69 randomly selected honey bee drones. The y-axis represents the percentage of drones that responded with proboscis extension on each trial with the odor first reinforced by sucrose feeding and then not reinforced during the reversal phase (filled circles), and the odor initially not reinforced and then reinforced during the reversal phase (open circles). Some drones persisted in the learned discrimination from the first phase and reversed slowly if at all. Other drones reversed quickly, within a few trials of the reversal of reinforcement. B. Reversal learning performance of worker honey bee lines selected from drones showing fast reversal (open circles; N = 27), randomly selected drones (open boxes; N = 25) and slow reversal (open triangles; N = 24). The percentage of workers that responded with proboscis extension in response to odor A (top) and odor B (bottom) during discrimination and reversal conditioning phases are separated for clarity
Fig. 7
Fig. 7
Latent Inhibition training in honey bees (Chandra et al. 2010). A. The protocol for latent inhibition training involves unreinforced presentation to an odor for 4 s during the familiarization phase. Different treatment groups received zero to up to 50 such unreinforced exposures separated by either 30 s–5 min. B. During the second ‘Test’ phase the results of familiarization are assayed by training the now familiar odor and a different, novel odor with both odors now equally associated with sucrose reinforcement in a way that should produce robust associative conditioning. Graph shows acquisition after 40 unreinforced exposures during familiarization and 30 s (open symbols) or 5 min (filled symbols) interstimulus intervals. Sample sizes for each group were 23 to 39 bees. In this example, each line represents a different treatment group of bees representing combinations of training with the familiar/novel odors and 30 s/5 min ISI. Subsequent experiments have trained each bee to both the familiar and novel odors presented on separate, pseudorandomly interspersed trials, which produces similar differential responding to the two odors
Fig. 8
Fig. 8
Selection for performance on the Latent Inhibition protocol. Queens and drones that show strong learning of the novel odor and little to no response to the familiar odor (Inhibitors), or strong learning of both odors (Noninhibitors) were mated using instrumental insemination procedures. Workers from each cross were raised in common colonies (after being distinctively marked as to queen of origin). Once of foraging age they were collected and evaluated in the Latent Inhibition procedure (Fig. 7A). Worker learning performance matched that of their parents. The y-axis shows the number of responses across six trials with the familiar and novel odors in workers from Inhibitor and Noninhibitor crosses
Fig. 9
Fig. 9
Foraging experiment with freely flying foragers from colonies of mixed genotypes(Cook et al. 2020). Colonies were first exposed to a fixed location ‘Familiar’ feeder, and then on subsequent days colonies were simultaneously exposed to the Familiar feeder with a new ‘Novel’ feeder in a different position each day. A. Number of all visits to the familiar feeder (open boxes) and a novel feeder (hatched boxes) for each type of colony, when both novel and familiar feeders were presented simultaneously (days 2 to 4). B. Choices of bees of different genotypes in mixed colonies, n = 6 colonies and 6,272 overall visits. The horizontal line in the box is the median, the box is 25 to 75% of the data, whiskers represent 95% of the data, and diamonds show outliers beyond 95%. Different letters above boxes indicate statistically significant differences according to a post hoc Tukey test. Note: The patterns used to indicate Novel and Familiar odors is swapped from Fig. 8. The original patterns are maintained to be consistent with original publications
Fig. 10
Fig. 10
Differences in dance outcome and performance in genetic lines (Cook et al. 2019). A. Proportion of dances performed per genetic line type that were either followed by at least one individual (open) or not followed by any other bees (hatched). Differences were significant ( χ2 = 13.93, df = 2, P < 0.001). B. Rate of turns per second in a dance by line. The large black dot in the violin is the mean, the white box encompasses 25 to 75% bounds of the data, and whiskers represent 95% of the data. The violin shapes illustrate distribution of the data. Differences between violins were significant (ANOVA: χ2 = 12.8, df = 2, P = 0.002: including a control line (not shown here) that combined the high and low bees)

Similar articles

References

    1. Barth MB, Moritz RF, Kraus FB (2014) The evolution of extreme polyandry in social insects: insights from army ants. PLoS ONE 9(8):e105621. 10.1371/journal.pone.0105621 - PMC - PubMed
    1. Batten SR, Bang D, Kopell BH, Davis AN, Heflin M, Fu Q, Montague PR (2024) Dopamine and serotonin in human substantia Nigra track social context and value signals during economic exchange. Nat Hum Behav 8(4):718–728. 10.1038/s41562-024-01831-w - PMC - PubMed
    1. Bazhenov M, Huerta R, Smith BH (2013) A computational framework for Understanding decision making through integration of basic learning rules. J Neurosci 33(13):5686–5697. 10.1523/jneurosci.4145-12.2013 - PMC - PubMed
    1. Benatar ST, Cobey S, Smith BH (1995) Selection on a haploid geneotype for discrimination learning performance: correlation between drone honey bees (Apis mellifera) and their worker progeny (Hymenoptera: Apidae). J Insect Behav 8(5):637–652
    1. Bhagavan S, Benatar S, Cobey S, Smith B (1994) Effect of genotype but not of age or caste on olfactory learning performance in the honey bee, apis mellifera. Animal Behaviour, pp 1357–1369

LinkOut - more resources