. 2025 Jul:65:101165.
doi: 10.1016/j.neo.2025.101165. Epub 2025 Apr 18.

Activation of PERK/eIF2α/ATF4 signaling inhibits ERα expression in breast cancer

Affiliations

Activation of PERK/eIF2α/ATF4 signaling inhibits ERα expression in breast cancer

Yuanli Wu et al. Neoplasia. 2025 Jul.

Abstract

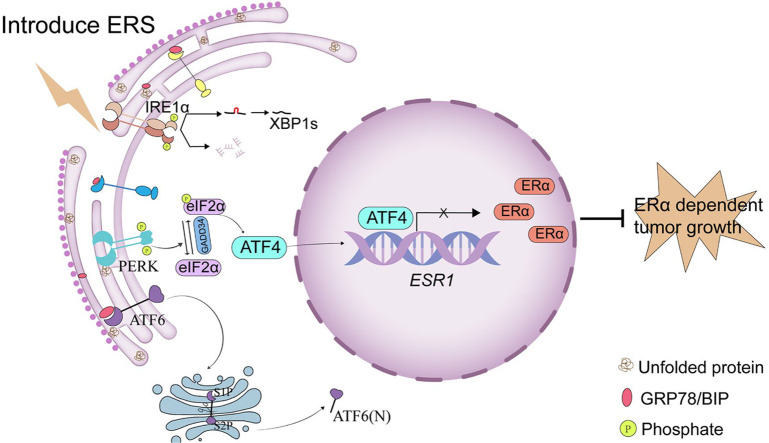
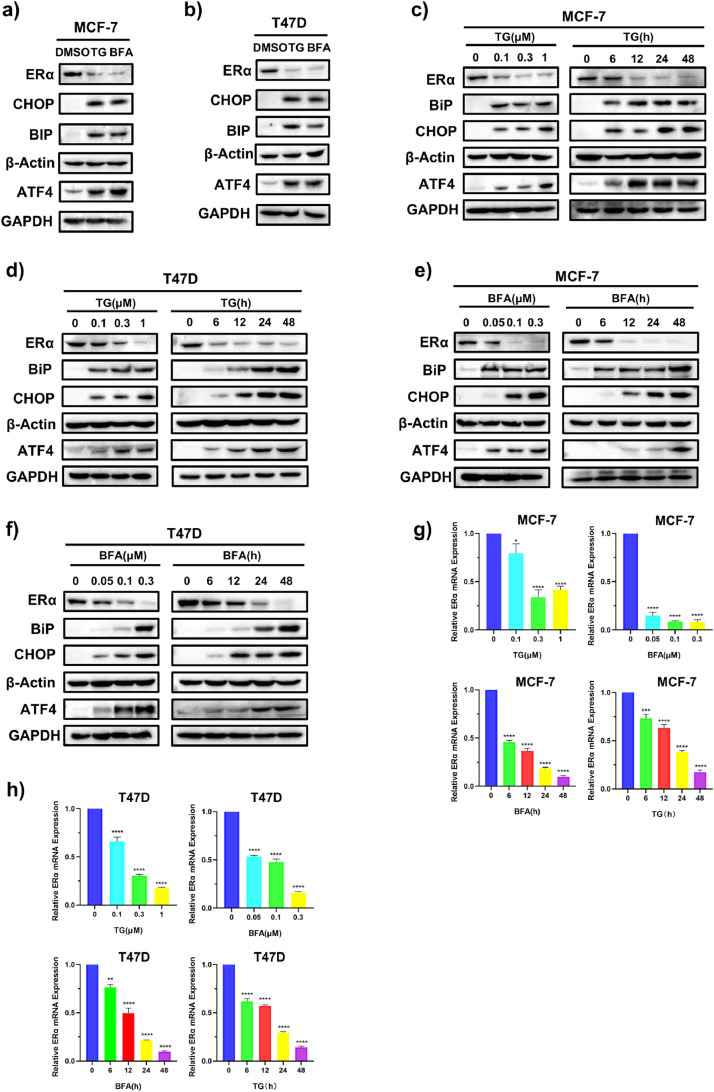
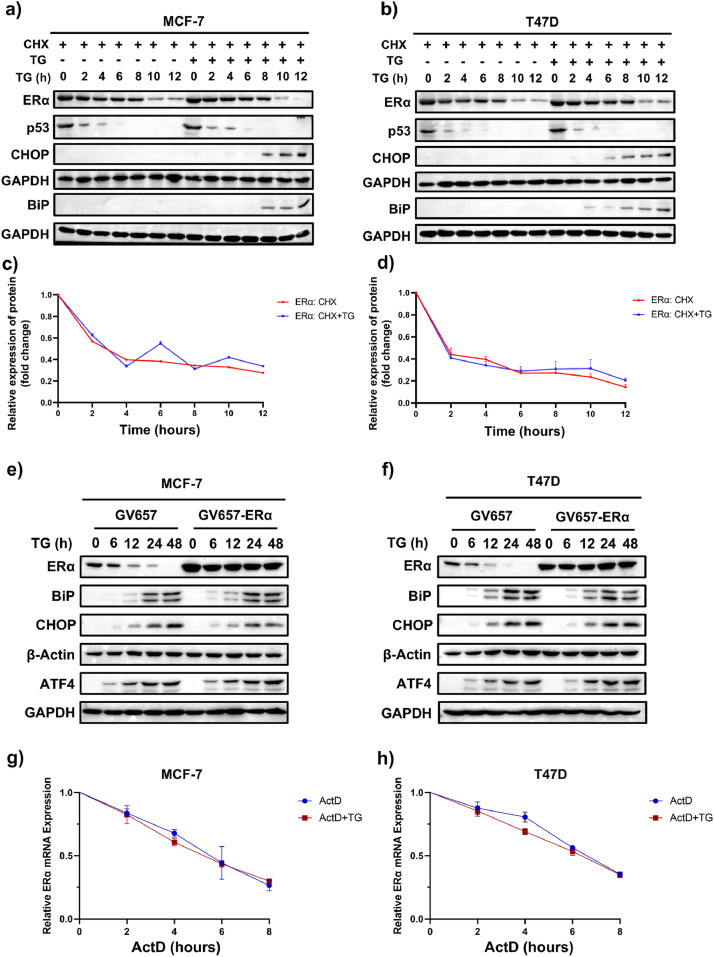
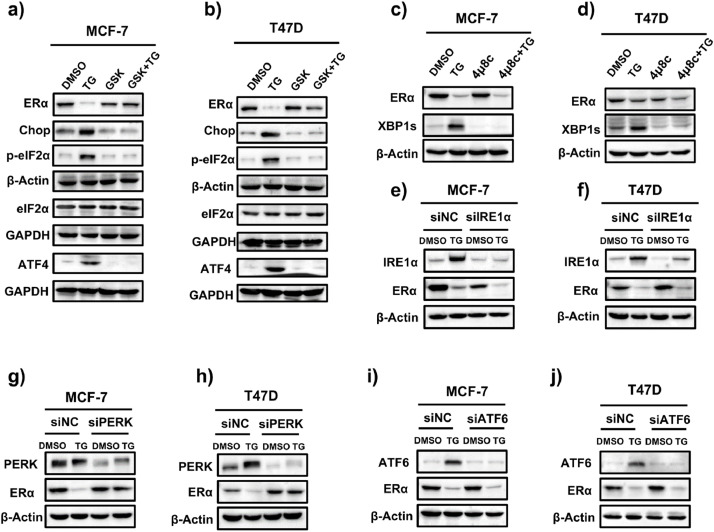
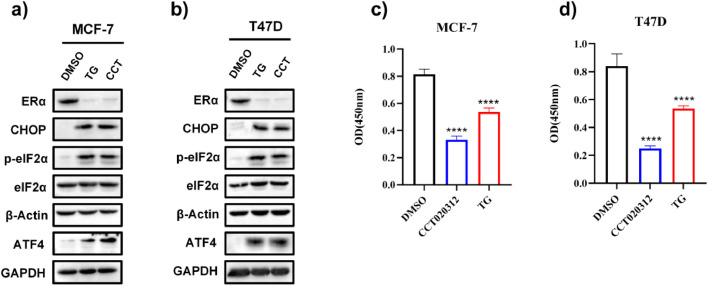
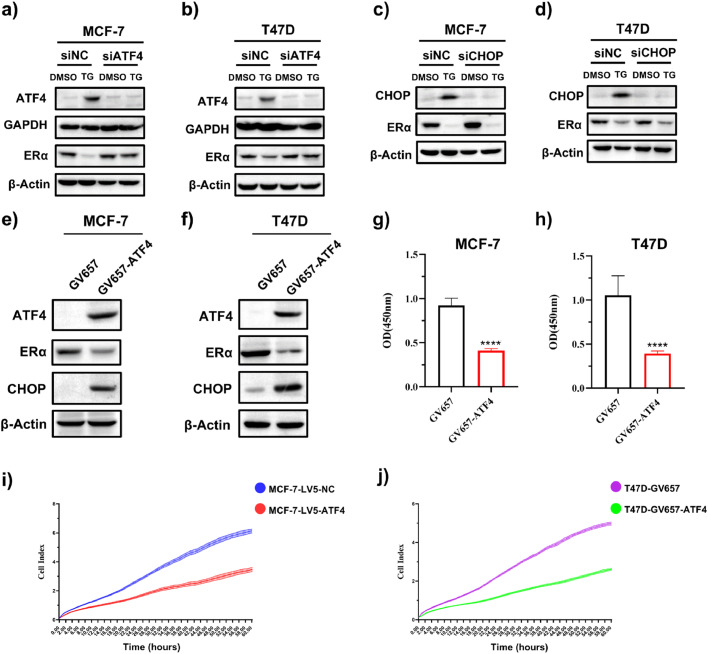
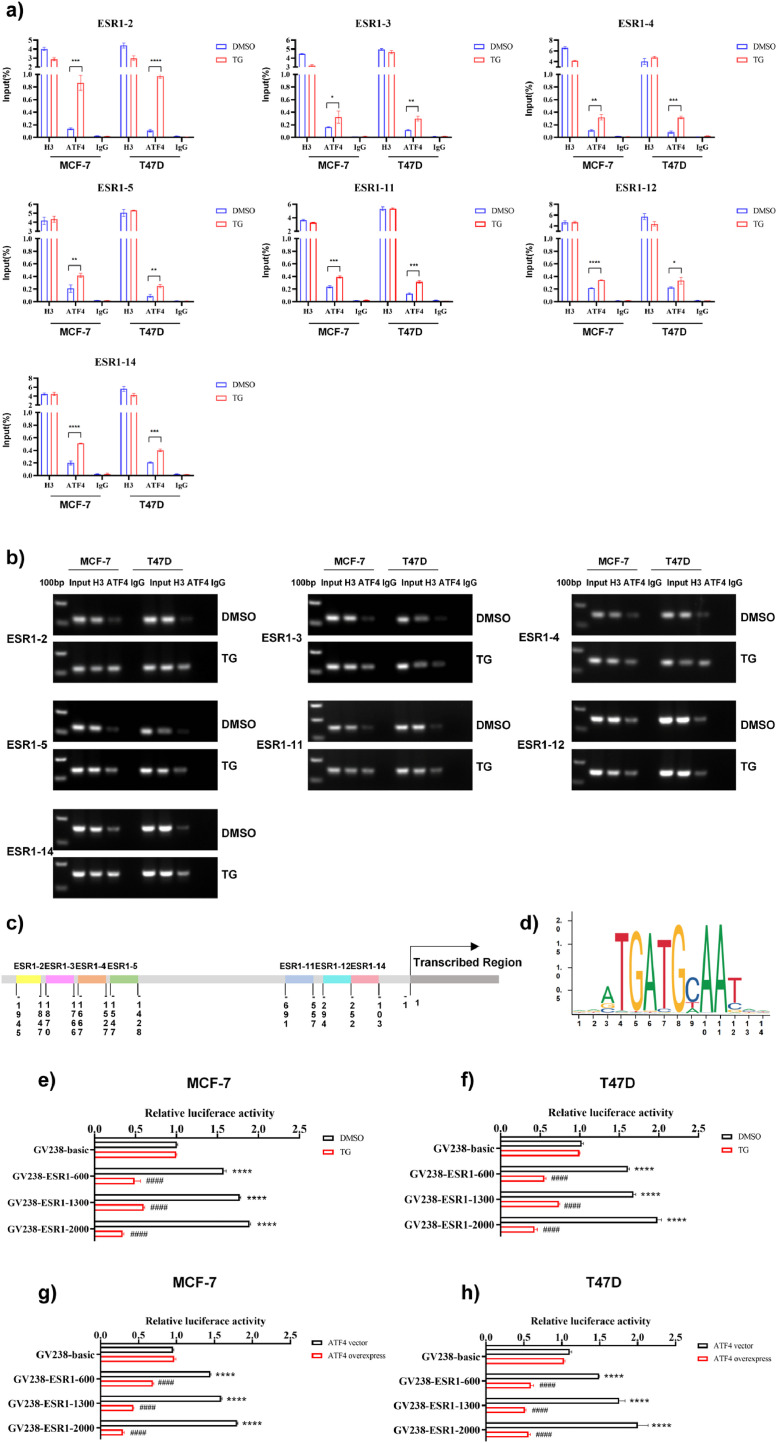
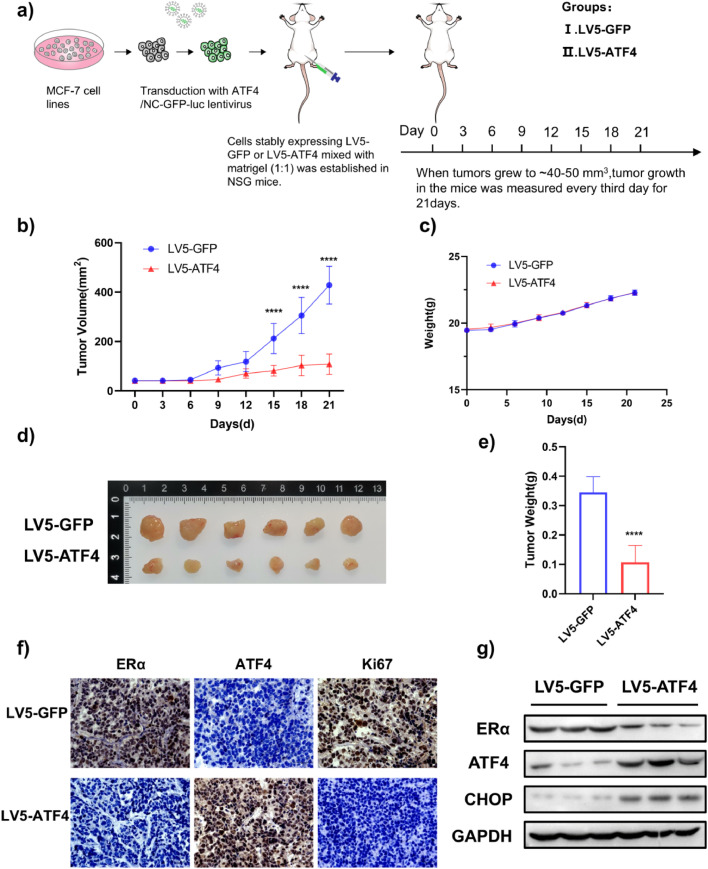
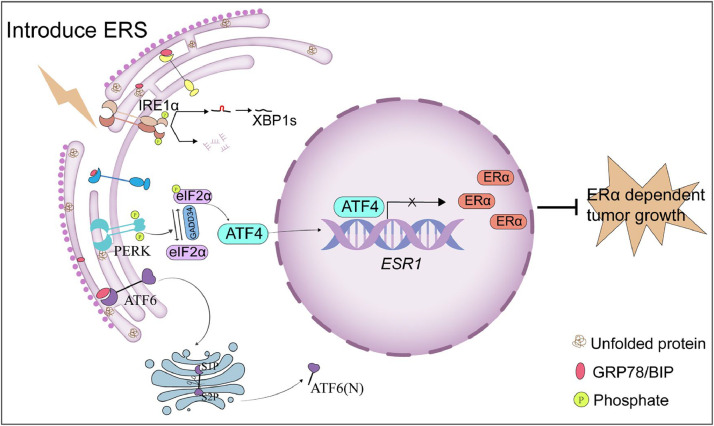
Approximately 70-80% of breast cancers rely on estrogen receptor alpha (ERα) for growth. The unfolded protein response (UPR), a cellular response to endoplasmic reticulum stress (ERS), is an important process crucial for oncogenic transformation. The effect of ERS on ERα expression and signaling remains incompletely elucidated. Here, we focused on the regulatory mechanisms of ERS on ERα expression in ER-positive breast cancer (ER+ BC). Our results demonstrate that ERα protein and mRNA levels in ER+ BC cells are considerably reduced by the ERS inducers thapsigargin (TG) and brefeldin A (BFA) via the PERK/eIF2α/ATF4 signaling pathway. ChIP-qPCR and luciferase reporter gene analysis revealed that ERS induction facilitated ATF4 binding to the ESR1 (the gene encoding ERα) promoter region, thereby suppressing ESR1 promoter activity and inhibiting ERα expression. Furthermore, selective activation of PERK signaling or ATF4 overexpression attenuated ERα expression and tumor cell growth both in vitro and in vivo. In conclusion, our results demonstrate that ERS suppresses ERα expression transcriptionally via the PERK/eIF2α/ATF4 signaling. Our study provides insights into the treatment of ER+ BC by targeting ERα signaling through selective activation of the PERK branch of the UPR.

Keywords: ATF4; Breast cancer; ERα; ESR1; Endoplasmic reticulum stress; Unfolded protein response.


Conflict of interest statement

Declaration of competing interest The authors declare that they have no known competing financial interests or personal relationships that could have appeared to influence the work reported in this paper.

Figures

Image, graphical abstract
Graphical abstract
Fig 1
Fig. 1
ERS inducers decrease ERα protein and mRNA levels in ER+ BC cell lines. (a, b) After exposure to 1 μM TG or 0.3 μM BFA for 24 h, MCF-7 (a) and T47D cells (b) were harvested for western blotting. (c, d) MCF-7 (c) and T47D (d) cells were treated with different concentrations of TG for 24 h or with 1 μM TG for the indicated time, and then cells were collected for western blotting. (e, f) MCF-7 (e) and T47D (f) cells were treated with different concentrations of BFA for 24 h or with 0.3 μM BFA for the indicated time, and then cells were collected for western blotting. (g, h) MCF-7 (g) and T47D (h) cells were treated with different concentrations of TG or BFA for 24 h or 1 μM TG or 0.3 μM BFA for the indicated time. Then, cells were collected for quantitative RT-PCR assay. The relative expression of ERα mRNA was normalized to that of β-Actin and presented as the mean ± SD (n = 4). Student's t test, *p < 0.05, **p < 0.01, ***p < 0.001, or ****p < 0.0001 vs. control. TG, thapsigargin; BFA, brefeldin A.
Fig 2
Fig. 2
ERS downregulates ERα expression at the transcriptional level in ER+ BC cells. (a, b) MCF-7 (a) and T47D (b) cells were pretreated with 100 μg/mL CHX for 1 h and then treated with or without 1 μM TG for the indicated times. After TG treatment, cells were collected for western blotting. p53 is a short live protein served as a control for CHX treatment. (c, d) Quantification of ERα protein normalized to GAPDH in MCF-7 (c) and T47D (d) cells (n=3). (e, f) MCF-7 (e) and T47D (f) cells were transfected with empty vector (GV657) or ERα overexpression vector (GV657-ERα) and then treated with or without TG for the indicated times. Cells were collected for western blotting. (g, h) MCF-7 (g) and T47D (h) cells were pretreated with 1 μg/mL ActD for 0.5 h and then treated with or without 1 μM TG for the indicated time. Then, cells were collected for quantitative RT-PCR assay (n = 4). All data are presented as mean ± SD. Statistical significance determined by Student's t test. The abbreviations TG, BFA, CHX, and ActD stand for thapsigargin, brefeldin A, cycloheximide, and actinomycin D, respectively.
Fig 3
Fig. 3
ERS inhibits ERα expression through the PERK signaling in ER+ BC cell lines. (a, b) MCF-7 (a) and T47D (b) cells were pretreated with 1 μM GSK2656157 (GSK) for 1 h, followed by treatment with or without 1 μM TG for 24 h. Cells were then harvested for western blotting. (c, d) MCF-7 (c) and T47D (d) cells were pretreated with 25 μM 4μ8C for 1 h, followed by treatment with or without 1 μM TG for 24 h. Then cells were collected for western blotting. (e, f) MCF-7 (e) and T47D (f) cells were transfected with control siRNA (siNC) or IRE1α siRNA (siIRE1α) for 24 h, followed by treatment with or without TG for 24 h. Cells were collected for western blotting. (g, h) MCF-7 (g) and T47D (h) cells were transfected with siNC or PERK siRNA (siPERK) for 24 h, followed by treatment with or without TG for 24 h. Cells were collected for western blotting. (i, j) MCF-7 (i) and T47D (j) cells were transfected with siNC or ATF6 siRNA (siATF6) for 24 h, followed by treatment with or without TG for 24 h. Cells were collected for western blotting.
Fig 4
Fig. 4
The selective EIF2AK3/PERK activator CCT020312 decreases ERα expression and cell viability in ER+ BC cell lines. (a, b) MCF-7 (a) and T47D (b) cells were treated with 14 μM CCT020312 or 1 μM TG for 24 h. Then cells were collected for western blotting. (c, d) MCF-7 (c) and T47D (d) cells were treated with 14 μM CCT020312 or 1 μM TG for 24 h. CCK-8 assay was used to analyse the cell viability (n = 6). One-way ANOVA analysis, ****p < 0.0001 vs. control.
Fig 5
Fig. 5
ERS decreases ERα expression through ATF4 in ER+ BC cell lines. (a, b) MCF-7 (a) and T47D (b) cells were transfected with control siRNA (siNC) or ATF4 siRNA (siATF4) for 24 h, followed by treatment with or without TG for 24 h. Cells were harvested for western blotting. (c, d) MCF-7 (c) and T47D (d) cells were transfected with siNC or CHOP siRNA (siCHOP) for 24 h, followed by treatment with or without TG for 24 h. Cells were harvested for western blotting. (e-h) MCF-7 and T47D cells were transfected with empty control plasmid GV657 or ATF4 overexpression plasmid (GV657-ATF4). Cells were harvested for western blotting (e, f) or subjected to CCK-8 assays (n = 6) (g, h). Student's t test, ****p < 0.0001 vs. GV657 control. (i) MCF-7 cells were transduced with control lentivirus (LV5-GFP) or ATF4-expressing lentivirus (LV5-ATF4), and (j) T47D cells were transfected with empty vector control GV657 or GV657-ATF4. Cell proliferation was detected using xCELLigence real-time cell analysis (n = 3).
Fig 6
Fig. 6
ATF4 binds to the ESR1 promoter region and suppresses ESR1 promoter activity. (a) The ChIP-qPCR assay was conducted with ATF4 antibody in MCF-7 and T47D cells that were treated with or without 1 μM TG for 24 h. DNA enrichment was quantified by qPCR with standard curves generated from serially diluted input DNA and expressed as mean ± SD (n = 3). Student's t test, ns p > 0.05, *p < 0.05, **p < 0.01, ***p < 0.001, or ****p < 0.0001 vs. control. (b) ChIP-qPCR products were visualized by electrophoresis in a 2% agarose-gel. (c) Schematic diagram of the ESR1 promoter region showing ATF4 binding sites. (d) The potential binding sites of ATF4 on the ESR1 promoter were predicted by JASPAR. (e, f) MCF-7 (e) and T47D cells (f) were transfected with ESR1 luciferase reporter plasmids or control plasmid GV238-Basic and then treated with 1 μM TG. Luciferase activities were measured using a dual-luciferase reporter assay system according to the manufacturer's protocol. The relative luciferase activity was calculated and expressed as the mean ± SD. Student's t test, ****p < 0.0001 vs. GV238-Basic (DMSO); ####p < 0.0001 vs. corresponding GV238-ESR1 (n = 3). (g, h) ESR1 luciferase reporter plasmids and ATF4 overexpression plasmids or empty vector control were co-transfected into MCF-7 (g) and T47D cells (h). Luciferase activities were measured and the relative luciferase activity was calculated and expressed as the mean ± SD. Student's t test, ****p < 0.0001 vs. GV238-Basic (DMSO); ####p < 0.0001 vs. corresponding GV238-ESR1 (n = 3). ChIP-qPCR, chromatin immunoprecipitation-quantitative PCR.
Fig 7
Fig. 7
ATF4 overexpression inhibits ERα expression and tumor growth in an MCF-7 orthotopic xenograft model. (a) Schematic of the experimental design for the MCF-7 orthotopic xenograft model. (b) Effect of ATF4 overexpression on the growth of MCF-7 xenograft tumors. Tumor volume was measured every 3 days and presented as the mean ± SD. Student's t test, ****p < 0.0001 vs. LV5-GFP, n = 6. (c) Body weight changes in mice during the 21-day study period (n = 6). (d) Representative image of tumors from each group. (e) Tumor weight was measured at the end of the study. Student's t test, ****p < 0.0001 vs. LV5-GFP, n = 6. (f) Immunohistochemical staining of Ki-67 and ERα in tumor sections. Scale bar: 50 μm. (g) Representative tumor tissues from each group were prepared and subjected to western blot analysis.
Fig 8
Fig. 8
Proposed mechanism of ERS-mediated suppression of ERα expression. ERS activates the PERK/eIF2α/ATF4 signaling pathway, leading to ATF4 binding at the ESR1 promoter and repression of its transcriptional activity, thereby suppressing ESR1 expression.

Similar articles

References

    1. Kumar N., Gulati H.K., Sharma A., et al. Most recent strategies targeting estrogen receptor alpha for the treatment of breast cancer. Mol. Divers. 2021;25(1):603–624. doi: 10.1007/s11030-020-10133-y. - DOI - PubMed
    1. Grabher BJ. Breast cancer: evaluating tumor estrogen receptor status with molecular imaging to increase response to therapy and improve patient outcomes. J. Nucl. Med. Technol. 2020;48(3):191–201. doi: 10.2967/jnmt.119.239020. - DOI - PubMed
    1. Rossing M., Pedersen C.B., Tvedskov T., et al. Clinical implications of intrinsic molecular subtypes of breast cancer for sentinel node status. Sci. Rep. 2021;11(1):2259. doi: 10.1038/s41598-021-81538-4. - DOI - PMC - PubMed
    1. Freelander A., Brown L.J., Parker A., et al. Molecular biomarkers for contemporary therapies in hormone receptor-positive breast cancer. Genes. (Basel) 2021;12(2) doi: 10.3390/genes12020285. - DOI - PMC - PubMed
    1. Engelsman E., Korsten C.B., Persijn J.P., et al. Human breast cancer and estrogen receptor. Arch. Chir. Neerl. 1973;25(4):393–397. - PubMed

Publication types

MeSH terms